Bravura Solutions
This analysis is based on closing-price data as of September 18, 2026. Whether you're researching Bravura Solutions (BVS) on the ASX or learning how to read stock charts, here are objective support, resistance and technical invalidation levels built from the RSI, MACD and ATR indicators.
Bravura Solutions closed the week at $3.13, 13.8% below its $3.63 52-week high and 78.3% above the $1.76 low that anchors the two-year chart. The reason it appears on the pullback screen is a shallow retracement rather than a breakout: after a 50.8% run from the $2.38 swing low of July 24 to the $3.59 high of August 14, price has drifted back to sit 0.7% above its $3.109 SMA20 and exactly on the 38.2% retracement of that swing at $3.1278 — the shallowest level of the standard grid. One caution about the moving-average reading before anything else: the complete SMA5 > SMA20 > SMA60 ordering was finished only in Friday's own session, so that arrangement is one session old and is the newest thing on this chart, not its foundation. The evidence underneath is genuinely split — Mansfield relative strength of +27.9% against the S&P/ASX 200 and a flagged bullish OBV divergence on one side, a flagged bearish RSI divergence, a MACD dead cross from August 25 and an ADX of 19.4 that describes no directional regime at all on the other.
Snapshot as of September 18, 2026
| Item | Value | Reading |
|---|---|---|
| Close | $3.13 | −13.8% from 52w high · +78.3% from 52w low |
| 52-week range | $1.76 – $3.63 | Well up in the range, but the high is 16.0% overhead; the nearer ceiling is the $3.59 swing high of Aug 14, 2026 |
| SMA 5 / 20 / 60 | $3.13 / $3.109 / $2.771 | Close 0.7% above SMA20 and 12.9% above SMA60 — but the full 5 > 20 > 60 ordering completed only in the Sep 18 session itself, so it is one session old |
| Bollinger (20) | $3.216 / $3.109 / $3.002 | Band width 6.87% — a narrow envelope. The close sits mid-channel, 2.7% under the upper band and 4.1% over the lower |
| aVWAP (2y anchor Aug 13, 2025) | $2.48 | Price 26.0% above the long-horizon anchored average |
| aVWAP (90d anchor Jul 10, 2026) | $2.96 | Price 5.6% above — the cohort anchored to the July advance is still onside |
| RSI(14) | 54.7 | Mid-range, neither stretched nor washed out, but a bearish divergence is flagged: $3.16 at RSI 59.18 on Aug 31 versus $3.18 at RSI 58.26 on Sep 16 |
| Mansfield RS (vs the S&P/ASX 200) | +27.9% | Outperforming with a rising slope: +2.61 points on the week, but −5.83 points against where it stood a month ago |
| MACD (12,26,9) | 0.0499 / 0.0649 / −0.0150 | Dead cross of Aug 25, 2026; the histogram is still negative, though both lines remain above zero |
| ADX(14) | 19.4 | Below 20 — a ranging reading with no directional regime in force (19.1 on the two-year frame) |
| ATR(14) | $0.110 (3.5%) | A wide daily range for a $3 share — 1×ATR alone covers most of the distance to the SMA20 shelf |
| OBV (2y / 90d) | early distribution / early distribution | Below MA20 on both frames — gaps of −2.88% and −8.8% — with a flat slope. A bullish divergence is flagged on both frames all the same |
| Volume vs 20d avg | 1.94× | 2,440,683 shares against a 1,257,302 average — but Sep 18 was the S&P/ASX September rebalance trade day and turnover was elevated across the whole market, so this ratio is not a stock-specific reading (see section ②) |
| Fibonacci 38.2% | $3.128 | The close sits on the 38.2% retracement of the $2.38–$3.59 swing (Jul 24 to Aug 14, 2026) |
| Unfilled gap | $2.85 – $3.09 | Support gap of Aug 12, 2026, still open immediately beneath the close |
| 1×ATR / 2×ATR technical invalidation | $3.02 / $2.91 | Volatility-based structural reference levels below the close |
① Price & Moving Averages
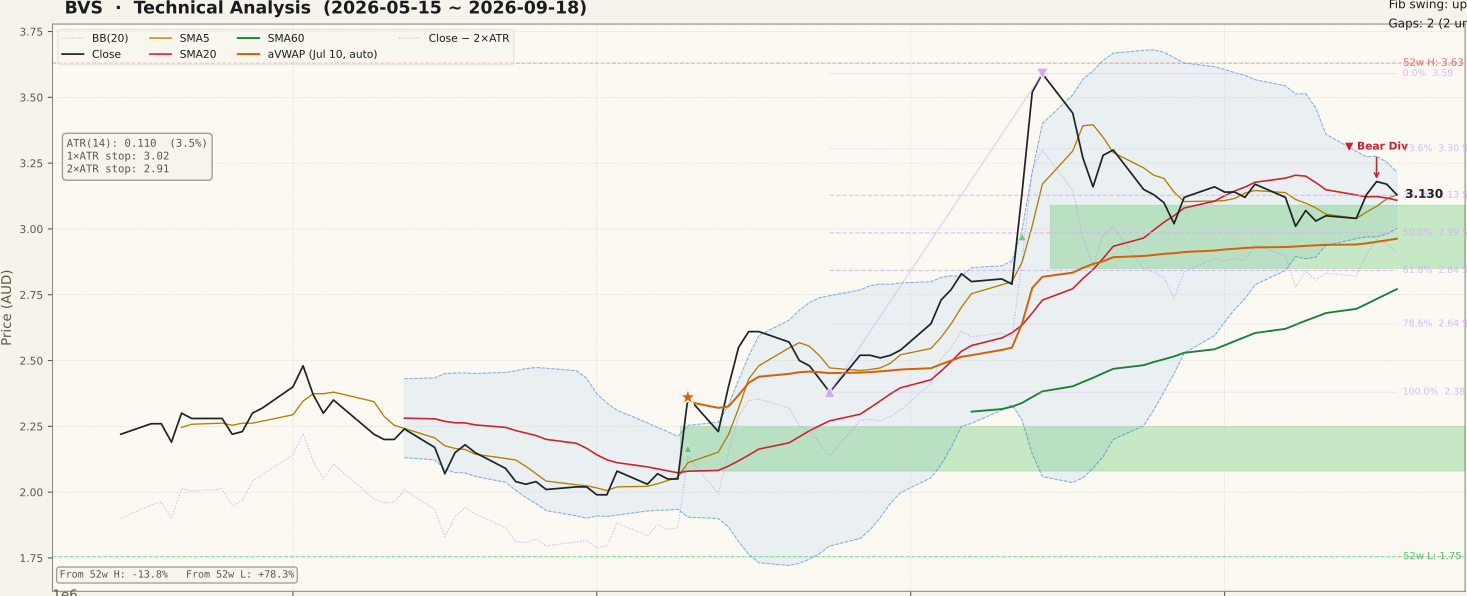
BVS_price-90d-2026-09-20.svgThe structure here is a shallow pullback inside a prior advance, and it is worth being precise about which parts of it are old and which are one day old. The complete SMA5 ($3.13) > SMA20 ($3.109) > SMA60 ($2.771) ordering was only completed in the September 18 session itself. A single session of alignment carries no track record, and reading it as an established trend is exactly the error this chart invites. What the screen actually identified is narrower and does not depend on that ordering: SMA5 above SMA20, with the close 0.7% above the 20-day line — price that has pulled back but never lost contact with its own mean.
The retracement measures cleanly. From the $2.38 low of July 24 to the $3.59 high of August 14 — a 50.8% advance — the pullback has reached the 38.2% level at $3.1278, and Friday's $3.13 close is effectively sitting on it. The 50% level is at $2.985 and the 61.8% at $2.842, so there is a defined grid beneath if this one gives way. Bollinger width is 6.87%, a narrow envelope, with the close mid-channel: $3.216 above, $3.002 below, and the $3.109 mid line doubling as the SMA20.
Both anchored VWAPs sit below price — $2.48 from the August 13, 2025 anchor and $2.96 from the July 10, 2026 anchor — so on both horizons the average participant is onside rather than underwater. The nearest structure below the close is dense: the $3.09 top edge of the unfilled August 12 gap ($2.85–$3.09) is only 1.3% away, and the lower band, the 50% retracement and the 2×ATR line at $2.91 all cluster within 7% beneath. Overhead, $3.216, $3.30 (23.6% retracement) and the $3.59 August high are the sequence.
② Volume

BVS_volume-90d-2026-09-20.svgThe panel shows 2,440,683 shares against a 1,257,302 twenty-day average — a ratio of 1.94×. On an ordinary week that figure would be the headline of this section. This was not an ordinary session. September 18 was the S&P/ASX September quarterly rebalance trade day: the index changes were announced on September 4 and take effect before the open on Monday September 21, which concentrates index-fund flow into the final session before the change.
The market-wide effect is measurable. Across the 227-stock screening universe the median volume ratio on September 18 was 2.04×, against a range of 0.66× to 1.01× on each of the eleven sessions that preceded it. Bravura Solutions' 1.94× is therefore below the market median for that day — roughly 0.95× once the market-wide lift is removed, which is to say entirely ordinary. Bravura Solutions is not itself an index-change stock.
The correct reading is that this week's turnover is uninformative for this name in either direction. It is not evidence for the pullback structure and it is not evidence against it; the number simply belongs to the day rather than to the stock. This is a standing trap on rebalance, quarterly expiry and end-of-quarter sessions, where a raw volume ratio measures the calendar and not the company. The first clean read on turnover here arrives in the week beginning September 21.
③ MACD

BVS_macd-90d-2026-09-20.svgMACD sits at 0.0499 against a 0.0649 signal line, with the histogram at −0.0150. The dead cross dates to August 25, 2026, which lines up with the beginning of the drift back from the August high, and three and a half weeks later it has not been recovered. On a pullback chart that is the expected shape rather than a surprise — momentum cools while price retraces — but it remains unrepaired, and an unrepaired dead cross is what separates a pullback that is resolving from one that is merely pausing.
The mitigating detail is position relative to zero: both lines are above it. A dead cross well above the zero line describes a loss of upward momentum inside a positive regime; a dead cross beneath zero would describe something closer to a trend change. The histogram at −0.0150 is shallow relative to the 0.0499 MACD reading, so the two lines are close rather than diverging hard.
What would change the reading is direction, not level. A histogram that narrows back toward zero and a fresh golden cross with both lines still above zero would mark August and September as consolidation. A histogram that deepens while price loses the $3.109 line reads the other way.
④ RSI

BVS_rsi-90d-2026-09-20.svgRSI(14) is 54.7 — mid-range, neither overbought above 70 nor oversold below 30, and consistent with a pullback that has removed froth without inflicting damage. The panel does, however, flag a bearish divergence, and it is specific: a peak of $3.16 on August 31 at RSI 59.18, then a higher price peak of $3.18 on September 16 at a lower RSI of 58.26.
Weigh that carefully rather than accept it at face value. The gap between the two RSI readings is 0.92 points, and both sit in the mid-50s rather than in overbought territory — this is a divergence measured between two unremarkable peaks, not one measured down from an exhaustion high. Divergences carried from RSI 85 down to RSI 69 describe a move running out of fuel; a 0.92-point drift between two peaks at 59 and 58 is a much weaker statement.
The discipline is the same either way: a divergence is a possibility of reversal, never a confirmation of one, and it needs price to agree before it means anything. The most common beginner error on a panel like this is to call a top from the divergence alone. Here the price confirmation the divergence lacks would be a daily close beneath $3.109, and until that arrives the RSI reading is a caution rather than a conclusion.
⑤ Mansfield Relative Strength

BVS_rs-90d-2026-09-20.svgMansfield RS is +27.9% against the S&P/ASX 200, firmly above the zero line, with the panel state reading outperform and the slope rising. Above zero means this stock has been beating the index over the measured window, and the reading is anchor-free, so the 2-year and 90-day panels agree at the same value.
The two increments point different ways, and both belong in the record. Against last week's +25.33 the change is +2.61 points, which in positive territory is acceleration. Against last month's +33.77 the change is −5.83 points, which in positive territory is slowing. Read together: this stock gave back a meaningful slice of its relative lead during the August–September retracement and has begun to regain it in the last week.
The habitual mistake in this panel is treating relative strength as a directional forecast. It is a comparison, not a direction — a stock can outperform by 27.9% while falling, if the index falls harder. Paired with the ADX reading in section ⑥, the honest summary is a stock that is a relative leader without currently being in a directional regime of its own.
⑥ ATR & ADX

BVS_atr_adx-90d-2026-09-20.svgATR(14) is $0.110, which is 3.52% of the $3.13 close — a wide daily range in percentage terms. That number sets the scale for every level on this page: 1×ATR at $3.02 is already below the $3.09 gap edge, and the 2×ATR technical invalidation level sits at $2.91, 7.1% beneath the close. Anything narrower than about 3.5% is inside a single day's ordinary noise for this stock.
ADX(14) is 19.4 on the 90-day frame and 19.1 on the two-year frame. Both are below 20, which is the ranging band: no directional regime is in force in either direction. ADX measures the strength of a move, not its direction, so a sub-20 reading is not bearish — it says the market has not committed.
The apparent contradiction between a +27.9% Mansfield RS and a sub-20 ADX is not a contradiction at all, and it is worth stating plainly because it trips people up. One is relative and one is absolute. Bravura Solutions can lead the index by a wide margin while trading inside its own range, and that is precisely the picture here.
⑦ OBV

BVS_obv-90d-2026-09-20.svgOn-balance volume is below its 20-day average on both frames — by 2.88% on the two-year chart and by 8.8% on the 90-day chart — with a flat slope and an early-distribution tag on each. Note that the −2.88% and −8.8% figures are gaps between OBV and its own MA20, a measure of pressure, and have nothing to do with divergence despite the similar name.
The divergence field itself reads bullish on both frames, and the peaks are specific. On the 90-day panel, OBV stood at 13,409,165 when price peaked at $3.16 on August 19; by September 8 price had made a lower low at $3.01 while OBV had risen to 17,131,628. Lower price, higher OBV — the classic bullish divergence shape, suggesting the September dip was not matched by the volume pressure that would normally accompany it.
That leaves the two oscillator panels flagging opposite divergences at the same time, and the honest thing is to leave the contradiction standing rather than pick a side. RSI flags bearish from the September 16 price peak; OBV flags bullish from the September 8 price low. Both are unconfirmed. The OBV divergence is also qualified by the state tag sitting beneath it — a bullish divergence from a series that is still under its own MA20 is a thinner signal than one from a series already turning up through it.
Bull Case vs Bear Case
Bull Case
- Mansfield RS +27.9% versus the S&P/ASX 200 with a rising slope and a +2.61-point weekly gain — a relative leader by a wide margin
- The pullback has been shallow: price sits on the 38.2% retracement ($3.128) of the $2.38–$3.59 July–August swing, the least of the standard grid
- Close is above all three moving averages, 0.7% over SMA20 and 12.9% over the $2.771 SMA60
- Price is above both anchored VWAPs — $2.48 from the Aug 13, 2025 anchor and $2.96 from the Jul 10, 2026 anchor
- A bullish OBV divergence is flagged on both frames: $3.16 at OBV 13,409,165 on Aug 19 against $3.01 at OBV 17,131,628 on Sep 8
- Both MACD lines remain above zero and Bollinger width has compressed to 6.87%, with unfilled support gaps at $2.85–$3.09 and $2.08–$2.25 beneath
Bear Case
- A bearish RSI divergence is flagged: $3.16 at RSI 59.18 on Aug 31 against a higher $3.18 at RSI 58.26 on Sep 16
- MACD has been below its signal line since the Aug 25 dead cross, with the histogram still negative at −0.0150 after three and a half weeks
- ADX 19.4 on the 90-day frame and 19.1 on the two-year frame — below 20 on both, so no directional regime is in force
- OBV is under its MA20 on both frames (−2.88% and −8.8%) with a flat slope and an early-distribution state tag
- Mansfield RS is 5.83 points lower than a month ago: the relative lead is still large but it was larger in August
- The close is 13.8% under the $3.63 52-week high and 12.8% under the $3.59 August 14 swing high, and this week's 1.94× volume is an index-rebalance artefact that says nothing about this stock either way
Scenarios
| Scenario | Probability | Path | Trigger / Invalidation |
|---|---|---|---|
| Pullback resolves upward | 30% | The shallow 38.2% retracement proves to be the whole of the correction: price clears the $3.216 upper band, then works on the $3.30 23.6% retracement, with the $3.59 August high as the next structural ceiling. The freshly completed moving-average ordering gains the track record it currently lacks. | Trigger: a daily close above $3.216 with the $3.109 SMA20 line unbroken, ideally on a session whose volume can be read on its own terms rather than against the rebalance day. Invalidation: a slip back beneath $3.109 within the same week. |
| Range persists and the base extends | 45% | The ADX of 19.4 is taken at face value and nothing commits: price oscillates between the $3.00–$3.109 band and the $3.216 upper band, the two opposing divergences both go unconfirmed, and Bollinger width stays compressed near 6.87% while the moving averages converge on the price. | Trigger: continued daily closes between $3.00 and $3.216 with RSI in the 45–60 band and ADX below 20. Invalidation: a daily close outside either edge of that band. |
| Pullback deepens through the grid | 25% | The bearish RSI divergence receives the price confirmation it currently lacks: a close beneath the $3.109 SMA20 line, then the $3.09 gap edge, opening the $2.85–$3.09 gap zone where the $2.985 50% retracement, the $3.002 lower band and the $2.91 volatility line all sit. The one-session moving-average ordering unwinds as quickly as it formed. | Trigger: a daily close beneath $3.00. Invalidation: recovery and a daily close back above $3.128. |
Key Levels & Volatility References
| Level | Role | Distance | Basis |
|---|---|---|---|
| $3.30 | Resistance | +5.6% | 23.6% retracement of the $2.38–$3.59 swing — the first shelf above the band |
| $3.22 | Resistance | +2.7% | Upper Bollinger Band (20) at 6.87% band width; the close sits mid-channel, not on it |
| $3.13 | Current | — | Sep 18, 2026 close. The 38.2% retracement ($3.1278) and SMA5 ($3.13) both sit on the same line |
| $3.11 | Support | −0.7% | SMA20 and Bollinger mid line — the shelf the pullback structure rests on |
| $3.09 | Support | −1.3% | Top edge of the unfilled Aug 12, 2026 gap ($2.85–$3.09) |
| $3.00 | Support | −4.1% | Lower Bollinger Band; the $2.985 50% retracement sits immediately beneath it |
| $2.91 | Invalidation | −7.1% | 2×ATR technical invalidation level, inside the $2.85–$3.09 gap zone |
What to Watch
- The $3.109 SMA20 line. It is 0.7% below the close and doubles as the Bollinger mid line. The whole pullback reading rests on it, and a daily close beneath it is also the first price confirmation the flagged RSI divergence has so far lacked.
- Next week's volume, read on its own. The September 18 ratio of 1.94× belongs to the rebalance day, not to this stock. The week beginning September 21 gives the first turnover figure here that means anything, and it is the missing evidence on both sides of this chart.
- Whether the one-session moving-average ordering survives. SMA5 > SMA20 > SMA60 completed on September 18. Several more sessions with the ordering intact would turn it into structure; a quick unwind would confirm it was noise.
- Which divergence gets price confirmation first. RSI flags bearish from the September 16 peak, OBV flags bullish from the September 8 low, and they cannot both be right. A close beneath $3.109 argues for the first; reclaiming $3.216 argues for the second.
- ADX 19.4 and the MACD histogram. ADX rising back through 20 and then 25 would say a directional regime is forming; the −0.0150 histogram narrowing toward zero with both lines above zero would say the August correction is finishing. Both staying where they are keeps the ranging scenario the most likely one.