Metals X
$2.15 −1.38% from the 52-week high of $2.18 · +218.52% from the 52-week low of $0.68
This analysis is based on closing-price data as of September 18, 2026. Whether you're researching Metals X (MLX) on the ASX or learning how to read stock charts, here are objective support, resistance and technical invalidation levels built from the RSI, MACD and ATR indicators.
The two-year chart is one long ascent — a base near $0.45 through late 2024, a step up in March 2025, and a grinding advance through 2025 and 2026 that leaves the close at $2.15, some 218.52% above the 52-week low of $0.68 and 1.38% under a 52-week high of $2.18 that was set intraday during the final session. What the screen flagged, though, is not that two-year arc but something that happened in the last week of it: the 20-day-high breakout, the proximity to the 52-week high, the close above SMA20 and SMA60, and the SMA5 > SMA20 > SMA60 alignment all completed on the same session, Tuesday September 15. As of this page's basis date that structure is four sessions old, which makes it a very young configuration rather than an established trend. Two sessions did nearly all of the work — September 15 (+6.79% on 1.8× average volume) and September 18 (+6.97% on 6.36×) — and the honest statement about them is that no catalyst was identified in public information, and that tin and small-cap resource peers did not follow, so this is a stock-specific move whose source cannot be read off any panel on this page.
Snapshot as of September 18, 2026 close
| Metric | Value | Reading |
|---|---|---|
| Close | $2.15 | 1.38% below the 52-week high; highest close on the two-year chart |
| 52-week high / low | $2.18 / $0.68 | The $2.18 high is an intraday extreme set on the September 18 session itself |
| SMA5 / SMA20 / SMA60 | $1.99 / $1.91 / $1.68 | Rising order, but only since September 15; close +7.99% / +12.70% / +27.75% |
| Bollinger upper / mid / lower | $2.07 / $1.91 / $1.75 | Close 4.11% above the upper rail — outside the 20-day distribution; width 16.49% |
| aVWAP (2y, anchor Mar 14, 2025) | $1.06 | Close 102.93% above |
| aVWAP (90d, anchor Aug 31, 2026) | $1.97 | Close 9.22% above |
| RSI(14) | 73.48 (90d) / 73.45 (2y) | Overbought; bearish divergence reported — Aug 11 $1.90 at RSI 76.25 versus Sep 18 $2.15 at RSI 73.48 |
| Mansfield RS vs the S&P/ASX 200 | +65.38% | Outperform, rising (prev week 43.53, prev month 50.77) |
| MACD / signal / histogram | 0.0672 / 0.0526 / +0.0145 | Golden cross dated September 17, 2026 — two sessions after the price breakout |
| ADX(14) | 21.70 (90d) / 21.38 (2y) | Emerging band (20–25), not yet the strong-trend regime |
| ATR(14) | $0.0900 (4.19%) | About nine cents of average daily range |
| OBV state | 90d early accumulation, flat · 2y early accumulation, flat | Above its MA20 on both frames (90d +125.76%, 2y +17.84%); no OBV divergence field is reported |
| Volume vs 20-day average | 19,927,953 vs 3,135,188 (6.36×) | Index-rebalance session — roughly 3.1× once market-wide flow is netted out (see below) |
| Fibonacci swing | $1.83 (Sep 8) → $2.15 (Sep 18) | Up-swing of 17.81%; the close is the 0% anchor, so every level sits beneath it |
| Gaps | None unfilled | The 90-day frame records none at all; the two-year frame records five, all filled |
| 1× / 2× ATR technical invalidation | $2.06 / $1.97 | 2× sits 8.37% below the last close |
① Price & Moving Averages
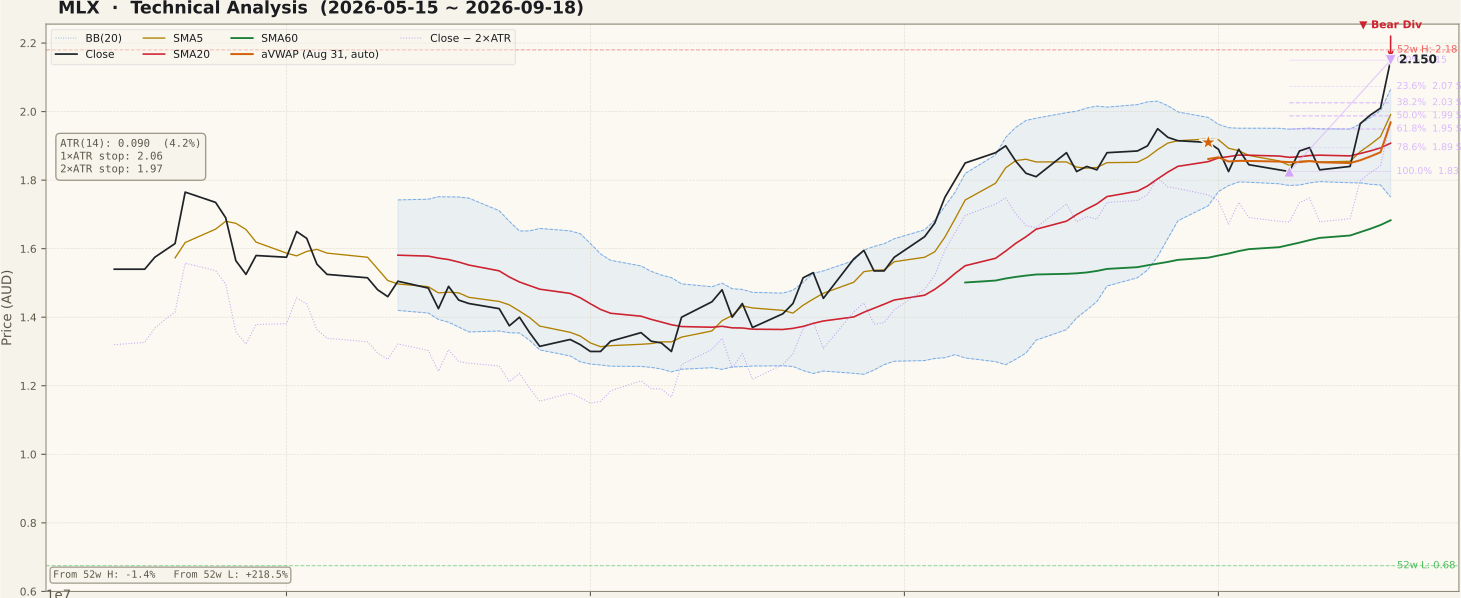
MLX_price-90d-2026-09-20.svgThe arrangement is textbook on its face: SMA5 $1.9910, SMA20 $1.9078 and SMA60 $1.6829 in rising order, with the close 7.99%, 12.70% and 27.75% above them respectively. The qualification is chronology. That rising order, the 20-day-high breakout, the proximity to the 52-week high and the close above the two slower averages all became true on the same session — September 15 — so what looks like a trend on the panel is four sessions of evidence sitting on top of a month of sideways trade between roughly $1.82 and $1.92.
The shape of the right edge says the same thing. From mid-August to mid-September the 90-day panel is a flat band; then two near-vertical bars lift the close from $1.84 to $2.15 with two quiet sessions in between. The close now sits 4.11% above the upper Bollinger rail at $2.0650, which is what band-walking looks like at its first day and also what a stretched move looks like — the distinction is only settled by what the next several sessions do, not by this one. Bollinger width at 16.49% of the middle band is wide rather than compressed, so the twenty-day distribution has already expanded around the move.
Overhead there is very little: the 52-week high of $2.18, 1.38% away, and that figure is an intraday extreme printed on the September 18 session itself rather than an old ceiling the stock has tested before. Beneath, the nearest references are the 23.6% retracement of the September swing at $2.0733 and the upper band at $2.0650, effectively one zone around $2.07. Anchored VWAP from March 14, 2025 is $1.0595 and the shorter anchor from August 31, 2026 is $1.9686; the close is 102.93% and 9.22% above them, so the average price paid since either anchor is well beneath the market and there is no trapped supply nearby. Neither timeframe carries an unfilled gap.
② Volume

MLX_volume-90d-2026-09-20.svgThis panel needs a correction applied before it can be read, and then it still says something. Friday September 18 was the S&P/ASX September quarterly index rebalance trade day — announced on September 4 and effective before the open on Monday September 21 — and index-fund flow lifted turnover across the whole market that session. The median volume ratio across the screening universe was 2.04× on that day, against 0.66×–1.01× on each of the eleven sessions before it. So roughly half of the headline 6.36× reading is the calendar, not the company, and the raw multiple must not be treated as though it were all stock-specific demand.
What survives the correction is still large. Netting out the market-wide factor leaves about 3.1× the 20-day average — genuine stock-level expansion, roughly triple normal turnover on a day the price rose 6.97%. Metals X is not itself an index-change stock in this rebalance, so the flow is not addition-related mechanical demand. The earlier of the two driving sessions, September 15, carried 1.8× average volume with a +6.79% close and needs no calendar adjustment at all, since it fell well before the rebalance day.
Two cautions belong here. First, the 20-day average against which all of this is measured — 3,135,188 shares on around A$4.4m of daily turnover — is a small-cap base, and a single 19.9m-share session will distort that average for the next month, which makes volume comparisons over the coming four weeks less informative than usual. Second, the 90-day panel shows one comparable spike earlier in the window, in early June, and the price did not sustain a move from it; a large bar is a fact about participation on one day, not a promise about the next twenty.
③ MACD

MLX_macd-90d-2026-09-20.svgMACD registered a golden cross dated September 17, 2026, with the line at 0.0672 above the signal at 0.0526 and the histogram positive at +0.0145. Both lines sit above zero, which is the more constructive version of the signal — a cross far beneath zero is an early-recovery reading, while this one occurs in territory the indicator has held repeatedly through this year's advance.
The sequencing is worth stating precisely: the cross is dated two sessions after the September 15 breakout, so MACD confirmed the move rather than anticipating it. That is normal for a lagging oscillator and is not a criticism of the signal, but it does mean the momentum reading and the price reading are not independent pieces of evidence here — both are functions of the same two large sessions. The histogram has only three bars of positive history behind it, the shortest possible basis for calling a momentum regime.
④ RSI

MLX_rsi-90d-2026-09-20.svgRSI(14) reads 73.48 on the 90-day frame and 73.45 on the two-year frame, above the conventional 70 overbought threshold on both. In a strong advance an overbought RSI is a description of strength rather than a warning in itself, and this indicator has spent stretches above 70 during previous legs of the 2026 move.
The more specific item is the divergence. Both JSON frames report a bearish RSI divergence built on two peaks: August 11, price $1.90 at RSI 76.25, against September 18, price $2.15 at RSI 73.48. Price made the higher high; RSI did not. That is the regular bearish pattern — the second push covered more ground in price on a lower momentum reading.
Two qualifications keep this in proportion. A divergence is a possibility of reversal, not a confirmation of one, and it means nothing until price itself turns; divergences of this kind persist through advances often enough that calling a top from one is the classic novice error. And the second peak here is the last bar on the chart, so the pattern has had no opportunity to be confirmed or invalidated by anything that follows it. It belongs on the bear side of the ledger as a caution, not as a verdict.
⑤ Mansfield Relative Strength

MLX_rs-90d-2026-09-20.svgMansfield RS against the S&P/ASX 200 reads +65.38%, tagged outperform and rising, and the measure is identical on both timeframes as an anchor-free indicator should be. The stock has been above the zero line for effectively the whole two-year window, dipping to it only briefly in late 2024, so outperformance here is a long-standing condition and not a new development.
The short-run path is more interesting than the level. The previous week's reading was 43.53 and the previous month's was 50.77 — so RS actually fell from 50.77 to 43.53 over the first three weeks of that month, then gained 21.85 points in the last week alone to reach 65.38. The monthly change of +14.61 understates what happened: relative strength went sideways-to-lower and then jumped, and the jump is the same two sessions that produced everything else on this page. Positive and accelerating, then, but accelerating from a single week's data.
⑥ ATR & ADX

MLX_atr_adx-90d-2026-09-20.svgATR(14) is $0.0900, or 4.19% of the last close, and the panel shows the line turning up sharply at the right edge after a long flat stretch — volatility expanded with the move rather than before it. Nine cents of average daily range is a substantial figure against the distances on this page: the whole zone from the $2.18 high down to the $2.03 retracement is under two average sessions wide, so a single ordinary day can traverse several of the levels listed below.
ADX(14) at 21.70 (90d) and 21.38 (2y) is the reading that most directly contradicts a confident trend narrative. Between 20 and 25 the indicator describes an emerging trend, not a strong one, and it sits there despite a 17.81% advance over the swing — because ADX is built from smoothed directional movement and four sessions are not enough to lift it. The objective marker used throughout this page follows from the ATR figure: the 2× ATR technical invalidation level is $1.97, 8.37% beneath the close, which is unusually wide in percentage terms and a direct consequence of the volatility this week created.
⑦ OBV

MLX_obv-90d-2026-09-20.svgBoth timeframes are tagged early accumulation with OBV above its own 20-period average and the slope flat: on the 90-day frame the value is 49,356,199 against an MA20 of 21,862,384, a separation of 125.76%, and on the two-year frame 181,581,803 against 154,087,988, a separation of 17.84%. The 90-day figure is arithmetically extreme, and the reason is visible on the panel — OBV rises almost vertically at the right edge because a single 19.9m-share up-session adds its entire volume to the cumulative line while the 20-period average has barely begun to absorb it.
That separation percentage measures distance from OBV's own average, which is a crude gauge of accumulation intensity, and it is not a divergence reading. The divergence field itself is null on both frames — the JSON reports no OBV divergence for this stock, so none is claimed here, and nothing is inferred from the shape of the line by eye.
The constructive reading is that volume-weighted participation confirms direction rather than lagging it, which is what the absence of a bearish OBV setup means. The caution is that a cumulative indicator dominated by one session inherits that session's ambiguity: part of that 19.9m was market-wide rebalance flow, so a meaningful share of the OBV jump is calendar rather than conviction.
Bull Case vs Bear Case
Bull Case
- The close of $2.15 is the highest on the two-year chart, 1.38% under the 52-week high of $2.18 and 218.52% above the 52-week low of $0.68 — there is almost no overhead structure on the panel.
- SMA5 $1.9910 > SMA20 $1.9078 > SMA60 $1.6829 in rising order, with the close 7.99% / 12.70% / 27.75% above them.
- Mansfield RS +65.38% against the S&P/ASX 200, tagged rising, after a 21.85-point gain in a single week.
- MACD golden cross dated September 17 with the histogram at +0.0145 and both lines above zero.
- OBV above its MA20 on both frames (90d +125.76%, 2y +17.84%), early accumulation, with no bearish OBV divergence reported.
- Volume expansion survives the rebalance correction: about 3.1× the 20-day average on a market-adjusted basis, and the September 15 session's 1.8× needed no adjustment at all.
Bear Case
- The signal is four sessions old. All four breakout conditions completed on September 15, so this is a very young structure, not an established trend, and one month of sideways trade sits immediately behind it.
- No catalyst was identified in public information for two sessions of +6.79% and +6.97%, and peers did not follow (Stellar Resources +2.63% on 1.3×, Elementos −2.78%, the broader small-cap resource set flat to mixed) — so the driver is stock-specific and is not visible on any panel here.
- RSI 73.48 with a reported bearish divergence: August 11 at $1.90 / RSI 76.25 versus September 18 at $2.15 / RSI 73.48.
- The close sits 4.11% above the upper Bollinger rail at $2.0650 — outside the 20-day distribution, a position that historically resolves by consolidation as often as by continuation.
- ADX at 21.70 is in the emerging band, not the strong-trend band; the trend-strength indicator has not corroborated the price move.
- Roughly half the headline 6.36× volume is the market-wide rebalance session, and the $2.18 high was an intraday extreme on that same distorted day rather than a level the stock has closed above.
Scenarios
| Scenario | Probability | Path | Trigger / Invalidation |
|---|---|---|---|
| Consolidation of the thrust | 40% | The move pauses rather than extends: the close works back inside the Bollinger band and settles in the $2.07–$1.99 zone where the 23.6%, 38.2% and 50% retracements ($2.0733 / $2.0259 / $1.9875) and SMA5 ($1.9910) cluster, while SMA20 rises toward the price and the RSI divergence unwinds through time. | Trigger: sessions that neither close above $2.18 nor beneath $1.99. Resolved upward by a close above $2.18, downward by a close beneath $1.95. |
| Continuation above the 52-week high | 35% | The breakout extends: a close above $2.18 on volume that is still above average in a normal, non-rebalance week, with ADX lifting out of the 20–25 emerging band and the MACD histogram widening. The measured move from the $1.825 swing low projects the same 17.81% again onto the $2.15 anchor. | Trigger: a daily close above $2.18, ideally with the 20-day-average comparison made once the September 18 session has rolled out. Invalidated by a close back beneath $2.07. |
| Failure back into the August range | 25% | The two-session advance is retraced: the $2.07 zone gives way, SMA5 at $1.99 does not contain the pullback, and the price works back toward the 78.6% retracement at $1.8946 and the $1.825 swing low — the top of the month-long band the stock left on September 15. | Trigger: a close beneath $1.99 that is not recovered within a few sessions. The rising short-term structure fails on a close beneath the 2× ATR technical invalidation level at $1.97. |
Key Levels & Volatility References
| Level | Role | Basis |
|---|---|---|
| $2.18 | Resistance | 52-week high, 1.38% above the close — an intraday extreme printed on the September 18 rebalance session, not a level held into any close |
| $2.15 | Current | Last close, September 18, 2026; also the 0% anchor of the current up-swing |
| $2.07 | Support | 23.6% retracement of the September 8 – September 18 up-swing ($2.0733) with the upper Bollinger rail ($2.0650) in the same zone, 3.57% below the close |
| $2.06 | Support | 1× ATR volatility reference ($2.0600), 4.19% below the close |
| $2.03 | Support | 38.2% retracement ($2.0259), 5.77% below the close |
| $1.99 | Support | SMA5 ($1.9910) and the 50% retracement ($1.9875) stacked together, 7.40% below the close — the first structural shelf |
| $1.97 | Invalidation | 2× ATR technical invalidation level ($1.9699), 8.37% below the close; the 90-day anchored VWAP ($1.9686) and the 61.8% retracement ($1.9492) sit in the same zone |
What to Watch
- Volume in the first normal week after the rebalance. Turnover from Monday September 21 onward is the first clean read available; the comparison worth making is against the 20-day average once the 19.9m-share session has rolled out of it, because until then the denominator is distorted too.
- Whether anything emerges that explains September 15 and September 18. No company announcement accounting for the move was found in public information, and the peer check argues against a sector explanation — so the single most useful new fact would be an identified cause, whatever direction it points.
- Whether ADX lifts out of the 20–25 emerging band. At 21.70 the trend-strength indicator has not yet corroborated the price move; two or three more directional sessions would push it, while a flat week would leave the breakout unconfirmed on this measure.
- Whether the close returns inside the Bollinger band and how it behaves at $2.07. Sitting 4.11% above the upper rail is not a sustainable resting position; the question is whether the band catches up to the price or the price falls back to the band.
- Whether the RSI divergence gets confirmed or erased. A close above $2.18 would leave the August 11 / September 18 peak pair behind; a failure at $2.07 followed by a lower high would give the pattern its confirmation.