New Hope Corporation
$6.38 −3.48% from the 52-week high of $6.61 · +69.23% from the 52-week low of $3.77
This analysis is based on closing-price data as of September 18, 2026. Whether you're researching New Hope Corporation (NHC) on the ASX or learning how to read stock charts, here are objective support, resistance and technical invalidation levels built from the RSI, MACD and ATR indicators.
The two-year chart falls into three acts: a slide from around $5.00 in late 2024 into a base through the first half of 2025, a long consolidation, and a 2026 advance that has carried the close to $6.38 — 69.23% above the 52-week low of $3.77 and 3.48% under the 52-week high of $6.61, which was set intraday during the week just finished. What the screen flagged here is the moving-average structure rather than a fresh breakout, and that is the accurate description: SMA5 > SMA20 > SMA60 has been in rising order since August 27 — seventeen sessions, so the alignment long predates this week — with the close 2.99% above SMA20 and 13.46% above SMA60, Mansfield RS at +30.19% against the S&P/ASX 200 and ADX at 46.46. The qualifications are small, recent and worth stating plainly: the close finished 0.50% under SMA5, MACD registered a dead cross on the final session, and OBV has slipped beneath its own 20-period average on both timeframes. One thing this week's chart cannot tell you is what the last session's volume meant — Friday September 18 was the S&P/ASX September quarterly rebalance trade day, and turnover was elevated right across the market.
Snapshot as of September 18, 2026 close
| Metric | Value | Reading |
|---|---|---|
| Close | $6.38 | 3.48% below the 52-week high |
| 52-week high / low | $6.61 / $3.77 | Near the top of the two-year range |
| SMA5 / SMA20 / SMA60 | $6.41 / $6.20 / $5.62 | Rising order intact since August 27; close 0.50% beneath SMA5 |
| Bollinger upper / mid / lower | $6.65 / $6.20 / $5.74 | Close inside the band, 4.09% under the upper rail; width 14.75% |
| aVWAP (2y, anchor Sep 17, 2025) | $5.05 | Close 26.35% above |
| aVWAP (90d, anchor Jul 7, 2026) | $5.71 | Close 11.76% above |
| RSI(14) | 66.20 (90d) / 66.16 (2y) | Back under the 70 overbought threshold; no divergence reported |
| Mansfield RS vs the S&P/ASX 200 | +30.19% | Outperform, rising (prev week 30.21, prev month 16.60) |
| MACD / signal / histogram | 0.2210 / 0.2242 / −0.0032 | Dead cross dated September 18, 2026; histogram marginally negative |
| ADX(14) | 46.46 (90d) / 45.87 (2y) | Strong-trend regime on both frames |
| ATR(14) | $0.1911 (3.00%) | About 19 cents of average daily range |
| OBV state | 90d improving, rising · 2y early distribution, flat | Beneath its MA20 on both timeframes |
| Volume vs 20-day average | 6,202,318 vs 2,884,113 (2.15×) | Index-rebalance session — market-wide, not stock-specific (see below) |
| Fibonacci swing | $5.12 (Aug 5) → $6.45 (Sep 9) | Up-swing; levels below the price act as retracement support |
| 1× / 2× ATR technical invalidation | $6.19 / $6.00 | 2× sits 5.99% below the last close |
① Price & Moving Averages
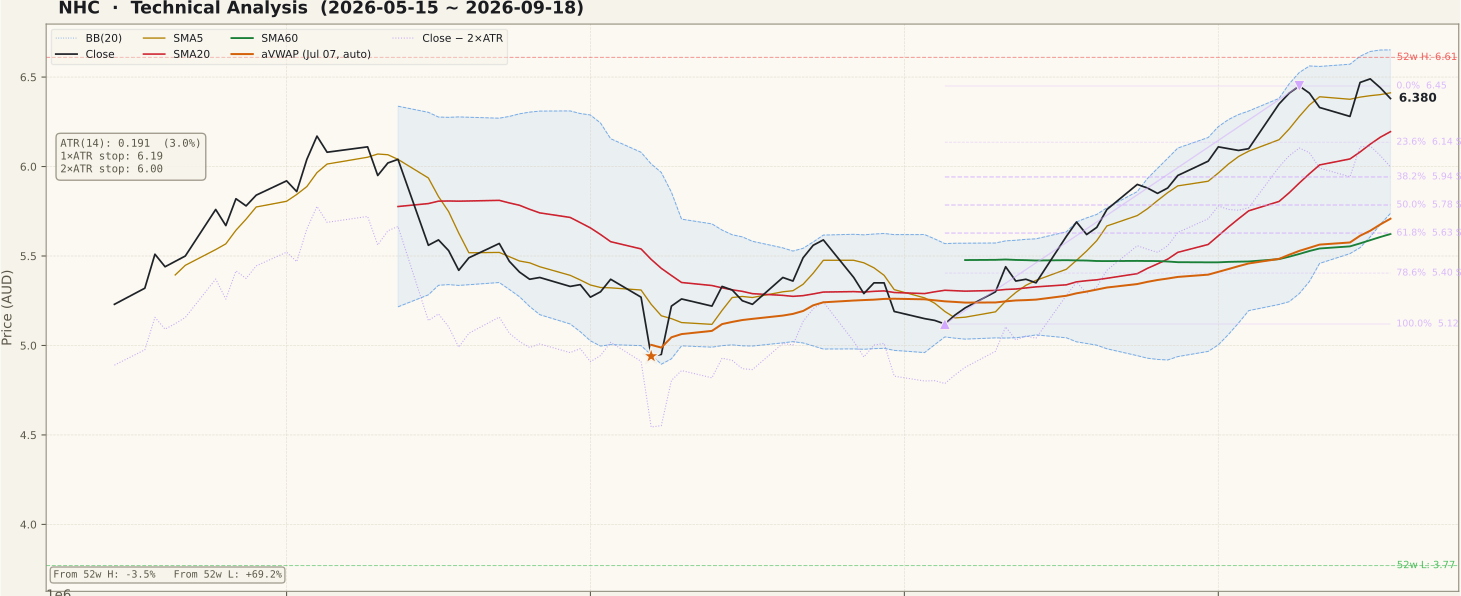
NHC_price-90d-2026-09-20.svgThe averages are in rising order and the price sits clear of the slower two: close $6.38 against SMA20 $6.1950 (+2.99%) and SMA60 $5.6230 (+13.46%). The structural point is the age of that arrangement rather than its existence — SMA5 above SMA20 above SMA60 has held since August 27, seventeen sessions, so this is an established trend being read at a pause, not a configuration that appeared in the last few days.
The shortest average is where the friction is. SMA5 is $6.4120 and the close is $6.38, leaving the price 0.50% below its five-day line — close enough that the chart reads as a touch rather than a break, but it does mean the nearest overhead reference on this page is a moving average rather than a structural high. Above it sit the up-swing anchor high of $6.45 from September 9 and the 52-week high of $6.61. That $6.61 is an intraday extreme reached during the past week and not held into any close, which is why it sits well above the anchor the Fibonacci swing still uses.
Bollinger width is 14.75% of the middle band — narrower than the 18.32% reading of a week earlier, so the twenty-day distribution has been contracting while price has gone sideways at a high level. The close is 4.09% inside the upper rail at $6.6520, and the middle band at $6.1950 sits exactly on SMA20, making that a double reference rather than two. Anchored VWAP from September 17, 2025 is $5.0494 and the shorter anchor from July 7, 2026 is $5.7085; the close is 26.35% and 11.76% above them, so the average price paid since either anchor is far beneath the market and there is very little trapped overhead supply nearby. The 90-day frame carries no unfilled gaps at all; the two-year frame has one, at $3.52–$3.60 from April 10, 2025, far enough below to be context rather than a working level.
② Volume

NHC_volume-90d-2026-09-20.svgThe final session traded 6,202,318 shares against a 20-day average of 2,884,113 — a ratio of 2.15×. On an ordinary week that number would be the headline of this section. This was not an ordinary week: Friday September 18 was the S&P/ASX September quarterly rebalance trade day, announced on September 4 and effective before the open on Monday September 21, and index-fund flow lifted turnover right across the market that session. The median volume ratio across the 227-stock screening universe was 2.04× on the day, against 0.66× to 1.01× on each of the eleven sessions before it.
Measured against that backdrop, NHC's 2.15× is almost exactly the market median — roughly 1.05× once the market-wide effect is taken out, which is to say entirely ordinary. New Hope is not itself an index-change stock. So this page draws no stock-specific conclusion from Friday's volume in either direction: it is neither evidence of a move getting underway nor evidence of one being unwound, and the raw ratio should not be read as though it were.
This is worth spelling out because it is one of the easier traps on a chart. A volume bar twice the average is normally the most informative mark on the panel, and a reader scanning the 90-day frame will see Friday's bar tower over the average line. Calendar events — index rebalances, quarterly futures expiry, large off-market crossings — produce the same picture for reasons that have nothing to do with the individual company. The panel does show the week's bars generally running above the 20-day average line, but with the closing session compromised by market-wide flow, volume simply does not settle anything about this stock this week.
③ MACD

NHC_macd-90d-2026-09-20.svgMACD reads 0.2210 against a signal line of 0.2242, giving a histogram of −0.0032, and the last crossover is recorded as a dead cross dated September 18, 2026 — the final session on the chart. That ends a run that began with the August 11 golden cross, and it is the single clearest change in this week's readings.
The size of it deserves as much attention as the fact of it. A histogram of −0.0032 on a $6.38 stock is the two lines effectively touching; this is a crossover by a hair, registered on the day it happened, with no downward separation behind it yet. Both lines also remain well above zero, so what the panel describes is momentum flattening at a high level rather than momentum turning down. The distinction matters because a same-day crossover is the least confirmed form a MACD signal takes — a single session in either direction can undo it, and the two-year panel shows several instances during 2026 where the lines brushed and re-crossed within a week.
④ RSI

NHC_rsi-90d-2026-09-20.svgRSI(14) reads 66.20 on the 90-day frame and 66.16 on the two-year frame, back beneath the conventional overbought line at 70 after spending the previous week above it. The JSON reports no RSI divergence and supplies no divergence peaks on either timeframe, so this page makes no divergence claim in either direction.
How the oscillator came back below 70 is more informative than the level itself. The price is 3.48% off its 52-week high and above every average except the five-day, so the reading cooled largely through sideways time rather than through a decline — the healthier of the two ways an overbought condition resolves. A reading in the mid-60s is a trend still running warm with a little room restored: it is neither the stretched condition of a week ago nor anything resembling weakness. The 2026 stretch of the two-year panel shows the pattern clearly — pushes above 70 in February, March and June each cooled into the 60s, and the ones that mattered were the ones where price held its structure while the oscillator eased.
⑤ Mansfield Relative Strength

NHC_rs-90d-2026-09-20.svgMansfield RS versus the S&P/ASX 200 reads +30.19% and is tagged as rising. Because the prior figures are absolute values rather than changes, the arithmetic has to be done explicitly. A week ago RS stood at 30.21, so the weekly change is −0.01 — flat to the second decimal. A month ago it stood at 16.60, so the monthly change is +13.59.
That places the stock in two different quadrants depending on the horizon, and the honest reading keeps them separate. On the monthly view RS is positive and accelerating hard, the strongest of the four configurations. On the weekly view RS is positive but no longer advancing — technically the positive-and-slowing quadrant, though a change of −0.01 is better described as a pause than as deterioration. The combination is consistent with everything else on this page: a month of decisive outperformance, then a week of marking time. The two-year panel adds the longer frame — RS was negative through late 2024 and all of 2025, crossed zero in January 2026 and has been positive since, peaking near +48 in April. At +30.19% the stock is a clear leader against the index but has not regained that April benchmark.
⑥ ATR & ADX

NHC_atr_adx-90d-2026-09-20.svgATR(14) is $0.1911, or 3.00% of the last close, and the 90-day frame agrees at $0.1911 and 2.995%. That is up from 2.68% a week earlier — the average session has widened to about 19 cents even as the Bollinger width contracted, which is what a market does when it swings within a range rather than trending through it. The figure sets the scale for every level on this page: the distance from the close down to the $6.20 support zone is roughly one average session, and the whole band from the 52-week high at $6.61 to the $6.14 retracement shelf is about two and a half. Levels this tightly packed are zones, not lines. The 1× ATR technical invalidation level sits at $6.19 and the 2× level at $6.00, the latter 5.99% below the close.
ADX(14) reads 46.46 on the 90-day frame and 45.87 on the two-year frame, both far above the 25 that separates a trending market from a ranging one. ADX measures the strength of a directional move and not its direction, so on its own it says only that the market is committed; read alongside the rising order of the averages it describes a trend rather than chop. The caution is the same one the reading invited a week ago: ADX above roughly 40 sits closer to the maturity of a move than to its beginning, and the panel shows the line has now been elevated for several weeks.
⑦ OBV

NHC_obv-90d-2026-09-20.svgThe two timeframes tell the same story with different labels, and both have changed since last week. On the 90-day frame OBV is 43,295,180 against an MA20 of 45,672,350, tagged as improving, beneath its average but with a rising slope. On the two-year frame OBV is 71,078,141 against an MA20 of 73,455,311, tagged as early distribution, beneath its average with a flat slope. A week earlier OBV was above its MA20 on both frames; it is now below on both.
The gap between OBV and its own MA20 is −5.20% on the 90-day frame and −3.24% on the two-year frame. It is worth being explicit about what that number is, because the field name misleads: it measures the distance between OBV and its own moving average — how stretched the cumulative flow is relative to its recent mean — and it is not a divergence. The actual divergence fields are null on both timeframes for both RSI and OBV, so no divergence is claimed here in either direction.
Reading the tag on its own would overstate the case. "Early distribution" on the two-year frame is a mechanical label for OBV sitting under a flat average, and part of the recent softness in the line comes from the same session the volume panel cannot interpret. What can be said without stretching: net cumulative flow has stopped making new ground over the last few weeks, the 90-day slope is still rising beneath its average, and this is the one indicator group on the page that has weakened rather than merely paused.
Bull Case vs Bear Case
Bull Case
- Close $6.38 sits 3.48% under the 52-week high of $6.61 and 69.23% above the 52-week low of $3.77 — the upper end of the two-year range.
- SMA5 > SMA20 > SMA60 in rising order since August 27, seventeen sessions — an established structure, not a fresh one; close 2.99% above SMA20 $6.20 and 13.46% above SMA60 $5.62.
- Mansfield RS +30.19% versus the S&P/ASX 200, up from 16.60 a month ago (+13.59) and tagged rising.
- ADX(14) at 46.46 (90d) / 45.87 (2y), deep in the strong-trend band on both frames.
- RSI has cooled from above 70 to 66.20 while the price stayed within 3.5% of its high — an overbought reading unwound through time rather than through a decline.
- Close 26.35% above the 2-year anchored VWAP ($5.05) and 11.76% above the 90-day anchor ($5.71), with no unfilled gaps on the 90-day frame and little trapped supply overhead.
Bear Case
- MACD recorded a dead cross dated September 18, 2026 — the last session on the chart — ending the sequence that began with the August 11 golden cross.
- OBV is beneath its MA20 on both timeframes (90d 43,295,180 vs 45,672,350, −5.20%; 2y 71,078,141 vs 73,455,311, −3.24%), with the two-year frame tagged early distribution; both were above their averages a week ago.
- The close finished 0.50% under SMA5 $6.41, so the fastest average is overhead rather than beneath the price.
- The $6.61 high was an intraday extreme that was not held into a close; the up-swing anchor high remains $6.45 from September 9, so the last two weeks have produced a higher wick rather than a higher close.
- Volume offers no independent read this week — the closing session was inflated market-wide by the index rebalance, so the one panel designed to corroborate price movement is unusable for this stock.
- With ATR at 19 cents (3.00%), the entire band from $6.61 down to the $6.14 shelf is only about two and a half average sessions wide, so one wide day can cross several levels on this page.
Scenarios
| Scenario | Probability | Path | Trigger / Invalidation |
|---|---|---|---|
| Range digestion above the SMA20 shelf | 45% | The pause continues: the close works between the $6.20 SMA20 and Bollinger-middle zone and the $6.45 swing anchor while SMA20 rises toward the price, the MACD lines re-converge, and the flattened RS stabilises without giving back the month's gain. | Trigger: sessions that neither close above $6.45 nor beneath $6.20. Resolved upward by a close above $6.61, downward by a close beneath $6.14. |
| Trend resumes toward the 52-week high | 30% | The price recovers SMA5 at $6.41, clears the $6.45 anchor and works back to the $6.61 high and the upper Bollinger rail at $6.65, with the MACD dead cross reversing before it separates and OBV recovering its MA20. | Trigger: a daily close above $6.45 followed by a close above $6.61, ideally on turnover clearly above average in a normal, non-rebalance session. Invalidated by a close back beneath $6.20. |
| Reversion toward the mean | 25% | The MACD crossover widens and OBV keeps slipping: the price loses the $6.20 SMA20 zone, the 23.6% retracement at $6.14 gives way, and the move works toward the 38.2% retracement at $5.94 and the 50% level at $5.79. | Trigger: a close beneath $6.14 that is not recovered within a few sessions. The rising short-term structure fails on a close beneath the 2× ATR technical invalidation level at $6.00. |
Key Levels & Volatility References
| Level | Role | Basis |
|---|---|---|
| $6.61 | Resistance | 52-week high, an intraday extreme set in the week just finished, 3.48% above the close; the upper Bollinger rail at $6.65 sits immediately above it |
| $6.45 | Resistance | 0% anchor of the current up-swing, recorded September 9, 2026 |
| $6.41 | Resistance | SMA5 $6.4120 — the nearest overhead reference, 0.50% above the close |
| $6.38 | Current | Last close, September 18, 2026 |
| $6.20 | Support | SMA20 and the Bollinger middle band in the same place ($6.1950), with the 1× ATR technical invalidation level at $6.19 in the same one-cent zone |
| $6.14 | Support | 23.6% retracement of the August 5 – September 9 up-swing ($6.1361), 3.82% below the close |
| $6.00 | Invalidation | 2× ATR technical invalidation level ($5.998), 5.99% below the close; the 38.2% retracement at $5.94 lies just under it |
What to Watch
- Whether the MACD crossover separates or closes back up. A same-day dead cross with a −0.0032 histogram is the least confirmed version of the signal; two or three sessions of widening negative histogram would make it real, while a re-cross would make it noise.
- Whether OBV recovers its MA20 on the 90-day frame. Both frames slipped beneath their averages this week, and this is the only indicator group on the page that weakened rather than merely paused.
- Whether the close reclaims SMA5 at $6.41 and then the $6.45 swing anchor, or whether $6.45 becomes the first lower high of a pullback.
- Volume in the first normal week after the rebalance. Turnover from Monday September 21 onward is the first clean read available, and the comparison worth making is against the 20-day average once the distorted session rolls out of it.
- Whether the $6.20 zone — SMA20, the Bollinger middle band and the 1× ATR level stacked together — contains a first pullback. Coal and broader energy pricing sits entirely outside these panels and can move a producer independently of anything on the chart; no such event appeared in the five sessions this page reads, but that is a statement about this week, not about next week.