Bravura Solutions Limited
This analysis is based on closing-price data as of August 21, 2026. Whether you're researching Bravura Solutions Limited (BVS) on the ASX or learning how to read stock charts, here are objective support, resistance and technical invalidation levels built from the RSI, MACD and ATR indicators.
Bravura Solutions closed Friday at $3.30, 9.1% below the $3.63 52-week high set on August 14 and 88.0% above the $1.75 low. The two-year panel shows why the last fortnight matters: a flat base through most of 2026 ended with a gap higher on July 10, and the advance then went near-vertical on August 12 and 13 — two consecutive sessions the chart flags as volume spikes — before stopping at $3.59. The three sessions that followed retraced 12.0% of that thrust, and the two after them recovered part of it, leaving price back above SMA5 at $3.29 and almost exactly on the 23.6% retracement at $3.30. The working lens is a young breakout in its first orderly pullback, with the confirming evidence still intact — Mansfield RS +33.4% versus the S&P/ASX 200, ADX 43.3, OBV accumulating on both frames — and the honest complication that 4.44% daily volatility puts the objective line 8.9% away.
Snapshot as of August 21, 2026
| Item | Value | Reading |
|---|---|---|
| Close | $3.30 | −9.1% from 52w high, +88.0% above 52w low |
| 52-week range | $1.75 – $3.63 | Upper end of the yearly range after an August high |
| SMA 5 / 20 / 60 | $3.29 / $2.93 / $2.47 | Full bullish alignment; close 12.5% above SMA20 and 33.7% above SMA60 |
| Bollinger (20) | $3.67 / $2.93 / $2.20 | Band width 50.03% — extremely wide after the August expansion |
| aVWAP (2y anchor) | $2.45 (Aug 13, 2025) | Price is 34.7% above the two-year cost basis |
| aVWAP (90d anchor) | $2.89 (Jul 10, 2026) | Short-term cost basis 14.1% below price, inside the August 12 gap band |
| RSI(14) | 66.2 | Firm but no longer overbought (2y frame 66.2); no divergence flagged |
| Mansfield RS (vs the S&P/ASX 200) | +33.4% | Strongly outperforming; +31.57 points over a month, −12.41 points over the past week |
| MACD(12,26) | 0.248 / signal 0.229 | Golden cross of July 7 still intact; histogram +0.019, its narrowest of this leg |
| ADX(14) | 43.3 | Strong directional trend (2y frame 43.0) |
| ATR(14) | $0.146 (4.44%) | Wide daily range — the 2×ATR band spans 8.9% of price |
| OBV | 2y: above MA20, rising (+21.7%) · 90d: above MA20, rising (+111.3%) | Accumulation on both frames; the 90-day spread is extreme |
| Volume (last session) | 2,072,203 vs 1,864,119 avg (1.11×) | Slightly above average — well below the August 12–13 spike sessions |
| Unfilled gaps | $2.85 – $3.09 · $2.08 – $2.25 · $1.66 – $1.77 | Three open on the two-year frame, all beneath price (Aug 12 2026, Jul 10 2026, Dec 4 2024) |
| 1×ATR / 2×ATR levels | $3.15 / $3.01 | 2×ATR = technical invalidation level (−8.9% from close) |
① Price & Moving Averages
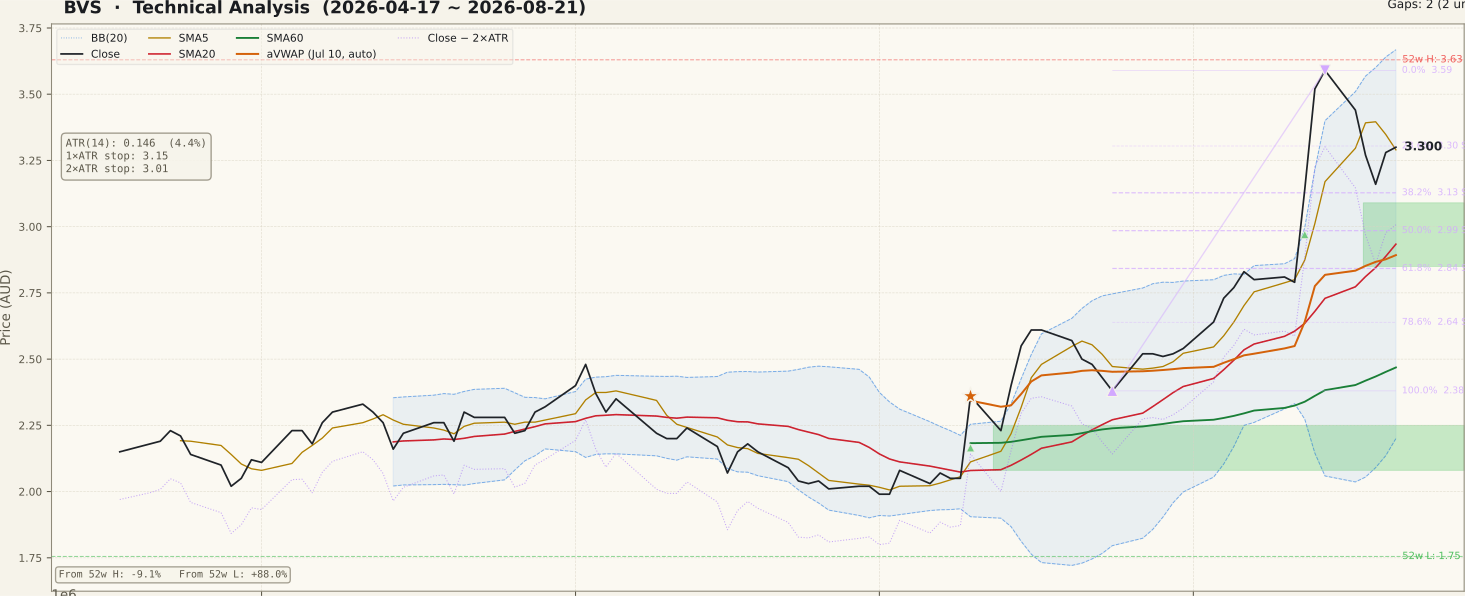
BVS_price-90d-2026-08-23.svgThe moving-average stack is in bullish order — close $3.30 above SMA5 $3.29, above SMA20 $2.93, above SMA60 $2.47 — and the close reclaimed the fast average on Friday after three sessions beneath it. The gaps between the averages are the story: price sits 12.5% above SMA20 and 33.7% above SMA60, spacing created in two sessions rather than accumulated over weeks.
The retracement grid is anchored to the July 24 low at $2.38 and the August 14 high at $3.59. Price has given back 24.0% of that swing, which places it fractionally under the 23.6% level at $3.30. Below sit the 38.2% level at $3.13 and then the top of the unfilled August 12 gap at $3.09 — two references within 1.2% of each other, which is what makes that zone the structural shelf of this chart. The 50% level at $2.99 falls inside the gap band itself.
Bollinger structure records the violence of the move: width is 50.03%, with the upper band at $3.67, the midline at $2.93 and the lower band at $2.20. Bands that wide are a description of what already happened rather than a forecast, but they do mean the midline — which coincides with SMA20 — is a long way down. On the two-year frame the only prior visit to this price zone was the October–November 2025 spike near $3.55, so the overhead structure above $3.63 is thin.
② Volume

BVS_volume-90d-2026-08-23.svgThe 90-day panel flags two consecutive spike sessions — bars at or above twice the 20-day average — on August 12 and August 13, the two days that carried the close from $2.79 to $3.52. Those two bars dwarf everything else in the window and are the reason the 20-day average has since stepped up to 1,864,119 shares.
What has happened since is the more useful read. The pullback of August 17–19 did not arrive on anything like that participation; turnover through the decline ran close to the 20-day average, and Friday's 2,072,203 shares is 1.11× average on an up close. Distribution after a thrust usually announces itself with heavy volume on the way down, and the panel does not show that. The caveat is the mirror image: a retest of $3.59 on materially lighter volume than the August 12–13 sessions would be a weaker confirmation than the original move.
③ MACD

BVS_macd-90d-2026-08-23.svgMACD reads 0.248 against a signal line of 0.229, with the histogram positive at +0.019. The golden cross that began this leg is dated July 7 and has survived the entire advance and the pullback — there has been no dead cross.
The qualification is that the histogram is now the narrowest it has been since the August expansion, and both lines are flattening at a high absolute level after peaking with price on August 14. That is the normal signature of a pullback inside a trend rather than of a reversal, but it is also the condition from which a dead cross would appear if the retracement extends. Because the cross occurred close to the zero line in early July, the structure it defines remains an early-stage one on the two-year frame.
④ RSI

BVS_rsi-90d-2026-08-23.svgRSI(14) at 66.2 on both frames is firm and out of the overbought band it occupied around the August high. That unwind happened quickly, and it happened partly through price — three consecutive lower closes — rather than purely through sideways time.
No divergence is flagged on either frame, and the peaks fields are empty, so there is no specific pair of highs to point at. That absence is worth stating plainly rather than reading as a positive: the momentum high was made together with the price high on August 14, which is the constructive configuration, but a single-swing chart simply has not had time to build a divergence either way. The two-year panel shows RSI reaching similar readings at the October 2025 peak and at the December 2024 step-up, with opposite outcomes — the level alone settles nothing.
⑤ Mansfield RS vs the S&P/ASX 200

BVS_rs-90d-2026-08-23.svgMansfield RS sits at +33.4% versus the S&P/ASX 200 — one of the highest readings on the two-year panel and far into outperformance territory. A month ago the reading was +1.84, so the monthly change of +31.57 points is a leadership change of unusual size, and the 90-day panel shows the zero-line crossing that produced it in mid-July.
The weekly reading moves the other way and moves hard: a week ago RS stood at +45.82, so the seven-day change is −12.41 points. In positive territory a negative change is deceleration rather than deterioration — the stock is still outperforming the index by a wide margin — but a give-back of that size in one week is itself a measure of how much of the reading was built in two sessions. The distinction that matters over the next fortnight is between RS easing while still above zero and RS retracing toward it.
⑥ ATR & ADX

BVS_atr_adx-90d-2026-08-23.svgATR(14) at $0.146 is 4.44% of price, and the 90-day panel shows it stepping up almost vertically in mid-August from roughly $0.11. Volatility of that order has a direct consequence for the level structure: the 2×ATR technical invalidation level sits at $3.01, 8.9% below the close, and the 1×ATR reference at $3.15 is already inside the range of a single ordinary session.
ADX at 43.3 on the 90-day frame (43.0 on the two-year frame) confirms a strong directional trend, and the panel shows it rising through August. ADX measures strength without direction, so a high reading during a pullback describes the vigour of the preceding advance rather than promising its continuation. Median daily turnover clears the screen's A$2M floor, so the volume-derived readings on this chart are reasonably reliable — though at this price and range, spreads and slippage remain a practical consideration for an ASX mid cap.
⑦ OBV

BVS_obv-90d-2026-08-23.svgBoth frames agree: OBV is tagged accumulation, above its 20-day average and rising, with the spread at +21.7% on the two-year frame and +111.3% on the 90-day frame. Readings that wide are a direct product of the August 12–13 spike sessions, which added an enormous block of volume to the running total in two days.
The important detail is what OBV did during the pullback: the 90-day panel shows it dipping only modestly from its August high and turning back up in the final two sessions, rather than falling with price. Price gave back 12.0% from the August 14 close while OBV held most of its gain — the opposite of the bearish non-confirmation pattern, in which price holds up while OBV lags. On the two-year frame OBV is at its highest of the whole window, above a rising average.
Bull vs Bear
Bull Case
- Mansfield RS +33.4% vs the S&P/ASX 200 — +31.57 points over a month, off a mid-July zero-line crossing.
- Full bullish alignment: close $3.30 > SMA5 $3.29 > SMA20 $2.93 > SMA60 $2.47, with SMA5 reclaimed on Friday.
- The July 7 MACD golden cross survived both the advance and the pullback; the histogram is still positive at +0.019.
- OBV in accumulation on both frames, above a rising 20-day average, and it barely gave ground while price fell 12.0%.
- The retracement is only 24.0% of the $2.38–$3.59 swing, and ADX 43.3 says the preceding advance was strongly directional.
- Above $3.63 the two-year chart holds almost no overhead structure — the October–November 2025 spike near $3.55 is the only prior visit to this zone.
Bear Case
- RS weekly change −12.41 points, from +45.82 to +33.4 — the level is high, the slope has turned hard.
- ATR 4.44% of price puts the 2×ATR technical invalidation level 8.9% below the close, so the objective risk band is unusually wide.
- Bollinger width 50.03% with the midline at $2.93 — a 12.5% gap between price and the mean.
- Three consecutive lower closes on August 17–19 gave back 12.0% of the thrust before the two-session recovery.
- An unfilled gap at $2.85–$3.09 sits 6.4% below and a second at $2.08–$2.25 remains open from July 10 — both are structural magnets.
- The structure was created in two sessions; between $3.09 and $2.85 the chart has no traded price history to lean on.
Scenarios
| Scenario | Probability | Path | Trigger / Invalidation |
|---|---|---|---|
| Shelf holds, breakout resumes | 45% | The pullback ends in the $3.13–$3.09 band where the 38.2% retracement and the top of the August 12 gap overlap, or above it at the 23.6% level. The rising SMA5 catches up, the MACD histogram re-expands, and price works back toward the $3.59 August high and then the $3.63 52-week high with RS still well above zero. | Daily closes above $3.13 keep this framing; a reclaim of $3.59 on above-average volume confirms it. A close inside the $2.85–$3.09 gap argues for the second path. |
| Retracement into the gap | 35% | The 38.2% level fails and price trades into the unfilled $2.85–$3.09 gap, where the 50% retracement at $2.99 and the 2×ATR technical invalidation level at $3.01 also sit. Filling a gap of that age is ordinary behaviour and would not by itself end the July–August structure, which stays intact while price holds above the 61.8% level at $2.84. | A daily close below $3.09 opens this path; sustained closes back above $3.13 close it. |
| Breakout structure unwinds | 20% | Price closes beneath the $3.01 technical invalidation level and continues through the 61.8% level at $2.84 toward the SMA20 and Bollinger midline at $2.93 and the 90-day anchored VWAP at $2.89. Mansfield RS retraces toward zero, MACD prints its first dead cross since July 7, and the July 10 gap at $2.08–$2.25 becomes the next open structure beneath. | A daily close below $3.01 triggers this reading; a close back above $3.13 negates it. |
Key Levels & Volatility References
| Price | Role | Basis |
|---|---|---|
| $3.67 | Resistance | Upper Bollinger band (20, 2σ) — band width 50.03% |
| $3.63 | Resistance | 52-week high, reached in the August 14, 2026 session |
| $3.59 | Resistance | August 14, 2026 closing high — 0% of the current swing |
| $3.30 | Current | Close, August 21, 2026 — the 23.6% retracement sits at $3.30, and SMA5 at $3.29 |
| $3.13 | Support | 38.2% retracement of the $2.38–$3.59 swing (Jul 24 – Aug 14) |
| $2.85 – $3.09 | Support | Unfilled gap from August 12, 2026; the 50% retracement at $2.99 sits inside it |
| $3.01 | Invalidation | 2×ATR technical invalidation level (−8.9% from close), inside the gap band; the 1×ATR reference is $3.15 |
What to Watch
- The $3.13–$3.09 shelf. The 38.2% retracement and the top of the August 12 gap sit within 1.2% of each other, and the 2×ATR technical invalidation level at $3.01 lies just beneath them. Daily closes above $3.13 keep the pullback reading orderly; a close inside the gap band says the thrust is being retraced.
- Whether the July 7 golden cross survives. The histogram at +0.019 is the narrowest of this leg. A dead cross would be the first momentum break since the base low, and it would most likely coincide with the shelf failing.
- The slope of Mansfield RS, not its level. A weekly change of −12.41 points is a large give-back even from +45.82. A second week of that scale would matter far more than the still-impressive +33.4% reading.
- Volume on any retest of $3.59. The original move came on two flagged spike sessions. A push back to the August high on turnover near the 20-day average would be a materially weaker confirmation than the one that created the level.
- How the bands behave. Width of 50.03% is near the extreme of the two-year panel. Contraction with price holding sideways is trend-friendly; contraction driven by price falling toward the $2.93 midline is the opposite.