Catalyst Metals
$6.78 −30.82% from the 52-week high of $9.80 · +51.34% from the 52-week low of $4.48
This analysis is based on closing-price data as of September 18, 2026. Whether you're researching Catalyst Metals (CYL) on the ASX or learning how to read stock charts, here are objective support, resistance and technical invalidation levels built from the RSI, MACD and ATR indicators.
The two-year chart is a round trip and a partial recovery: a climb from a late-2024 base at the bottom of the two-year range to the February 2026 peak that set the $9.80 52-week high, a decline that bottomed at the $4.48 52-week low in the middle of 2026, and a grind back to $6.78 — still 30.82% beneath the 52-week high and 51.34% above the low. The screen flagged this one as a pullback, and the pullback description is the accurate part: the close sits 1.24% above SMA20 with both SMA20 and SMA5 rising, 9.95% above SMA60, and roughly 4.5% under its 20-day high. What is not in place is the full rising order — SMA5 at $6.6280 is 1.03% beneath SMA20 at $6.6970, so the fast line has not yet come back over the medium one. Three further things deserve to be said plainly before anything else on this page: ADX reads 8.84, which is a ranging market rather than a trending one; both RSI and OBV carry bearish divergences from the same pair of peaks; and the last session's volume tells us nothing at all about this stock, because Friday September 18 was the S&P/ASX quarterly index rebalance trade day.
Snapshot as of September 18, 2026 close
| Metric | Value | Reading |
|---|---|---|
| Close | $6.78 | 30.82% below the 52-week high |
| 52-week high / low | $9.80 / $4.48 | Mid-range: roughly halfway back from the low toward the high |
| SMA5 / SMA20 / SMA60 | $6.6280 / $6.6970 / $6.1665 | Close above all three, but SMA5 sits 1.03% under SMA20 — the rising order is incomplete |
| Bollinger upper / mid / lower | $7.0010 / $6.6970 / $6.3930 | Close inside the band, 3.16% under the upper rail; width 9.08% |
| aVWAP (2y, anchor Nov 7, 2024) | $6.2108 | Close 9.16% above |
| aVWAP (90d, anchor Jun 15, 2026) | $6.2024 | Close 9.31% above |
| RSI(14) | 54.91 (90d) / 54.91 (2y) | Mid-range, but a bearish divergence is flagged on both frames |
| Mansfield RS vs the S&P/ASX 200 | +1.75% | Outperform, rising — back above zero (prev week −4.755, prev month −2.98) |
| MACD / signal / histogram | 0.0716 / 0.1070 / −0.0354 | Dead cross dated August 31, 2026; both lines still above zero |
| ADX(14) | 8.84 (90d) / 8.62 (2y) | Ranging / weak on both frames — far below the 20 threshold |
| ATR(14) | $0.3347 (4.94%) | About 33 cents of average daily range — a wide session for a $6.78 stock |
| OBV state | 90d distribution, falling · 2y early distribution, flat | Beneath its MA20 on both timeframes; bearish divergence on both |
| Volume vs 20-day average | 2,311,536 vs 1,532,137 (1.51×) | Index-rebalance session — market-wide, and below the market median that day (see below) |
| Fibonacci swing (90d) | $5.40 (Jul 31) → $6.54 (Aug 10) | Up-swing; the close is above the 0% anchor, so the whole ladder sits beneath the market |
| 1× / 2× ATR technical invalidation | $6.45 / $6.11 | 2× sits 9.87% below the last close |
① Price & Moving Averages
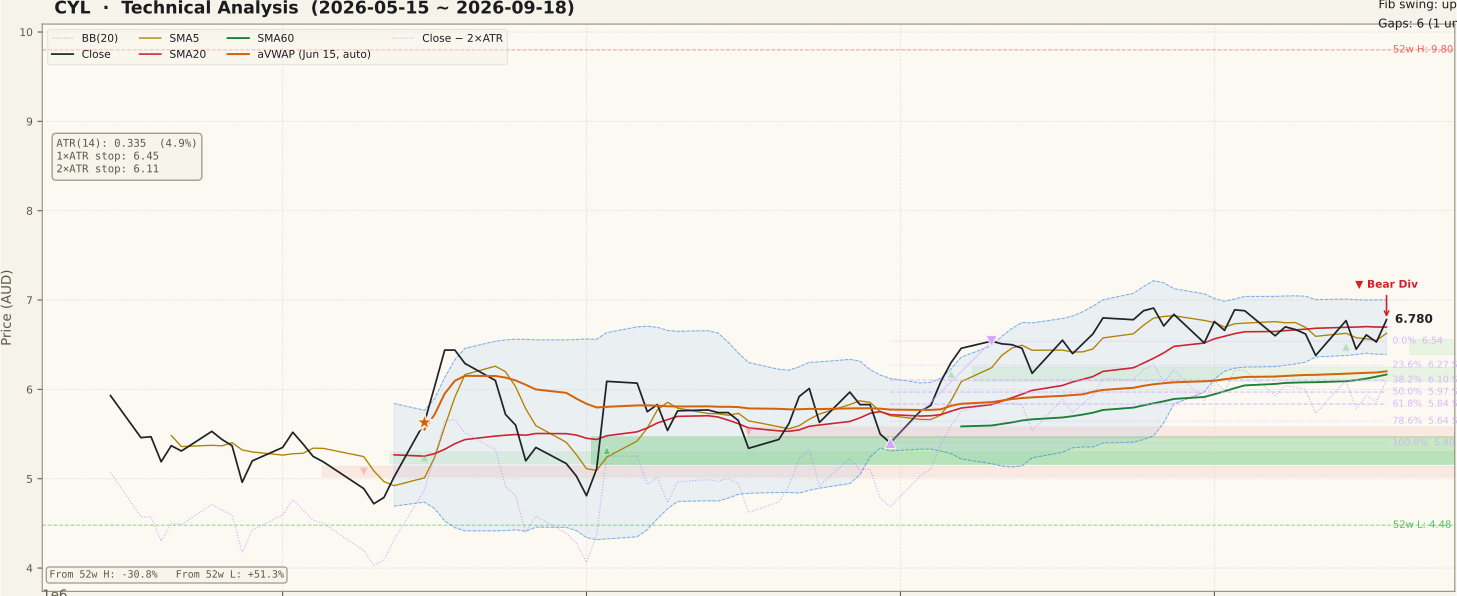
CYL_price-90d-2026-09-20.svgThe close of $6.78 is above all three moving averages — 2.29% above SMA5 $6.6280, 1.24% above SMA20 $6.6970 and 9.95% above SMA60 $6.1665 — and both SMA20 and SMA5 are rising. That combination is what the screen picked up. But the arrangement of the averages among themselves is not the textbook one: SMA5 is 1.03% below SMA20, so the sequence reads SMA20 above SMA5 above SMA60 rather than the rising SMA5 > SMA20 > SMA60 order. The fast line dipped under the medium one during the September drift and has not yet recovered it. This page does not describe the structure as a full alignment, because it is not one.
The second thing to calibrate is distance. ATR(14) is $0.3347, so an average session covers about 33 cents. The gap between the close and SMA20 is 8 cents — roughly a quarter of one average session. "Near the 20-day" is arithmetically true and practically almost meaningless at this volatility: a single ordinary session can put the close either side of that line without changing anything structural. The same scaling applies to the whole cluster between $6.63 and $6.70, where SMA5, SMA20 and the Bollinger middle band (all three of the latter two at $6.6970) sit within seven cents of one another.
Above the market the references thin out quickly. The upper Bollinger rail is $7.0010, 3.16% overhead, with band width at 9.08% of the middle band — a fairly narrow twenty-day distribution. Beyond that the two-year panel shows nothing until the unfilled gap at $7.71–$7.88 from March 6, 2026, which is 13.7% to 16.2% above the close, and then the 52-week high of $9.80. Underneath, the 90-day Fibonacci swing runs from the July 31 low of $5.40 to the August 10 high of $6.54, and the close is 3.54% above that 0% anchor — the price has already carried past the top of the swing the ladder is drawn from, so every retracement level is beneath the market rather than overhead. Anchored VWAP lands in almost the same place on both horizons, $6.2108 from the November 2024 anchor and $6.2024 from the June 15, 2026 anchor, leaving the close 9.16% and 9.31% clear of them. The remaining unfilled gap on the 90-day frame is a support gap at $5.16–$5.47 from July 3, far enough below to be context rather than a working reference.
② Volume

CYL_volume-90d-2026-09-20.svgThe final session traded 2,311,536 shares against a 20-day average of 1,532,137, a ratio of 1.51×. That number carries no information about this stock this week, and the reason is calendar rather than company. Friday September 18 was the S&P/ASX September quarterly index rebalance trade day — announced on September 4 and effective before the open on Monday September 21 — and index-fund flow lifted turnover right across the market in that session. Across the 227-stock screening universe the median volume ratio was 2.04× on the day, against a range of 0.66× to 1.01× on each of the eleven sessions before it.
Measured against that backdrop, CYL's 1.51× is below the market median — roughly 0.74× once the market-wide effect is taken out, which is to say a quieter-than-normal session dressed up as a busy one. Catalyst Metals is not itself an index-change stock. So this page draws no stock-specific conclusion from Friday's volume in either direction, and the raw 1.51× is not treated anywhere here as evidence of anything getting underway or being unwound.
It is worth noticing how the panel itself makes the same point. The chart marks volume spikes at two times the average or more in ochre, and there are several on the 90-day frame — mid-June and early August each produced one. Friday's bar is not among them: at 1.51× it does not even reach the chart's own spike threshold, let alone stand out once the rebalance is accounted for. This is one of the easier traps on a chart, because a bar half again the average is normally the most informative mark on the panel; index rebalances, quarterly futures expiry and large off-market crossings all produce that picture for reasons that have nothing to do with the individual company. The honest summary is that the one panel designed to corroborate price movement is unusable for this stock this week.
③ MACD

CYL_macd-90d-2026-09-20.svgMACD reads 0.0716 against a signal line of 0.1070, giving a histogram of −0.0354, and the last recorded crossover is a dead cross dated August 31, 2026 — about three weeks before the as-of session rather than on it. This is therefore not a fresh signal being read on the day it appeared; it has had time to develop, and what it has produced is a slow convergence downward rather than a sharp separation.
Two qualifications sit either side of that. Both lines remain above zero, so the panel describes momentum fading from a high-side peak rather than momentum turning negative outright — the 90-day frame shows the pair topping in early September and easing since. On the other hand, a histogram that has stayed negative for three weeks is a different object from a same-day crossover: the drift is persistent rather than incidental, and it developed while the price was making its September high. That last detail is the connecting thread to the RSI and OBV sections below, where the same divergence between price and internals shows up in two more places.
④ RSI

CYL_rsi-90d-2026-09-20.svgRSI(14) reads 54.91 on the 90-day frame and 54.91 on the two-year frame — squarely mid-range, neither overbought nor weak, and on its own an unremarkable number. The interesting field is the divergence flag, which is set to bearish on both timeframes with the peaks supplied explicitly: August 17, 2026 at a price of $6.55 with RSI 64.11, then September 18, 2026 at a price of $6.78 with RSI 55.29. Price made the higher high; the oscillator made a materially lower one.
That is the textbook regular bearish configuration, and it is worth reading carefully rather than dramatically. A divergence describes a loss of momentum behind a price advance — the second push was made with less internal force than the first — and it is a possibility of a turn, not a confirmation of one. Divergences can persist for weeks and can be cancelled outright by a strong session that resets the oscillator. Calling a top on the divergence alone, before the price has done anything to corroborate it, is among the most common ways a beginner turns a cautionary reading into a costly conviction. What the flag legitimately does here is remove the benefit of the doubt: the advance into September was made on weakening momentum, and that belongs in the ledger alongside the constructive items.
⑤ Mansfield Relative Strength

CYL_rs-90d-2026-09-20.svgMansfield RS versus the S&P/ASX 200 reads +1.75% and is tagged as rising. Because the prior figures are absolute readings rather than changes, the arithmetic has to be done explicitly: a week ago RS stood at −4.755, so the weekly change is +6.50; a month ago it stood at −2.98, so the monthly change is +4.73. Both changes are positive and the current reading is positive, which puts the stock in the positive-and-accelerating quadrant on both horizons — the strongest of the four configurations.
The quadrant label overstates the position if it is read without the level, and the level is the point. RS crossed back above zero inside the last week; at +1.75% the stock is barely on the outperforming side of the line, and a single weak session against a firm index would put it back underneath. The two-year panel supplies the context that makes this legible: RS was deeply positive through late 2024, decayed steadily across the whole of 2025 as the index caught up, and spent the middle of 2026 below zero. What the panel shows at the right edge is a stock that has stopped lagging, not a stock that leads. That distinction matters because relative strength is the frame every other reading is judged inside — a chart with weakening internals is a different proposition under an established leader than under a name that has just clawed back to parity.
⑥ ATR & ADX

CYL_atr_adx-90d-2026-09-20.svgADX(14) reads 8.84 on the 90-day frame and 8.62 on the two-year frame. Both are tagged ranging, and both sit far below the 20 that marks the bottom of a forming trend, let alone the 25 that marks a strong one. The two-year panel puts the reading in perspective: ADX repeatedly reached and held the trending band through 2024 and 2025, and the current value sits near the low end of everything visible on the chart. ADX measures the strength of directional movement rather than its direction, so a reading this low does not say the market is falling — it says there is no measurable directional trend at all, in either direction.
That has a direct bearing on how the rest of this page is read. A pullback structure presumes a trend to pull back within; at ADX 8.84 the more defensible description is a price oscillating inside a range that happens to have drifted higher since early August. Levels on a ranging chart are boundaries, not waypoints, and breakouts from this kind of regime fail more often than they extend.
ATR(14) is $0.3347, or 4.94% of the last close — a wide daily range for a $6.78 stock, and the figure that sets the scale for every level here. The distance from the close up to the upper Bollinger rail at $7.0010 is about two-thirds of one average session; the entire ladder from that rail down to the 2× ATR technical invalidation level is roughly 2.7 sessions. Levels packed this tightly relative to daily range are zones rather than lines, and any single wide session can cross several of them. The 1× ATR technical invalidation level sits at $6.45 (4.94% below the close) and the 2× level at $6.11 (9.87% below).
⑦ OBV

CYL_obv-90d-2026-09-20.svgThis is the weakest group of readings on the page, and the two timeframes agree on direction while differing in degree. On the 90-day frame OBV is 1,035,951 against an MA20 of 1,569,921 — tagged distribution, beneath its average with a falling slope. On the two-year frame OBV is 45,457,591 against an MA20 of 45,991,561 — tagged early distribution, beneath its average with a flat slope. The magnitudes are not comparable between frames because OBV accumulates from the start of each window; the states and slopes are.
The gap between OBV and its own MA20 is −34.01% on the 90-day frame and −1.16% on the two-year frame. It is worth being explicit about what that figure is, because the field name invites a misreading: it measures how far the cumulative-flow line has stretched from its own twenty-period mean, and it is not a divergence. The 90-day number is large mainly because the 90-day OBV baseline is small, which is exactly the kind of arithmetic that makes an eye-catching percentage out of a modest move.
The actual divergence fields are the ones that matter, and both frames report bearish. They use the same pair of dates as the RSI divergence: August 17 at $6.55 with 90-day OBV 4,125,052, then September 18 at $6.78 with 90-day OBV 1,035,951 — price higher, cumulative flow substantially lower. The two-year frame tells the same story at 48,546,692 falling to 45,457,591. Two independent internals disagreeing with price over the same three weeks is a stronger observation than either one alone, and the 90-day panel shows the shape clearly: OBV rolled over from its early-September peak and has spent the last fortnight sliding beneath a still-rising average. One caveat belongs here for symmetry — the final session's contribution to OBV comes from the same rebalance-inflated volume bar the volume section set aside, so the very last tick inherits that distortion. The deterioration, however, predates it by two weeks and does not depend on it.
Bull Case vs Bear Case
Bull Case
- Close $6.78 is above all three averages — 9.95% above SMA60 $6.1665, 1.24% above SMA20 $6.6970 and 2.29% above SMA5 $6.6280 — with SMA20 and SMA5 both rising.
- Mansfield RS is back above zero at +1.75% versus the S&P/ASX 200, having improved +6.50 on the week (from −4.755) and +4.73 on the month (from −2.98).
- The close is 3.54% above the $6.54 anchor high of the July 31 – August 10 up-swing, so the entire Fibonacci retracement ladder sits beneath the market rather than overhead.
- Anchored VWAP is $6.2024 on the 90-day frame and $6.2108 on the two-year frame, leaving the close 9.31% and 9.16% clear — the average price paid over both horizons is well below the market.
- RSI at 54.91 is mid-range on both frames: the September drift has cooled the oscillator without pushing it anywhere near weakness, and the stock is 51.34% above its $4.48 52-week low.
- Bollinger width is a contained 9.08% with the close in the upper half of the band, 3.16% inside the $7.0010 rail — a narrow twenty-day distribution rather than a stretched one.
Bear Case
- The full rising order is not in place: SMA5 $6.6280 sits 1.03% beneath SMA20 $6.6970, so the fast line has not recovered the medium one.
- ADX is 8.84 (90d) and 8.62 (2y) — deep in the ranging band on both frames, so there is no measurable directional trend for a pullback to resume into.
- MACD has been under its signal line since the August 31 dead cross, with the histogram at −0.0354 and the pair converging downward from an early-September peak.
- RSI carries a bearish divergence on both frames: price $6.55 → $6.78 between August 17 and September 18 while RSI fell 64.11 → 55.29.
- OBV carries a bearish divergence over the same dates and is beneath its MA20 on both frames (90d 1,035,951 vs 1,569,921, tagged distribution and falling).
- Volume settles nothing this week — 1.51× is a market-wide rebalance artifact and below that day's median — while the close remains 30.82% under the $9.80 52-week high with an unfilled gap at $7.71–$7.88 in between.
Scenarios
| Scenario | Probability | Path | Trigger / Invalidation |
|---|---|---|---|
| Range continues around the 20-day line | 45% | The most direct reading of ADX 8.84 and a 9.08% band width: the close keeps oscillating through the $6.63–$6.70 cluster where SMA5, SMA20 and the Bollinger middle band sit, neither reaching the $7.0010 rail nor losing the $6.45 shelf, while the RSI and OBV divergences neither confirm nor dissolve. | Trigger: sessions that close neither above $7.00 nor beneath $6.45. Resolved upward by a close above $7.00, downward by a close beneath $6.27. |
| Recovery extends toward the rail and the March gap | 30% | SMA5 recovers above SMA20 to complete the rising order, MACD re-crosses upward, OBV regains its MA20 and cancels the divergence, and the close clears the $7.0010 Bollinger rail with the unfilled $7.71–$7.88 gap from March 6 the next reference above it. | Trigger: a daily close above $7.00 with OBV back above its MA20, ideally on above-average turnover in a normal, non-rebalance session. Invalidated by a close back beneath $6.45. |
| Divergences resolve lower | 25% | The two bearish divergences follow through: the close loses the $6.6970 SMA20 and Bollinger-middle zone, then the $6.54 swing anchor and the $6.45 1× ATR shelf, and works toward the 23.6% retracement at $6.2710, where the two aVWAP readings ($6.2024 / $6.2108) and SMA60 ($6.1665) sit immediately beneath. | Trigger: a close beneath $6.27 that is not recovered within a few sessions. The structure fails on a close beneath the 2× ATR technical invalidation level at $6.11, with the 38.2% retracement at $6.1045 in the same zone. |
Key Levels & Volatility References
| Level | Role | Basis |
|---|---|---|
| $7.00 | Resistance | Upper Bollinger rail ($7.0010), 3.16% above the close — the nearest overhead reference on either frame; the next one is the unfilled $7.71–$7.88 gap from March 6, 2026 |
| $6.78 | Current | Last close, September 18, 2026 |
| $6.70 | Support | SMA20 and the Bollinger middle band at the same value ($6.6970), 1.24% below the close — about a quarter of one average session away |
| $6.63 | Support | SMA5 ($6.6280), rising but still 1.03% under SMA20; the two form a single seven-cent zone at this volatility |
| $6.54 | Support | 0% anchor of the July 31 – August 10 up-swing, recorded August 10, 2026, and the price peak that opens the RSI and OBV divergences (close $6.55 on August 17) |
| $6.45 | Support | 1× ATR technical invalidation level ($6.445), 4.94% below the close |
| $6.11 | Invalidation | 2× ATR technical invalidation level ($6.111), 9.87% below the close; the 38.2% retracement at $6.1045 sits in the same zone, with SMA60 $6.1665 and the two aVWAP readings just above |
What to Watch
- Whether SMA5 recovers above SMA20. The gap is 1.03% and it is the single missing piece of the rising order the screen's pullback logic assumes — until it closes, the structure is a price above three averages rather than an aligned one.
- Whether the RSI and OBV divergences confirm or dissolve. Both run from August 17 to September 18 and both are unconfirmed by price; a close beneath the $6.63–$6.70 average cluster would give them their first corroboration, while a strong session that resets the oscillators would retire them.
- Whether ADX lifts off 8.84 toward 20. Until it does, the levels on this page are the boundaries of a range rather than waypoints in a trend, and moves through them carry a higher failure rate than the same moves would in a trending regime.
- Volume in the first normal week after the rebalance. Turnover from Monday September 21 onward is the first clean read available, and the comparison worth making is against the 20-day average once the distorted session has rolled out of it.
- The sector backdrop, which sits entirely outside these panels. The strongest session in the week just finished was Monday September 14 at +6.11%, when Australian gold peers were mixed — some higher, some lower — so the move was only partly sector-driven and no company-specific catalyst was identified in public sources. Resource names are also sensitive to drilling and production news, and trading halts around capital raisings are a routine ASX convention that can leave gaps on the chart.