Karoon Energy
This analysis is based on closing-price data as of September 18, 2026. Whether you're researching Karoon Energy (KAR) on the ASX or learning how to read stock charts, here are objective support, resistance and technical invalidation levels built from the RSI, MACD and ATR indicators.
Karoon Energy closed the week at $1.815, 19.7% below the $2.26 52-week high set on April 24, 2026 and 44.6% above the $1.255 low of June 26 — a low made only three months ago, in the same calendar quarter as the high. The chart appears on the screen as a pullback rather than a breakout, and the structure supports that label: SMA5 $1.849 sits above SMA20 $1.790 above SMA60 $1.667 with all three rising, but the close has slipped back beneath the fastest line after two consecutive down sessions and now rests 1.4% above SMA20, 5.7% under the 20-day high. Relative strength is the constructive half of the picture — Mansfield RS of +6.26% against the S&P/ASX 200 with an outperform tag — and cumulative volume is the cautious half, with a bearish OBV divergence flagged on both the two-year and 90-day frames. One housekeeping note before anything else: Friday, September 18 was the S&P/ASX September quarterly rebalance trade day, so the volume printed on that bar carries a market-wide distortion and is treated accordingly in section ②.
Snapshot as of September 18, 2026
| Item | Value | Reading |
|---|---|---|
| Close | $1.815 | −19.7% from 52w high · +44.6% from 52w low |
| 52-week range | $1.255 – $2.26 | Mid-range. Both extremes are recent — the high on Apr 24, 2026, the low on Jun 26, 2026 |
| SMA 5 / 20 / 60 | $1.849 / $1.790 / $1.667 | Correctly stacked and rising, but the close is 1.8% below SMA5 while holding 1.4% above SMA20 and 8.9% above SMA60 |
| Bollinger (20) | $1.890 / $1.790 / $1.690 | Band width 11.17%; the close sits inside the envelope, 4.1% under the upper band and 6.9% above the lower |
| aVWAP (2y anchor Mar 2, 2026) | $1.816 | The long-horizon anchored average runs 0.1% above the close — price is sitting exactly on it, neither side of the ledger |
| aVWAP (90d anchor Jun 16, 2026) | $1.609 | Price 12.8% above the anchor set during the mid-June decline |
| RSI(14) | 54.3 | Mid-range on both frames — above the 50 pivot, far from either threshold. No RSI divergence flagged |
| Mansfield RS (vs the S&P/ASX 200) | +6.26% | Outperform with a rising slope: +3.10 points over the month, but −1.04 points over the week |
| MACD (12,26,9) | 0.0350 / 0.0334 / +0.0016 | Golden cross of Sep 10, 2026; histogram positive but shallow, with both lines just above zero |
| ADX(14) | 25.6 | 25.2 on the two-year frame — directly on the 25 boundary between a forming trend and a strong one |
| ATR(14) | $0.069 (3.8%) | A wide daily range — ordinary noise is worth about seven cents on a $1.815 share |
| OBV (2y / 90d) | early distribution / early distribution | Both frames below their MA20 (−0.52% and −0.98%) with flat slopes, and a bearish divergence flagged on both |
| Volume vs 20d avg | 1.70× | 10,438,143 against a 6,129,955 average — but Sep 18 was the ASX quarterly rebalance session, when the market-wide median ratio was 2.04×. See section ② |
| Unfilled gaps | None | 12 gaps catalogued on the two-year frame and 1 on the 90-day frame; none remain open |
| 1×ATR / 2×ATR technical invalidation | $1.746 / $1.676 | Volatility-based structural reference levels below the close |
① Price & Moving Averages
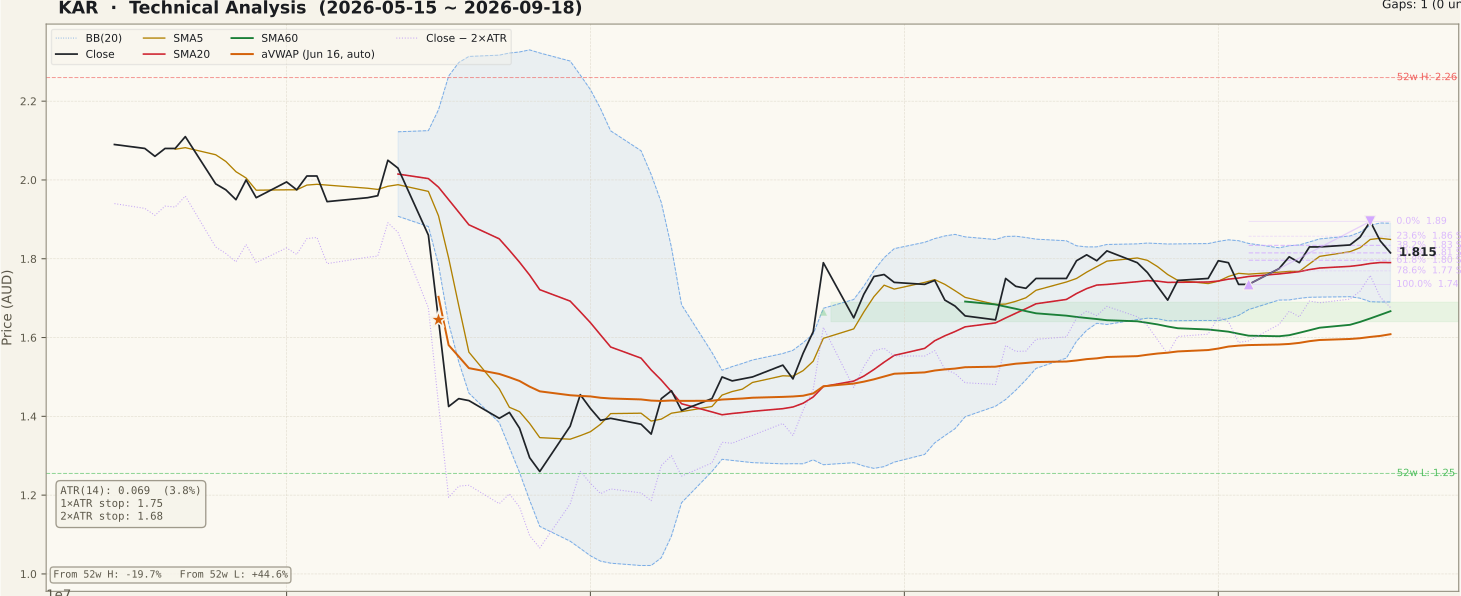
KAR_price-90d-2026-09-20.svgThe two-year frame divides into three acts. From late 2024 through February 2026 the stock ground through a long basing range in the $1.33–$1.70 region, with monthly closes rarely escaping it. The second act was an advance that began with a heavy-volume session on March 2, 2026 — the date the tool selected as its long-horizon VWAP anchor — and carried price to the $2.26 52-week high of April 24. The third act was the give-back: from $2.05 on June 11 to $1.425 on June 17, a 30.5% decline across four sessions on volumes of 15.7, 20.7 and 24.0 million shares against today's 6,129,955 average, with the $1.255 52-week low following on June 26. That episode sits three months outside the recent window and is recorded here as chart context, not as a live signal.
What the 90-day panel shows is the repair of that damage. Price based between roughly $1.26 and $1.50 into mid-July, stepped up through $1.615 to $1.79 on July 23–24, consolidated back to $1.645 by August 10, and has ground higher since — $1.75 on August 11, $1.895 on September 16, then two down sessions to Friday's $1.815. Two structural facts define where that leaves the chart. First, the Fibonacci grid drawn from the June decline puts the 61.8% retracement at $1.811, one-fifth of a cent beneath the close: Karoon has recovered almost exactly 61.8% of the June break, with the 78.6% level at $1.916 and a full retracement at $2.05 overhead. Second, the shorter grid built from the September 4 low of $1.735 to the September 16 high of $1.895 places its 50% level at $1.815 — the close is sitting on it to the cent. Both readings say the same thing in different registers: this is the midpoint of a move, not the edge of one. The moving averages agree, with the close having given back SMA5 $1.849 while the $1.790 SMA20 and Bollinger mid line — the two coincide exactly — remain the first shelf beneath.
② Volume

KAR_volume-90d-2026-09-20.svgFriday traded 10,438,143 shares against a 20-day average of 6,129,955, a ratio of 1.70×. That figure needs a market-wide correction before it is read as anything about this stock. September 18, 2026 was the trade day for the S&P/ASX September quarterly rebalance — announced on September 4 and effective before the open on Monday, September 21 — and index-fund flow lifted turnover across the whole board that session. The median volume ratio across the 227 stocks screened for this issue was 2.04× on September 18, against a range of 0.66× to 1.01× on each of the eleven sessions before it. Karoon's 1.70× therefore sits below the market median for the day: adjusted for the market-wide effect it works out near 0.83×, which is an entirely ordinary session.
The practical consequence is that Friday's bar says nothing about participation in this particular name, in either direction, and the detector's "vol 1.7×" note is an artifact of the calendar rather than a stock-specific reading. Karoon is not itself an index-change stock in this rebalance, so there is no addition or deletion flow to attribute the bar to. The honest position is to set that session aside and look at the surrounding window instead, where the 90-day panel shows moderate and fairly even turnover through the September advance — heavier bars on the July 24 step-up and the September 16 high, lighter bars through the August consolidation — and nothing resembling the 15–24 million share sessions that marked the June decline. This is also the common beginner's trap running in reverse: a single elevated bar is usually read as confirmation, and on a rebalance day it confirms nothing at all. The first clean read of participation will be the next session that is not distorted by index flow.
③ MACD

KAR_macd-90d-2026-09-20.svgMACD registered a golden cross on September 10, 2026 and has held it. The line reads 0.0350 against a signal of 0.0334, with the histogram at +0.0016. The two frames agree to four decimal places, so there is no timeframe conflict to reconcile.
Both the strength and the weakness of this signal come from the same place: it happened just above zero. A cross that occurs close to the zero line is an early-stage reading rather than a late-stage one, which is the constructive interpretation, and it is consistent with a chart that has spent three months repairing a decline rather than extending a mature advance. The caution is that the separation is tiny — a histogram of +0.0016 on a stock whose ATR is $0.069 means the two lines are effectively touching, and a cross this shallow can be reversed by two or three ordinary sessions. Friday's close beneath SMA5 is exactly the kind of session that compresses it. What would give the reading weight is histogram expansion over the following week rather than the cross itself; what would negate it is the histogram rolling back through zero while price is beneath the $1.790 shelf.
④ RSI

KAR_rsi-90d-2026-09-20.svgRSI(14) reads 54.3 on both frames — above the 50 pivot, nowhere near the 70 overbought threshold or the 30 oversold line. No RSI divergence is flagged on either frame, and the divergence peak fields are empty, so there is nothing to describe beyond the level itself.
A mid-50s reading after a two-session pullback from a 90-day high is neutral information, and neutral information is worth stating plainly rather than dressing up. It tells us the pullback has been orderly: momentum has come off the September 16 peak without breaking the 50 line, which is the behaviour a retracement inside an uptrend produces and is not the behaviour of a failing advance. It also tells us there is room in both directions — an RSI of 54.3 neither warns of exhaustion nor promises a bounce. The 90-day panel shows the oscillator recovering from a deeply oversold June and oscillating in a 40–70 band since, with no sustained stay above 70 during the whole September advance. For readers watching this name, the useful levels are the 50 line beneath and the 70 line overhead; neither is close.
⑤ Mansfield Relative Strength

KAR_rs-90d-2026-09-20.svgMansfield RS against the S&P/ASX 200 reads +6.26% with a rising slope, identical across both frames as the anchor-free construction requires. Karoon is outperforming the Australian market, which is the single most useful thing to know about a stock that is still 19.7% below its own 52-week high.
The increments are where the nuance lives. RS was 7.31 a week ago and 3.17 a month ago, so the change is −1.04 points on the week against +3.10 points on the month. In positive territory a negative weekly change is slowing outperformance, not deterioration into laggard status — the reading is still comfortably above zero and the monthly trend is clearly up — but it does mean the last five sessions gave back about a third of the month's relative gain. That is consistent with the price panel, where the same two down sessions that cost the stock SMA5 also cost it ground against the index. The two-year panel puts the level in perspective: RS spent most of 2025 below zero, crossed decisively above it during the March–April 2026 advance, fell back through zero in the June decline, and has been rebuilding since. A modest positive reading on a rising monthly trend is a reasonable foundation; it is not the commanding leadership that a double-digit RS would describe, and the weekly slippage deserves watching rather than dismissal.
⑥ ATR & ADX

KAR_atr_adx-90d-2026-09-20.svgADX(14) reads 25.6 on the 90-day frame and 25.2 on the two-year frame. The JSON tags that state "strong", and the label is technically correct, but the honest description is that the reading is sitting directly on the 25 threshold — a trend that has just qualified rather than one that is powering. Readings this close to the line move either way on a handful of sessions, and ADX measures strength rather than direction in any case; the direction here is set by the price panel.
ATR(14) is $0.069, or 3.8% of price. That is a wide daily range for a mid-cap producer and it is the number that sets the structural references at the foot of this page: 1×ATR beneath the close is $1.746 and 2×ATR is $1.676, the latter 7.7% below the current price and beneath both the $1.735 September 4 low and the $1.690 lower Bollinger band. That $1.676 line is the technical invalidation level used throughout this analysis — the point at which the July-to-September repair sequence described in section ① no longer holds its shape. The ATR panel also carries a memory worth respecting: volatility spiked violently in mid-June and, while it has compressed since, a stock capable of a 30.5% move in four sessions requires levels to be set with room, not with precision.
⑦ OBV

KAR_obv-90d-2026-09-20.svgBoth frames tag the same way and both carry a flag. OBV is tagged early distribution on the two-year and the 90-day frames alike, below its MA20 in each case — by 0.52% and 0.98% respectively — with a flat slope on both. More importantly, a regular bearish divergence is flagged on both frames, and the peak fields give it precisely: price $1.75 on August 11 rising to $1.895 on September 16, while OBV fell from 94,843,944 to 91,701,763 on the two-year frame and from −21,275,306 to −24,417,487 on the 90-day frame. Price made the higher high; cumulative volume made a lower one on both measurements.
This is the clearest counterweight the chart offers, and it deserves a careful reading rather than an alarmed one. A bearish divergence is a statement that the September advance was carried on less cumulative flow than the August one — which is a caution about the quality of the move — but it is a statement about possibility, not a confirmed top, and none of the price structure beneath has been broken. One clarification for readers comparing figures: the −0.52% and −0.98% values are gaps between OBV and its own 20-day average, a measure of how stretched flow is from its mean. They are not the divergence signal, despite the similar name. The divergence itself comes from the separate field and the two peaks quoted above. What would confirm it is a daily close beneath the $1.790 shelf with OBV extending its lower high; what would defuse it is OBV recovering back above its MA20 while price holds the same shelf.
Bull Case vs Bear Case
Bull Case
- Rising, correctly ordered moving-average stack: SMA5 $1.849 > SMA20 $1.790 > SMA60 $1.667, with the close 8.9% above the 60-day line
- Mansfield RS +6.26% vs the S&P/ASX 200, tagged outperform with a rising slope and +3.10 points over the month
- MACD golden cross of Sep 10, 2026 still intact, histogram positive at +0.0016 with both lines just above zero — an early-stage rather than late-stage cross
- RSI 54.3 with no divergence flagged: the pullback has been orderly and has not broken the 50 pivot
- Price has recovered 61.8% of the June 11–17 decline, holding fractionally above that $1.811 retracement level, and is 44.6% above the $1.255 June 26 low
- No unfilled gaps on either frame, and price 12.8% above the $1.609 90-day anchored VWAP
Bear Case
- Bearish OBV divergence flagged on both frames: price $1.75 (Aug 11) to $1.895 (Sep 16) while OBV fell 94,843,944 to 91,701,763 on the two-year frame
- OBV tagged early distribution on both frames, below its MA20 (−0.52% and −0.98%) with flat slopes
- The close has given back SMA5 $1.849 over two down sessions and sits 5.7% under the 20-day high
- Mansfield RS lost 1.04 points on the week (7.31 to 6.26) — outperformance that is slowing, not building
- ADX 25.6 / 25.2 sits on the 25 boundary, and the MACD histogram of +0.0016 is shallow enough to reverse within days
- Price remains 19.7% below the $2.26 April high, the two-year aVWAP $1.816 caps the close exactly, and ATR at 3.8% describes a stock that moved 30.5% in four sessions as recently as June
Scenarios
| Scenario | Probability | Path | Trigger / Invalidation |
|---|---|---|---|
| Pullback resolves sideways inside the repair sequence | 45% | The most likely path given a close sitting on two separate midpoints. Price works between the $1.790 SMA20 shelf and the $1.895 September high while the moving averages catch up and the OBV divergence either resolves or is confirmed. | Trigger: continued closes between $1.790 and $1.895 with RSI in the 45–65 band. Invalidation: a daily close beneath $1.735 or above $1.895. |
| Repair sequence resumes toward the June breakdown levels | 30% | The stock recovers SMA5, clears the $1.890 upper band and the $1.895 September 16 high together, and the 61.8% retracement it has already reached extends toward the 78.6% level at $1.916 and the $2.05 full retracement of the June decline. | Trigger: a daily close above $1.895 on volume above the 6,129,955 average in a session with no index-flow distortion. Invalidation: failure back beneath $1.790 within the same week. |
| The OBV divergence receives price confirmation | 25% | The lower high in cumulative volume is followed by a lower high in price: a close beneath the $1.790 SMA20 and Bollinger mid line, then the $1.735 September 4 low, with the $1.690 lower band and the $1.676 volatility line as the next references beneath. | Trigger: a daily close beneath $1.790 on above-average volume, with the MACD histogram back through zero. Invalidation: recovery and a close back above $1.849. |
Key Levels & Volatility References
| Level | Role | Distance | Basis |
|---|---|---|---|
| $1.895 | Resistance | +4.4% | Sep 16, 2026 swing high — the 0% anchor of the 90-day retracement grid |
| $1.890 | Resistance | +4.1% | Upper Bollinger Band (20) at 11.17% band width, capping the same zone |
| $1.849 | Resistance | +1.9% | SMA5 — the first line overhead after two down sessions; the 23.6% retracement at $1.857 sits just above it |
| $1.815 | Current | — | Sep 18, 2026 close, exactly the 50% retracement of the Sep 4–Sep 16 swing; the two-year aVWAP $1.816 and the 61.8% retracement of the June decline ($1.811) both sit on the same line |
| $1.790 | Support | −1.4% | SMA20 and Bollinger mid coincide exactly; the 61.8% level of the 90-day grid ($1.796) sits immediately above |
| $1.735 | Support | −4.4% | Sep 4, 2026 swing low — the 100% anchor of the 90-day grid; 1×ATR at $1.746 sits just above |
| $1.676 | Invalidation | −7.7% | 2×ATR technical invalidation level, beneath both the September low and the $1.690 lower Bollinger band |
What to Watch
- The $1.790 shelf. SMA20 and the Bollinger mid line coincide there to the cent, with the 61.8% retracement of the September swing at $1.796 immediately above. A daily close beneath it is the first price confirmation the flagged OBV divergence has lacked; $1.676 is the volatility-based line further down.
- The first undistorted volume reading. Friday's 1.70× ratio is a rebalance artifact, so the next ordinary session is the first clean measurement of participation. The 6,129,955 twenty-day average is the reference.
- OBV versus its MA20. The line is 0.52% and 0.98% below on the two frames with a flat slope. Recovery above the average while price holds $1.790 would defuse the divergence; a deepening gap alongside a lower price high would confirm it.
- Mansfield RS increments. The weekly change has turned negative (−1.04 points) while the monthly change remains positive (+3.10). A second negative week would mark the relative-strength argument as fading rather than pausing.
- The $1.890–$1.895 band overhead. The upper Bollinger band and the September 16 high sit within half a cent of each other. Clearing both on an ordinary session would open the $1.916 and $2.05 retracement levels left behind by the June decline.