AMP Limited
$2.52 −0.79% from the 52-week high of $2.54 · +121.05% from the 52-week low of $1.14
This analysis is based on closing-price data as of September 18, 2026. Whether you're researching AMP Limited (AMP) on the ASX or learning how to read stock charts, here are objective support, resistance and technical invalidation levels built from the RSI, MACD and ATR indicators.
The two-year panel divides cleanly in two: eighteen months of range-bound trade beneath $2.00, then a sharp break early in 2026 that carried the price to the 52-week low of $1.14, a base through the second quarter, and an advance from July that has run almost without interruption to a close of $2.52 — 121.05% above that low and 0.79% under the 52-week high of $2.54. What the screen flagged here is the moving-average structure, and in this case that structure is unusually old: SMA5 above SMA20 above SMA60 in rising order has held continuously since June 18, sixty-seven sessions, which makes it the most mature trend arrangement in this week's set rather than a configuration that appeared in the last fortnight. The counterweight is on the momentum panels, not the price panel — MACD has been under its signal line since a dead cross on August 14, and the JSON records a bearish RSI divergence between the August 20 and September 18 peaks. One thing this week's chart cannot settle is what the last session's volume meant: Friday September 18 was the S&P/ASX September quarterly rebalance trade day and turnover was elevated right across the market.
Snapshot as of September 18, 2026 close
| Metric | Value | Reading |
|---|---|---|
| Close | $2.52 | 0.79% below the 52-week high; the highest close on the two-year panel |
| 52-week high / low | $2.54 / $1.14 | At the very top of the two-year range |
| SMA5 / SMA20 / SMA60 | $2.50 / $2.4410 / $2.1738 | Rising order unbroken since June 18 (67 sessions); close above all three |
| Bollinger upper / mid / lower | $2.5537 / $2.4410 / $2.3283 | Close inside the band, 1.32% under the upper rail; width 9.24% |
| aVWAP (2y, anchor Feb 12, 2026) | $1.6964 | Close 48.55% above |
| aVWAP (90d, anchor Jul 16, 2026) | $2.2791 | Close 10.57% above |
| RSI(14) | 68.06 (90d) / 68.06 (2y) | Beneath the 70 line; bearish divergence reported on both frames |
| Mansfield RS vs the S&P/ASX 200 | +47.90% | Outperform, rising (prev week 45.52, prev month 39.78) |
| MACD / signal / histogram | 0.0670 / 0.0742 / −0.0071 | Dead cross dated August 14, 2026; histogram negative since |
| ADX(14) | 55.55 (90d) / 55.44 (2y) | Deep in the strong-trend band on both frames |
| ATR(14) | $0.0655 (2.60%) | About 6.6 cents of average daily range |
| OBV state | 90d accumulation, rising · 2y accumulation, rising | Above its MA20 on both timeframes; no OBV divergence reported |
| Volume vs 20-day average | 26,147,828 vs 11,511,700 (2.27×) | Index-rebalance session — market-wide, not stock-specific (see below) |
| Fibonacci swing | $2.35 (Aug 27) → $2.52 (Sep 18) | Up-swing; levels below the price act as retracement support |
| 1× / 2× ATR technical invalidation | $2.45 / $2.39 | Exact values $2.454 and $2.389; 2× sits 5.20% below the last close |
① Price & Moving Averages
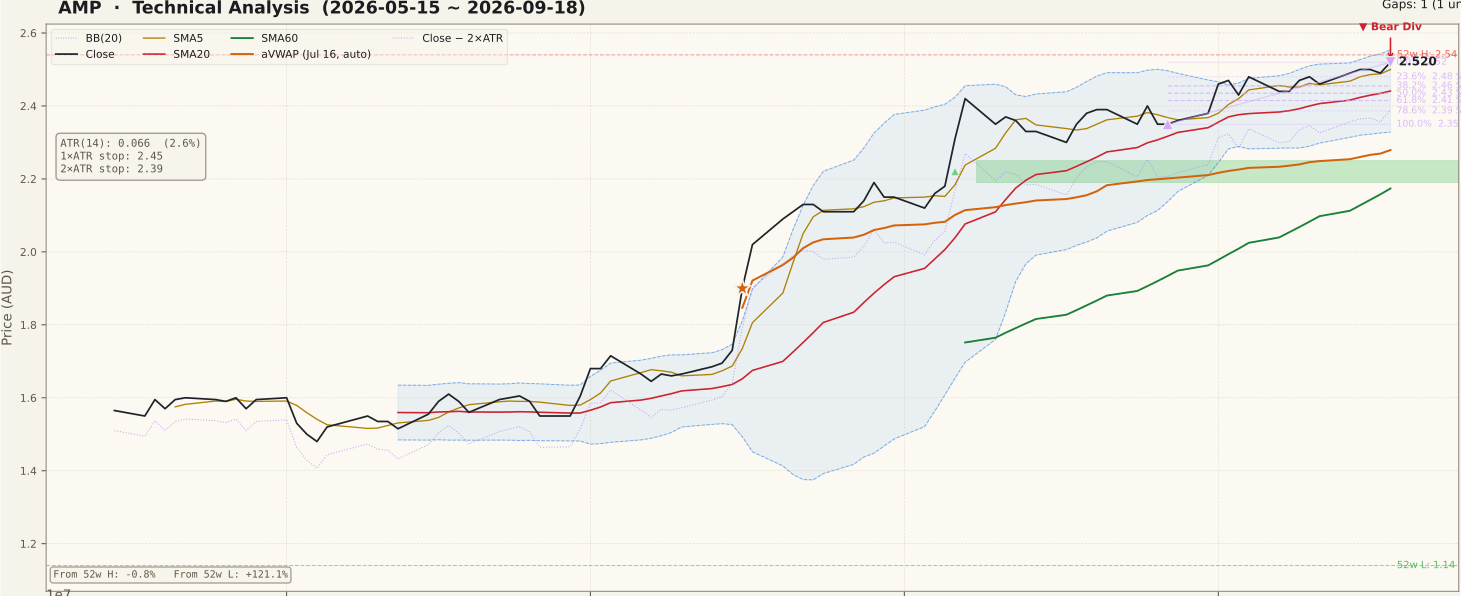
AMP_price-90d-2026-09-20.svgThe averages are in rising order and the close sits above all three: $2.52 against SMA5 $2.50 (+0.80%), SMA20 $2.4410 (+3.24%) and SMA60 $2.1738 (+15.93%). The detector described the last session as a touch of SMA5, and the arithmetic supports that description — eight-tenths of one percent is a fraction of the 2.60% average daily range, so the price and its five-day line are effectively in contact rather than separated.
The age of the arrangement is the substantive point on this page. SMA5 above SMA20 above SMA60 has held without a break since June 18 — sixty-seven sessions, more than three months. That is a different object from a stack that formed a fortnight ago: the slower averages have had time to catch up beneath the price, each of the pullbacks since July has been absorbed without disturbing the order, and SMA60 at $2.1738 now sits 13.75% beneath the close rather than hugging it. A structure of that age does not guarantee continuation, but it does mean the burden of proof has shifted — it takes a sustained move, not a single session, to undo it.
The overhead picture is tight and specific. The 52-week high of $2.54 is 0.79% above the close and was reached intraday on three separate sessions in the week just finished without a close above it, so the nearest resistance is a level the market has already tested and not cleared. The upper Bollinger rail at $2.5537 is 1.32% above the close, and band width is 9.24% of the middle band — the price has spent recent weeks tracking the upper half of a band that is neither notably wide nor notably compressed. Anchored VWAP from February 12, 2026 is $1.6964 and the shorter anchor from July 16, 2026 is $2.2791; the close is 48.55% and 10.57% above them respectively, so the average price paid since either anchor sits far beneath the market and there is very little overhead supply from recent buyers. The single unfilled gap on both frames is a support gap at $2.19–$2.25 from August 6, 10.71% below the close — context rather than a working level.
② Volume

AMP_volume-90d-2026-09-20.svgThe final session traded 26,147,828 shares against a 20-day average of 11,511,700 — a ratio of 2.27×. On an ordinary week that bar would carry most of the weight of this section. This was not an ordinary week: Friday September 18 was the S&P/ASX September quarterly rebalance trade day, announced on September 4 and effective before the open on Monday September 21, and index-fund flow lifted turnover right across the market that session. The median volume ratio across the 227-stock screening universe was 2.04× on the day, against a range of 0.66× to 1.01× on each of the eleven sessions before it.
Measured against that backdrop, AMP's 2.27× is essentially at the market median — roughly 1.11× once the market-wide effect is removed, which is to say entirely ordinary. AMP is not itself an index-change stock in the September 2026 rebalance. This page therefore draws no stock-specific conclusion from Friday's volume in either direction, and the detector note reading "vol 2.3x" is an artefact of the calendar rather than a signal about this company. It is not evidence of a move being confirmed and it is not evidence of one being unwound.
That distinction is worth spelling out because it is one of the easier traps on a chart. A volume bar at more than twice the average is normally the most informative mark on the panel, and a reader scanning the 90-day frame will see Friday's bar tower over the average line — the panel highlights it in the same colour it uses for every other spike of the quarter. Calendar events produce that picture for reasons that have nothing to do with the individual company. What the panel does show, setting the last bar aside, is a base rate of participation that rose through July and has stayed near the higher level since, with the 20-day average line well above where it sat in May and June. That is a genuine observation about the quarter; the closing session simply is not available as evidence this week.
③ MACD

AMP_macd-90d-2026-09-20.svgMACD reads 0.0670 against a signal line of 0.0742, giving a histogram of −0.0071, and the last recorded crossover is a dead cross dated August 14, 2026. The two-year frame agrees to four decimals. This is not a fresh signal — it is more than a month old, and the histogram has stayed on the negative side of zero throughout that period.
What makes it worth attention is the comparison with the price panel. Since mid-August the close has continued to make new highs while both MACD lines have drifted lower from their August peak. That is momentum decelerating inside an advance: the rate of change is easing even as the level rises. It is the same message the RSI panel carries in a more formal way, and when two independent momentum measures say it at once the reading deserves to be stated plainly rather than filed away.
The qualification is equally plain. Both lines remain well above zero, which is the difference between an advance losing pace and one turning over. A move below the zero line would be a change of regime; what is on the chart is a high-level fade. The two-year panel shows the same pattern several times during 2025 — the lines separating, converging, re-crossing — and on that evidence a month-old dead cross with the price at new highs is a caution flag rather than a verdict.
④ RSI

AMP_rsi-90d-2026-09-20.svgRSI(14) reads 68.06 on the 90-day frame and 68.06 on the two-year frame, just beneath the conventional overbought line at 70. More importantly, the JSON reports a bearish divergence on both timeframes and supplies the two peaks that define it: on August 20 the price was $2.39 with RSI at 72.71 (72.72 on the two-year frame), and on September 18 the price was $2.52 with RSI at 68.06. Higher price, lower oscillator — the textbook shape of a regular bearish divergence.
The discipline here matters more than the label. A divergence is a statement about the possibility of a turn, not a confirmation of one, and this one has a specific weakness: it is measured against a peak set at a lower price, and the price has since advanced 5.44% and held the gain. Divergences that persist while price keeps making higher closes are common in strong trends, and they frequently resolve by being cancelled — a new high reached with RSI back above 72.71 would erase this one outright. Nothing on the price panel has confirmed it yet: the averages remain in rising order, the close is at the top of the range, and there has been no reversal bar of consequence.
What the divergence does establish is that this advance is being made on progressively less momentum, which is consistent with the MACD reading and with an ADX already above 55. A reading in the high 60s is a trend running warm rather than stretched — it is not the overbought condition of late July and early August, when the oscillator spent weeks above 70. The honest summary is that the oscillator has cooled while price has risen, and that combination is what a divergence is.
⑤ Mansfield Relative Strength

AMP_rs-90d-2026-09-20.svgMansfield RS versus the S&P/ASX 200 reads +47.90% and is tagged as rising. Because the prior figures are absolute readings rather than changes, the arithmetic has to be done explicitly. A week ago RS stood at 45.52, so the weekly change is +2.38. A month ago it stood at 39.78, so the monthly change is +8.12.
Both horizons therefore sit in the positive-and-accelerating quadrant, which is the strongest of the four configurations and the one indicator group on this page that has not softened. Relative strength is not merely positive; it is extending, and it is extending on both the weekly and the monthly view. This is also the single cleanest piece of evidence against reading the momentum divergence as a top — an advance that is losing internal momentum while simultaneously gaining ground on its index is a narrower statement than a turn.
The two-year panel supplies the context that makes +47.90% meaningful. Relative strength was modestly positive through late 2024, fell beneath zero for much of 2025, collapsed deep into negative territory alongside the early-2026 price break, and then recovered through the second quarter before crossing zero around mid-year. The current reading is the highest on the entire two-year frame. A stock that has moved from a deeply negative reading to a two-year high in relative strength inside nine months has changed its position against the index, not merely its price.
⑥ ATR & ADX

AMP_atr_adx-90d-2026-09-20.svgATR(14) is $0.0655, or 2.60% of the last close, and the two-year frame agrees at $0.0655 and 2.601%. That is about 6.6 cents of average daily range, and it sets the scale for every level on this page. The distance from the close up to the 52-week high at $2.54 is roughly a third of one average session; the whole band from the upper Bollinger rail at $2.5537 down to the SMA20 and Bollinger-middle shelf at $2.4410 is about one and seven-tenths average sessions. Levels packed that tightly are zones rather than lines, and a single wide day can cross several of them. The 1× ATR technical invalidation level sits at $2.45 ($2.454) and the 2× level at $2.39 ($2.389), the latter 5.20% below the close.
ADX(14) reads 55.55 on the 90-day frame and 55.44 on the two-year frame — far above the 25 that separates a trending market from a ranging one, and elevated even by the standards of trending markets. ADX measures the strength of a directional move and not its direction, so on its own it says only that the market is strongly committed; read alongside the rising order of the averages it describes a genuine trend rather than chop. The caution attached to a reading this high is the familiar one: an ADX above roughly 50 is characteristic of the mature phase of a move rather than its opening, and the two-year panel shows it has been climbing since July. Readings at this level historically flatten or fall before price does, which is another way of saying the same thing the momentum panels are saying.
⑦ OBV

AMP_obv-90d-2026-09-20.svgBoth timeframes carry the same tag, which is not always the case. On the 90-day frame OBV is 264,662,108 against an MA20 of 206,933,250, tagged accumulation, above its average with a rising slope. On the two-year frame OBV is 501,500,310 against an MA20 of 443,771,452, again accumulation, above its average and rising. Cumulative flow has been making new ground on both horizons.
The gap between OBV and its own MA20 is +27.90% on the 90-day frame and +13.01% on the two-year frame. It is worth being explicit about what that number is, because the field name misleads: it measures the distance between OBV and its own moving average — how stretched the cumulative flow is relative to its recent mean — and it is not a divergence. The actual OBV divergence field is null on both timeframes, so this page makes no OBV divergence claim in either direction. That is a different answer from the RSI panel, which does report a bearish divergence, and the two are left as they stand rather than reconciled into a single verdict: momentum has been fading while cumulative flow has not.
Two qualifications keep this from being read as more than it is. First, a +27.90% stretch above the average on the shorter frame is a wide reading, and wide readings mean-revert — the distance itself is not a fresh positive. Second, the final bar of this series is built from the same rebalance-inflated session the volume panel sets aside, so the very last increment of the OBV line inherits that distortion. Neither point changes the shape of the panel through August and September, which is a steadily rising line above a rising average.
Bull Case vs Bear Case
Bull Case
- SMA5 > SMA20 > SMA60 in rising order unbroken since June 18 — sixty-seven sessions, an established structure rather than a new one; close above all three (+0.80% / +3.24% / +15.93%).
- Mansfield RS +47.90% versus the S&P/ASX 200, accelerating on both horizons (+2.38 on the week, +8.12 on the month) and at its highest reading on the two-year panel.
- ADX(14) at 55.55 (90d) / 55.44 (2y), far into the strong-trend band on both frames.
- Close $2.52 is the highest close on the two-year panel, 121.05% above the 52-week low of $1.14 and 0.79% under the 52-week high of $2.54.
- OBV tagged accumulation on both timeframes, above its MA20 with a rising slope (+27.90% 90d, +13.01% 2y); the divergence field is null, so no negative flow signal is recorded.
- Close 48.55% above the two-year anchored VWAP ($1.6964) and 10.57% above the 90-day anchor ($2.2791), with the only unfilled gap sitting below at $2.19–$2.25 — very little trapped supply overhead.
Bear Case
- The JSON records a bearish RSI divergence on both frames: August 20 at $2.39 with RSI 72.71 against September 18 at $2.52 with RSI 68.06 — higher price, lower oscillator.
- MACD has been beneath its signal line since a dead cross dated August 14, 2026 (0.0670 vs 0.0742, histogram −0.0071), so momentum has faded through a month of new price highs.
- The $2.54 high is an intraday extreme touched on three sessions in the past week without a close above it — the nearest resistance is a level already tested and not cleared.
- ADX above 55 is characteristic of a mature move rather than an early one, and the reading has been climbing since July.
- Volume offers no independent read this week — the closing session's 2.27× was inflated market-wide by the index rebalance, so the one panel designed to corroborate price movement is unusable for this stock.
- With ATR at 6.6 cents (2.60%), the band from the $2.5537 upper rail down to the $2.4410 shelf is only about one and seven-tenths average sessions wide, so one wide day can cross several levels on this page.
Scenarios
| Scenario | Probability | Path | Trigger / Invalidation |
|---|---|---|---|
| Digestion beneath the 52-week high | 40% | The price works sideways between the $2.54 ceiling and the $2.4799 – $2.4410 retracement shelf while SMA20 rises toward it, the MACD lines re-converge and the RSI divergence resolves through time rather than through a decline. The sixty-seven-session alignment stays intact and the fourth test of $2.54 is better supported than the first three. | Trigger: sessions that neither close above $2.54 nor beneath $2.4410. Resolved upward by a close above $2.55, downward by a close beneath $2.4149. |
| Continuation through the range high | 35% | A close above $2.54 and then the $2.5537 upper rail puts the price at two-year highs with no overhead reference on the chart. Relative strength is already accelerating on both horizons, which is the configuration most consistent with this path, and a new high reached with RSI above 72.71 would cancel the divergence rather than extend it. | Trigger: a daily close above $2.55 ($2.5537), ideally in a normal non-rebalance session so that turnover is interpretable. Invalidated by a close back beneath $2.4410. |
| Momentum divergence resolves downward | 25% | The fading MACD and the RSI divergence lead rather than lag: $2.54 holds as a ceiling for a fourth time, the close loses SMA5 and then the $2.4410 SMA20 and Bollinger-middle shelf, and the retracement levels at $2.4149 and $2.3864 come into play. The August 6 support gap at $2.19–$2.25 is the deeper reference if the move extends. | Trigger: a daily close beneath $2.4410 on ordinary turnover. Technical invalidation of the structure at the 2× ATR level of $2.39. |
Key Levels & Volatility References
| Level | Role | Basis |
|---|---|---|
| $2.55 | Resistance | Upper Bollinger rail ($2.5537), 1.32% above the close; band width 9.24% of the middle band |
| $2.54 | Resistance | 52-week high, an intraday extreme reached on three sessions in the week just finished without a close above it; 0.79% above the close |
| $2.52 | Current | Last close, September 18, 2026 — also the 0% anchor of the current up-swing |
| $2.50 | Support | SMA5, 0.80% below the close — a touch rather than a separation, given a 2.60% average daily range |
| $2.48 | Support | 23.6% retracement of the August 27 – September 18 up-swing ($2.4799), 1.59% below the close; the 1× ATR technical invalidation level at $2.454 and the 38.2% retracement at $2.4551 sit just beneath |
| $2.44 | Support | SMA20 and the Bollinger middle band in the same place ($2.4410), 3.13% below the close; the 50% retracement at $2.435 is immediately under it |
| $2.39 | Invalidation | 2× ATR technical invalidation level ($2.389), 5.20% below the close; the 78.6% retracement at $2.3864 lies just beneath, and the swing low of $2.35 from August 27 sits under both |
What to Watch
- Whether a daily close clears $2.54, or whether the level becomes a fourth rejection. Three intraday touches in one week without a close above it is the defining feature of the current chart, and the resolution either way is the most informative event available.
- Whether the RSI divergence is cancelled or confirmed. A new high with RSI back above 72.71 erases it outright; a failure at $2.54 with the oscillator easing further extends it. Divergences in strong trends are cancelled at least as often as they are confirmed, so this is a genuine two-way observation rather than a bearish one.
- Whether MACD re-crosses upward or the histogram widens on the negative side. The cross is now more than a month old with the price at new highs, and that combination has to break in one direction eventually.
- Volume in the first normal week after the rebalance. Turnover from Monday September 21 onward is the first clean read available, and the comparison worth making is against the 20-day average once the distorted session rolls out of it.
- Whether the $2.4410 zone — SMA20 and the Bollinger middle band stacked together — contains a first pullback. That level is also where the sixty-seven-session moving-average alignment would come under pressure, since a sustained move beneath it pulls SMA5 toward SMA20. Regulatory and earnings developments in financial services sit entirely outside these panels and can move the price independently of anything on the chart; no such event appeared in the five sessions this page reads, but that is a statement about this week, not about next week.