Bravura Solutions
This analysis is based on closing-price data as of August 28, 2026. Whether you're researching Bravura Solutions (BVS) on the ASX or learning how to read stock charts, here are objective support, resistance and technical invalidation levels built from the RSI, MACD and ATR indicators.
Bravura Solutions closed Friday at $3.12, 14.1% below the $3.63 52-week high of August 14 and 77.8% above the $1.75 low of February 6. The two-year panel frames the situation cleanly: a long base through the first half of 2026, a July 10 gap higher, then a near-vertical two-session thrust on August 12–13 that carried the close from $2.79 to $3.52 on turnover of 5,291,618 and 7,546,818 shares. Everything since has been the give-back. Price has now retraced 38.8% of the $2.38–$3.59 swing and sits fractionally under the 38.2% level at $3.13, directly on the shelf where SMA20 $3.08 and the top of the unfilled August 12 gap at $3.09 overlap. The working lens is a breakout in a deeper-than-first pullback with the trend framework still intact — Mansfield RS +25.93% versus the S&P/ASX 200, ADX 33.6, OBV in accumulation on both frames — against a fresh MACD dead cross dated August 25 and RS momentum that has slowed by 7.84 points in a week.
Snapshot as of August 28, 2026
| Item | Value | Reading |
|---|---|---|
| Close | $3.12 | −14.1% from 52w high, +77.8% above 52w low |
| 52-week range | $1.75 – $3.63 | Upper half of the yearly range; high set August 14, 2026, low February 6, 2026 |
| SMA 5 / 20 / 60 | $3.10 / $3.08 / $2.53 | Bullish alignment intact; close 0.5% above SMA5, 1.3% above SMA20, 23.4% above SMA60 |
| Bollinger (20) | $3.63 / $3.08 / $2.53 | Band width 35.77%; price sits 53.7% of the way up the band, just above the midline |
| aVWAP (2y anchor) | $2.46 (Aug 13, 2025) | Price is 27.0% above the two-year cost basis |
| aVWAP (90d anchor) | $2.91 (Jul 10, 2026) | Short-term cost basis 7.1% below price, inside the August 12 gap band |
| RSI(14) | 57.0 | Neutral-to-firm, unwound from the August high (2y frame 57.0); no divergence flagged |
| Mansfield RS (vs the S&P/ASX 200) | +25.93% | Outperforming; +19.97 points over a month, −7.84 points over the past week |
| MACD(12,26) | 0.155 / signal 0.197 | Dead cross dated August 25; histogram −0.043, still well above the zero line |
| ADX(14) | 33.6 | Strong directional trend (2y frame 33.3) — strength, not direction |
| ATR(14) | $0.141 (4.53%) | Wide daily range — the 2×ATR band spans 9.1% of price |
| OBV | 2y: above MA20, rising (+6.65%) · 90d: above MA20, rising (+24.77%) | Accumulation on both frames; bullish divergence flagged on both |
| Volume (last session) | 1,365,388 vs 1,892,094 avg (0.72×) | Below average on an up close; every session of the past week ran under the 20-day average |
| Unfilled gaps | $2.85 – $3.09 · $2.08 – $2.25 · $1.66 – $1.77 | Three open on the two-year frame, all beneath price (Aug 12 2026, Jul 10 2026, Dec 4 2024) |
| 1×ATR / 2×ATR levels | $2.98 / $2.84 | 2×ATR = technical invalidation level (−9.1% from close) |
① Price & Moving Averages
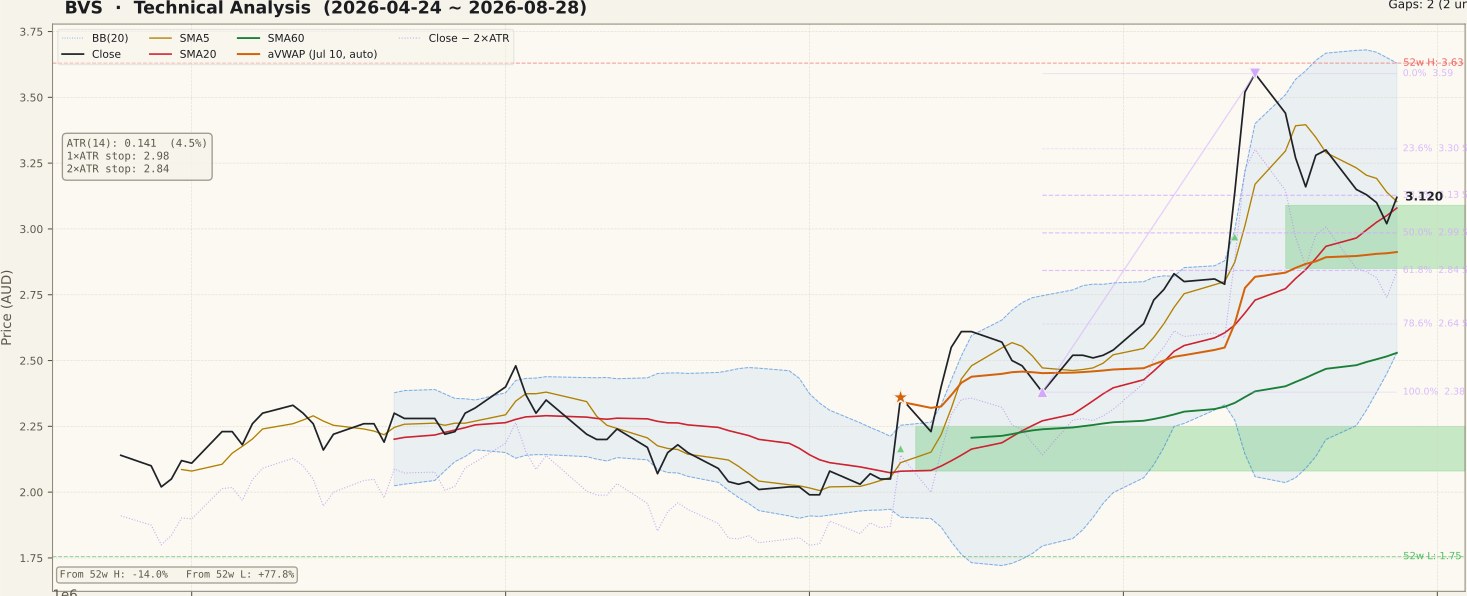
BVS_price-90d-2026-08-30.svgThe moving-average stack remains in bullish order — close $3.12 above SMA5 $3.10, above SMA20 $3.08, above SMA60 $2.53 — but the spacing has compressed sharply at the short end. The close is 1.3% above SMA20 and only 0.5% above SMA5, with those two averages themselves 0.8% apart, while SMA60 remains 23.4% below. That is what a pullback looks like when it works through price rather than through time: the fast averages come to meet it while the slow one stays where it was.
The retracement grid is anchored to the July 24 low at $2.38 and the August 14 high at $3.59, a swing of 50.8%. Price has given back 38.8% of it, which places Friday's close just under the 38.2% level at $3.13 — so that level now sits immediately overhead rather than beneath. What makes the current zone structural is the overlap: SMA20 and the Bollinger midline at $3.08, the top of the unfilled August 12 gap at $3.09, and the 38.2% level at $3.13 all fall within 1.6% of each other. Below that shelf the chart thins out quickly: the 50% level at $2.99 sits inside the gap band, and the 61.8% level at $2.84 lands on the same price as the 2×ATR reference.
Bollinger structure has begun to normalise — width 35.77% against an upper band at $3.63, a midline at $3.08 and a lower band at $2.53 — and price at 53.7% of the way up the band is close to neutral. On the two-year frame the only prior visit to this price zone was the October 2025 spike, whose high was $3.51, so overhead structure above $3.63 is thin. A separate detail belongs on the record: the August 24 session traded ex-dividend for $0.15, which accounts for most of that day's 4.6% decline on 0.50× average volume.
② Volume

BVS_volume-90d-2026-08-30.svgThe 90-day panel is dominated by the two sessions of August 12–13, at 5,291,618 and 7,546,818 shares — roughly 2.8× and 4.0× the current 20-day average of 1,892,094. Those two bars built the whole structure and they are also why the 20-day average is elevated today.
The more useful observation is the character of the decline since. Every session of the past week traded below the 20-day average — 0.50×, 0.54×, 0.64× and 0.54× through the four down closes, and 0.72× on Friday's +3.3% recovery. Distribution after a thrust normally announces itself with heavy turnover on the way down, and the panel does not show that. The mirror-image caveat matters just as much: Friday's rebound came on turnover well under average too, so it is a low-participation bounce, not a confirmed one. A common beginner error here is to treat any green candle off a shelf as validation; on this chart, volume has confirmed neither side since August 14.
③ MACD

BVS_macd-90d-2026-08-30.svgMACD reads 0.155 against a signal line of 0.197, with the histogram negative at −0.043. The July golden cross that carried this leg is gone: the JSON dates the most recent cross as a dead cross on August 25, three sessions before the basis date. That is the first genuine momentum break since the base low, and it is the single most important change on this chart versus a week ago.
Context tempers it in one specific way. Both lines remain a long way above zero, so what has happened is a loss of upward acceleration inside a trend rather than a trend reversal signal — a dead cross well above the zero line during a retracement is a common and often temporary configuration. The honest counterpoint is that it is early: the cross is three sessions old and the histogram is still widening negatively. A return of the histogram toward zero would say the pullback is maturing; further expansion beneath the signal line would say the opposite.
④ RSI

BVS_rsi-90d-2026-08-30.svgRSI(14) at 57.0 on both frames is neutral-to-firm and fully unwound from the overbought readings around the August high. Momentum has normalised without RSI ever losing the 50 line — a constructive detail in a pullback, because a break beneath 50 is usually where a retracement starts to behave like a trend change.
No RSI divergence is flagged on either frame and the peak fields are null, so there is no specific pair of highs to point at. That absence is worth stating plainly rather than reading as an endorsement of either case. It is also worth noting that RSI and OBV disagree this week: OBV carries a flagged bullish divergence while RSI carries none. Treating one oscillator's silence as agreement with the other is a frequent misreading, and the two are recorded separately here for that reason.
⑤ Mansfield RS vs the S&P/ASX 200

BVS_rs-90d-2026-08-30.svgMansfield RS sits at +25.93% versus the S&P/ASX 200, firmly in outperformance territory and among the higher readings on the two-year panel. A month ago the reading was +5.96, so the monthly change of +19.97 points is a leadership shift of real size, and the 90-day panel shows the zero-line crossing that produced it in mid-July.
The weekly arithmetic runs the other way: a week ago RS stood at +33.77, so the seven-day change is −7.84 points. In positive territory a negative change is deceleration, not deterioration — the stock is still outperforming the index by a wide margin — but this is now the second consecutive week of give-back, and the panel's slope tag reads rising because the month dominates the window it measures. The distinction that matters over the next fortnight is between RS easing while comfortably above zero and RS retracing toward it. A common error is to read the still-high absolute number as confirmation while ignoring that the slope has turned.
⑥ ATR & ADX

BVS_atr_adx-90d-2026-08-30.svgATR(14) at $0.141 is 4.53% of price, still elevated by the mid-August expansion. Volatility of that order has a direct consequence for the level structure: the 2×ATR technical invalidation level sits at $2.84, 9.1% below the close, and the 1×ATR reference at $2.98 is inside the range of two ordinary sessions. Any objective invalidation line on this chart has to be placed wide, and position sizing has to account for that rather than the other way round.
ADX at 33.6 on the 90-day frame (33.3 on the two-year frame) still reads as a strong directional trend, and the reading is unchanged in character from a week ago. ADX measures strength without direction, so a high reading during a retracement describes the vigour of the preceding advance rather than promising its continuation — and if the pullback extends, this same number would describe the vigour of the decline. Median daily turnover clears the screen's A$2M floor, so the volume-derived readings here are reasonably reliable, though spreads and slippage remain a practical consideration in an ASX mid cap of this size.
⑦ OBV

BVS_obv-90d-2026-08-30.svgBoth frames agree on state: OBV is tagged accumulation, above its 20-day average and rising, with the spread to that average at +6.65% on the two-year frame and +24.77% on the 90-day frame. That spread figure is a measure of accumulation intensity against OBV's own average — it is not a divergence reading, and the two are separate fields.
The divergence field itself is flagged bullish on both frames, and the recorded peaks are specific. On the 90-day frame the first peak is August 19 at price $3.16 with OBV 12,905,361; the second is August 27 at price $3.02 with OBV 16,844,990. Price made the lower low — 4.4% beneath the first — while OBV made a higher low, 30.5% above it; the two-year frame records the same pair of dates with a 7.5% OBV gain. That is a textbook regular bullish divergence: the decline into August 27 was not carried by volume. The discipline here is that a divergence is a possibility of reversal, not a confirmed low. Declaring the bottom before price reclaims a level is one of the most expensive habits in chart reading, and on this chart the reclaim in question is the $3.09–$3.13 shelf.
Bull vs Bear
Bull Case
- Mansfield RS +25.93% vs the S&P/ASX 200 — +19.97 points over a month, off a mid-July zero-line crossing.
- Bullish alignment intact: close $3.12 > SMA5 $3.10 > SMA20 $3.08 > SMA60 $2.53, with the close still above the 20-day average.
- OBV bullish divergence flagged on both frames — price $3.16 → $3.02 while OBV rose 30.5% on the 90-day frame (Aug 19 to Aug 27).
- The entire four-session decline ran on 0.50–0.64× average volume; no heavy-turnover distribution appears in the panel.
- RSI unwound to 57.0 without losing the 50 line, and ADX 33.6 says the preceding advance was strongly directional.
- Above $3.63 the two-year chart holds almost no overhead structure — the October 2025 spike high of $3.51 is the only prior visit to this zone.
Bear Case
- MACD dead cross dated August 25 — the first momentum break of this leg, with the histogram at −0.043 and still expanding.
- RS weekly change −7.84 points, from +33.77 to +25.93 — a second consecutive week of give-back.
- The retracement is now 38.8% of the $2.38–$3.59 swing, past the 38.2% level rather than in front of it.
- ATR 4.53% of price puts the 2×ATR technical invalidation level 9.1% below the close — an unusually wide objective band.
- An unfilled gap at $2.85–$3.09 sits immediately beneath the close, and a second at $2.08–$2.25 remains open from July 10 — both are structural magnets.
- The structure was built in two sessions; between $3.09 and $2.85 the chart has no traded price history to lean on.
Scenarios
| Scenario | Probability | Path | Trigger / Invalidation |
|---|---|---|---|
| Shelf holds, pullback ends | 40% | The $3.08–$3.13 cluster — SMA20, the Bollinger midline, the top of the August 12 gap and the 38.2% retracement — contains the decline, and the flagged OBV bullish divergence resolves upward. The MACD histogram narrows back toward the signal line, and price works up through the 23.6% level at $3.30 toward the $3.59 August closing high with RS still well above zero. | Daily closes above $3.13 on turnover at or above the 20-day average support this framing; a daily close inside the $2.85–$3.09 gap argues for the second path. |
| Retracement into the gap | 35% | The shelf gives way and price trades into the unfilled $2.85–$3.09 band, where the 50% retracement at $2.99 and the 1×ATR reference at $2.98 also sit. Filling a gap of that age is ordinary behaviour and would not by itself end the July–August structure, which stays intact above the 61.8% level at $2.84. Mansfield RS eases further while staying positive. | A daily close below $3.08 opens this path; sustained closes back above $3.13 close it. |
| Breakout structure unwinds | 25% | Price closes beneath the $2.84 technical invalidation level, where the 61.8% retracement coincides, and continues through the 90-day anchored VWAP at $2.91 toward the 78.6% level at $2.64. Mansfield RS retraces toward zero, RSI loses the 50 line, and the July 10 gap at $2.08–$2.25 becomes the next open structure beneath. | A daily close below $2.84 triggers this reading; a close back above $3.13 negates it. |
Key Levels & Volatility References
| Price | Role | Basis |
|---|---|---|
| $3.63 | Resistance | 52-week high (August 14, 2026) and upper Bollinger band (20, 2σ) — band width 35.77% |
| $3.59 | Resistance | August 14, 2026 closing high — 0% of the current swing |
| $3.30 | Resistance | 23.6% retracement of the $2.38–$3.59 swing (Jul 24 – Aug 14) |
| $3.13 | Resistance | 38.2% retracement — 0.3% above the close, so it now sits overhead |
| $3.12 | Current | Close, August 28, 2026 — SMA5 at $3.10 just beneath |
| $2.85 – $3.09 | Support | Unfilled gap from August 12, 2026; SMA20 and the Bollinger midline at $3.08 sit on its top edge, and the 50% retracement at $2.99 falls inside it |
| $2.84 | Invalidation | 2×ATR technical invalidation level (−9.1% from close); the 61.8% retracement at $2.84 coincides, and the 1×ATR reference is $2.98 |
What to Watch
- The $3.08–$3.13 cluster. Four references — SMA20, the Bollinger midline, the top of the August 12 gap and the 38.2% retracement — sit within 1.6% of each other, and price is inside the band. Daily closes above $3.13 restore the orderly-pullback reading; a close inside the gap band says the thrust is being retraced.
- Whether the OBV divergence gets price confirmation. The August 19 to August 27 pair (price $3.16 → $3.02, OBV +30.5%) is a textbook bullish divergence, but divergences resolve only with a price reclaim. Friday's +3.3% came on 0.72× average volume, which is a start and not a confirmation.
- The age and depth of the MACD dead cross. Dated August 25 with the histogram at −0.043, it is three sessions old. A histogram that narrows back toward zero says the pullback is maturing; continued expansion beneath the signal line says the momentum break is real.
- The slope of Mansfield RS, not its level. Two consecutive weeks of give-back have taken the reading from +33.77 to +25.93. A third week of that scale would matter far more than the still-strong +25.93% absolute number.
- Volume on any move either way. Nothing since August 14 has traded at even 1.2× the 20-day average. Whichever side of the $3.08–$3.13 shelf resolves first, doing it on below-average turnover makes the resolution materially less reliable.