Bravura Solutions Limited
This analysis is based on closing-price data as of August 14, 2026. Whether you're researching Bravura Solutions Limited (BVS) on the ASX or learning how to read stock charts, here are objective support, resistance and technical invalidation levels built from the RSI, MACD and ATR indicators.
Bravura Solutions closed Friday at $3.59, only 1.1% below a 52-week high of $3.63 and 104.6% above the $1.75 low set earlier in the year. The two-year panel frames what happened: a long, flat base through the first half of 2026 ended with a gap higher on July 10, and the advance then went near-vertical in the final week, leaving price 50.8% above the July 24 swing low at $2.38 and clearing the October–November 2025 spike that had been the only prior visit to this price zone in the whole two-year window. The confirming evidence is genuine — Mansfield RS +44.7% versus the S&P/ASX 200 after six months below zero, ADX 45.2, a MACD golden cross from July 7 with the histogram still expanding, and OBV in accumulation on both frames. So is the extension: RSI(14) at 86.8, a close trading outside the upper Bollinger band at $3.40 with band width already 49.1%, and price sitting roughly 31.5% above its own 20-day average. The working lens is a base breakout in its most stretched possible state — the trend evidence is unusually strong and the chart offers almost nothing between here and the August 12 gap if it unwinds.
Snapshot as of August 14, 2026
| Item | Value | Reading |
|---|---|---|
| Close | $3.59 | −1.1% from 52w high, +104.6% above 52w low |
| 52-week range | $1.75 – $3.63 | Closing at the very top of the yearly range |
| SMA 5 / 20 / 60 | $3.17 / $2.73 / $2.38 | Full bullish alignment; close sits 31.5% above SMA20 and 50.7% above SMA60 |
| Bollinger (20) | $3.40 / $2.73 / $2.06 | Band width 49.1% — very wide; the close is above the upper band |
| aVWAP (2y anchor) | $2.43 (Aug 13, 2025) | Price is 47.5% above the two-year cost basis |
| aVWAP (90d anchor) | $2.82 (Jul 10, 2026) | Short-term cost basis sits inside the August 12 gap band |
| RSI(14) | 86.8 | Deeply overbought (2y frame 86.7); no divergence flagged |
| Mansfield RS (vs the S&P/ASX 200) | +44.7% | Outperforming and accelerating (prior week +12.8, prior month +11.7) |
| MACD(12,26) | 0.257 / signal 0.170 | Golden cross printed July 7; histogram +0.087 and widening |
| ADX(14) | 45.2 | Strong directional trend (2y frame 44.8) |
| ATR(14) | $0.144 (4.02%) | Wide daily range — volatility has roughly doubled since June |
| OBV | 2y: above MA20, rising (+37.1%) · 90d: above MA20, rising (+232.4%) | Accumulation on both frames; the 90-day spread is extreme |
| Volume (last session) | 2,392,150 vs 1,764,971 avg (1.36×) | Above average, but well below the two spike sessions that preceded it |
| 1×ATR / 2×ATR levels | $3.45 / $3.30 | 2×ATR = technical invalidation level (−8.0% from close) |
① Price & Moving Averages
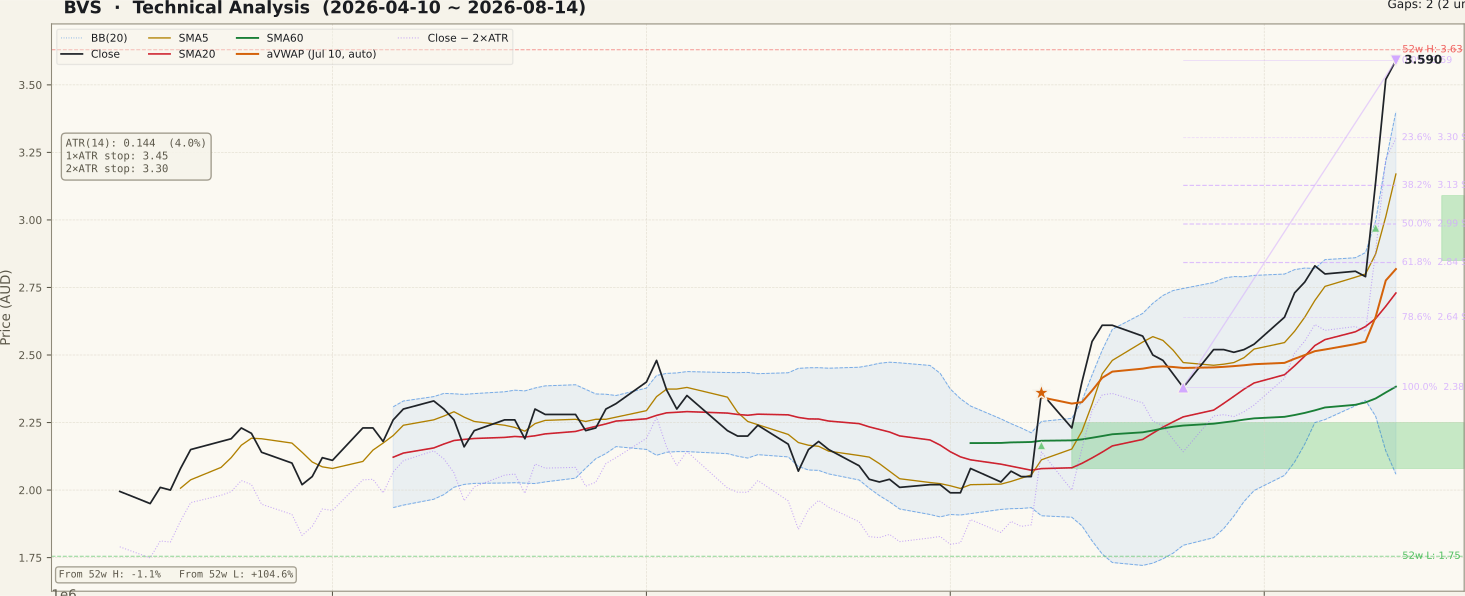
BVS_price-90d-2026-08-16.svgThe moving-average stack is in textbook order — close $3.59 above SMA5 $3.17, above SMA20 $2.73, above SMA60 $2.38, all three rising — but the spacing is the point rather than the order. A close 31.5% above its own 20-day average and 50.7% above the 60-day is not a normal trending condition; it is what a near-vertical move looks like before anything has come back to the mean. The 90-day panel shows the sequence clearly: a drift between roughly $1.95 and $2.48 from April to June, a slide into early July, the July 10 gap that anchors the short-term aVWAP at $2.82, a first leg to the mid-July high, a pullback to the $2.38 low on July 24, then a steady August climb that turned into a three-session thrust straight through the top of the chart. On the two-year frame that thrust has cleared the October–November 2025 spike zone, so there is no remaining overhead structure inside the window above $3.63. The Bollinger reading underlines the extension rather than the strength: width is 49.1% and the close is outside the upper band at $3.40, which is a late-expansion condition, not an early one. Beneath price, the structure thins out fast — the first real shelf is the unfilled $2.85–$3.09 gap from August 12.
② Volume

BVS_volume-90d-2026-08-16.svgParticipation confirmed the move, and emphatically so. The 90-day panel flags two consecutive spike sessions — bars at or above twice the 20-day average — on August 12 and August 13, the two days that produced the gap and the vertical leg; before that, the only comparable spikes in the window sit at the July 10 gap and in mid-July, at the start of the advance. The final session then traded 2,392,150 shares against a 20-day average of 1,764,971, a ratio of 1.36× — still above-average, but a clear step down from the two spike days. That pattern is worth naming honestly: a thrust on spike volume followed by a lighter, higher close is the classic shape of both a genuine institutional repricing and an exhaustion move, and volume alone does not separate them. Turnover of roughly A$8.6m in the last session means liquidity is adequate for a stock of this size, so spread and slippage are secondary concerns here — the open question is what caused the burst, not whether it was tradable.
③ MACD

BVS_macd-90d-2026-08-16.svgMACD reads 0.257 against a signal line of 0.170, with the histogram positive at +0.087 and visibly widening into the final bars. The golden cross itself is old news — it printed on July 7, right at the base low, which is the constructive version of this signal: a cross that occurs near the zero line at the start of a move rather than far above it. What has changed since is altitude. On the two-year panel the current MACD value is at the top of the entire window, matching the October 2025 peak that preceded a multi-month decline, and readings this far above zero describe momentum that is already fully expressed rather than momentum that is building. The histogram is the honest short-term tell: while it keeps expanding the thrust is intact, and the first contraction from this altitude would be the earliest mechanical sign that the August leg has run its course.
④ RSI

BVS_rsi-90d-2026-08-16.svgRSI(14) at 86.8 on the 90-day frame (86.7 on the two-year frame) is at the top of the indicator's practical range, and the two-year panel puts that in context: only two other moments in twenty-four months — December 2024 and October 2025 — pushed RSI this deep into the overbought zone. Both deserve a careful reading rather than a reflex, because they resolved differently. December 2024 was the start of a durable step higher; October 2025 marked a peak that unwound for months. That is the honest state of the evidence — an extreme reading is a statement about speed, not about direction, and strong trends routinely stay overbought for weeks. Two details matter more than the headline number. First, the panel shows RSI only crossed above 70 in the final sessions, so this is a fresh spike rather than a stretched, multi-week condition. Second, no divergence is flagged on either timeframe: momentum made its high with price, so the classic early-warning pattern of a lower momentum peak against a higher price peak is simply absent here. The risk this reading describes is not a forecast of reversal; it is that the margin for error is thinnest exactly at the highest price of the year.
⑤ Mansfield RS vs the S&P/ASX 200

BVS_rs-90d-2026-08-16.svgMansfield RS reads +44.7% versus the S&P/ASX 200, and both frames agree on the figure as they must, since the measure is anchor-free. The rate of change is dramatic: RS stood at +12.8 a week ago and +11.7 a month ago, giving a weekly change of +31.8 points against a monthly change of +33.0. Positive and accelerating is the strongest of the four relative-strength quadrants, but note what those two numbers say together — essentially the entire month's relative gain arrived in the last five sessions. The two-year panel adds the structural context that matters most: RS spent from January to July 2026 below zero, crossed into positive territory in July, and has gone near-vertical since, so this is a genuine leadership change rather than an extension of an existing one. The caveat is symmetrical with the rest of the page — an RS line this steep is a description of a vertical price move, and it flattens the moment that move pauses. RS stalling while price still prints marginal new highs would be the first sign the leadership is fading.
⑥ ATR & ADX

BVS_atr_adx-90d-2026-08-16.svgATR(14) is $0.144, or 4.02% of price, and the panel shows it spiking almost vertically in the last three sessions — daily ranges have roughly doubled from the quiet June condition. ADX at 45.2 on the 90-day frame (44.8 on the two-year frame) is well above the 25 threshold and still climbing, which says the directional move is powerful and orderly. Remember that ADX measures strength, not direction: a high reading describes persistence, it does not promise continuation. The volatility references need care in this case. The 1×ATR level sits at $3.45 (−4.0% from the close) and the 2×ATR technical invalidation level at $3.30 (−8.0%). Because ATR is measured over fourteen sessions that still include the quiet pre-breakout base, that band is arguably tight relative to how the stock is actually moving now — the last three sessions each covered ground of that order on their own, so an entirely ordinary consolidation could carry price through the volatility line without the structural picture changing at all.
⑦ OBV

BVS_obv-90d-2026-08-16.svgOBV is in an accumulation state on both timeframes, which is the strongest counterweight to the extension argument. The two-year frame reads 62,038,625 against a 20-day average of 45,240,762 — a +37.1% spread, rising — and it has pushed to a new two-year high alongside price rather than lagging it, so volume flow is confirming the breakout rather than contradicting it. The 90-day frame shows 24,025,605 against 7,227,742, a +232.4% spread, and that number needs a mechanical caveat rather than applause: OBV is a running total, so two spike-volume up sessions inside a short window drag it away from its own average almost by construction. Read the direction and the agreement between frames, not the magnitude of the 90-day spread. A loss of the 20-day average on a down session would remove the main piece of evidence supporting the move on this page.
Bull Case
- Mansfield RS +44.7% vs the S&P/ASX 200 after six months below zero — a genuine leadership change, +31.8 points in a week.
- Full bullish alignment: close $3.59 > SMA5 $3.17 > SMA20 $2.73 > SMA60 $2.38, all three rising.
- Base breakout clears the October–November 2025 spike zone — no overhead chart structure remains in the two-year window above $3.63.
- The thrust came on two consecutive spike-volume sessions (August 12 and 13), leaving an unfilled $2.85–$3.09 gap as first structure beneath price.
- OBV in accumulation on both frames, above its 20-day average and rising, making new highs with price rather than lagging.
- MACD golden cross printed July 7 near the zero line — an early-stage cross — with the histogram at +0.087 and still widening; ADX 45.2 and climbing.
Bear Case
- RSI(14) at 86.8 — one of only three readings this extreme in two years, and the October 2025 instance marked a multi-month peak.
- Extension is severe: the close sits 31.5% above SMA20 and 50.7% above SMA60, with +50.8% added since the July 24 low.
- The close is outside the upper Bollinger band at $3.40 with width already 49.1% — a late-expansion reading.
- A three-session vertical move with no confirmed catalyst on the chart; ASX small and mid caps can reverse just as fast when the news is digested.
- The $3.30 2×ATR technical invalidation level is only 8.0% below the close and sits far above the August 12 gap, so an ordinary give-back would breach it.
- Almost no structure between $3.30 and the $3.09 gap top — the first genuine shelf is roughly 14% below the close.
Scenarios
| Scenario | Probability | Path | Trigger / Invalidation |
|---|---|---|---|
| Digestion — sideways consolidation above the gap | 40% | RSI unwinds from 86.8 through time rather than price. Price ranges between the 52-week high and the 23.6%–38.2% retracement band at $3.30–$3.13 while the rising SMA5 at $3.17 catches up, leaving the August 12 gap unfilled and RS and OBV positive. | Daily closes above $3.13 keep this framing; a close inside the $2.85–$3.09 gap says the August leg is being retraced instead. |
| Mean reversion toward the gap | 35% | The vertical leg gives back ground, price loses the 38.2% retracement at $3.13 and reverts toward the unfilled $2.85–$3.09 gap, where the 50% retracement at $2.99, the 61.8% at $2.84 and the 90-day aVWAP at $2.82 cluster. The larger base breakout stays intact so long as the July–August shelf near $2.73 (SMA20 and Bollinger mid) is not lost. | A daily close below the $3.30 2×ATR technical invalidation level opens this path; a close back under $2.73 would negate the breakout structure entirely. |
| Continuation — band walk into open space | 25% | Price stays outside the upper Bollinger band and clears the $3.63 52-week high into a zone with no two-year overhead structure, with ADX and the MACD histogram still expanding. | Daily closes above $3.63 with turnover holding above the 20-day average; the case weakens on repeated rejections at the high paired with a contracting histogram. |
Key Levels & Volatility References
| Price | Role | Basis |
|---|---|---|
| $3.63 | Resistance | 52-week high, reached in the August 14, 2026 session |
| $3.59 | Current | Close, August 14, 2026 — 0% of the July 24 – August 14 swing |
| $3.45 | Volatility reference | 1×ATR below the close (−4.0%) |
| $3.40 | Reference | Upper Bollinger band (20, 2σ) — the close is above it |
| $3.30 | Invalidation | 2×ATR technical invalidation level (−8.0% from close); coincides with the 23.6% retracement at $3.30 |
| $3.13 | Support | 38.2% retracement of the $2.38–$3.59 swing |
| $2.85 – $3.09 | Support | Unfilled gap from August 12, 2026; the 50% retracement at $2.99 sits inside it |
What to Watch
- The catalyst behind the August 12 gap. A three-session move of this size is not a chart event — it is a news event that the chart is recording. Confirming what the announcement was, and what it changes, comes before any technical reading is useful.
- The $2.85–$3.09 gap. It is the first real structure beneath price and it sits roughly 14% below the close. Daily closes above $3.13 keep the breakout reading clean; a close inside the gap band says the thrust is unwinding.
- Follow-through volume. Turnover stepped down to 1.36× on the final session after two spike days. Above-average participation on a push through $3.63 would settle the conviction question; a fade to below-average volume while price stalls would argue the other way.
- How RSI resolves. An unwind from 86.8 through sideways time is trend-friendly; an unwind through price is not. With no divergence flagged, the tape itself is the only tell available.
- The slope of Mansfield RS. A weekly change of +31.8 points is acceleration off a July zero-line crossing. RS flattening while price still makes marginal new highs would be the earliest evidence the leadership move is maturing.