Benz Mining Corp.
$3.95 −9.0% from the 52-week high of $4.34 · +216.0% from the 52-week low of $1.25
This analysis is based on closing-price data as of September 11, 2026. Whether you're researching Benz Mining Corp. (BNZ) on the ASX or learning how to read stock charts, here are objective support, resistance and technical invalidation levels built from the RSI, MACD and ATR indicators.
Across the two-year window BNZ has moved from roughly A$0.12 in late 2024 to a 52-week high of $4.34, and the September 11 close of $3.95 sits 9.0% under that high with the 5-, 20- and 60-day averages still stacked in ascending order ($4.08 / $3.96 / $3.31). What the 90-day panel shows is a pullback inside that structure rather than a break of it: price has slipped under the 5-day line and is sitting fractionally beneath the 20-day line, while ADX at 38.8 still reads as a strong trend and Mansfield RS holds at +69.96% against the S&P/ASX 200. The cautionary detail is momentum — RSI carries a flagged bearish divergence, and the largest advance in this window (September 7, +8.16%) arrived without volume confirmation and without a cause identifiable in publicly available information.
Snapshot as of September 11, 2026
| Metric | Value |
|---|---|
| Close (Sep 11, 2026) | $3.95 |
| 52-week high / low | $4.34 / $1.25 (−9.0% / +216.0%) |
| SMA 5 / 20 / 60 | $4.08 / $3.96 / $3.31 — ascending order intact |
| Bollinger (20, 2) | upper $4.34 · mid $3.96 · lower $3.57 · width 19.58% |
| aVWAP — 2y (anchor Nov 6, 2024) | $1.85 — price above |
| aVWAP — 90d (anchor Jun 24, 2026) | $3.28 — price above |
| RSI(14) | 53.4 — bearish divergence flagged |
| Mansfield RS vs S&P/ASX 200 | +69.96% — outperform, slope falling (prev week 63.92 · prev month 70.31) |
| MACD (12, 26, 9) | MACD 0.1354 · signal 0.1615 · histogram −0.0261 · last cross: dead, Aug 14, 2026 |
| ADX(14) | 38.8 — strong |
| ATR(14) | $0.2551 (6.46% of price) |
| OBV — 2y | early accumulation · above MA20 · flat (+2.40% vs its MA20) |
| OBV — 90d | early accumulation · above MA20 · flat (+14.94% vs its MA20) |
| Volume (Sep 11) | 751,203 vs 20-day average 1,029,190 (0.73×) |
| 1× / 2× ATR technical invalidation | $3.70 / $3.44 |
① Price & Moving Averages
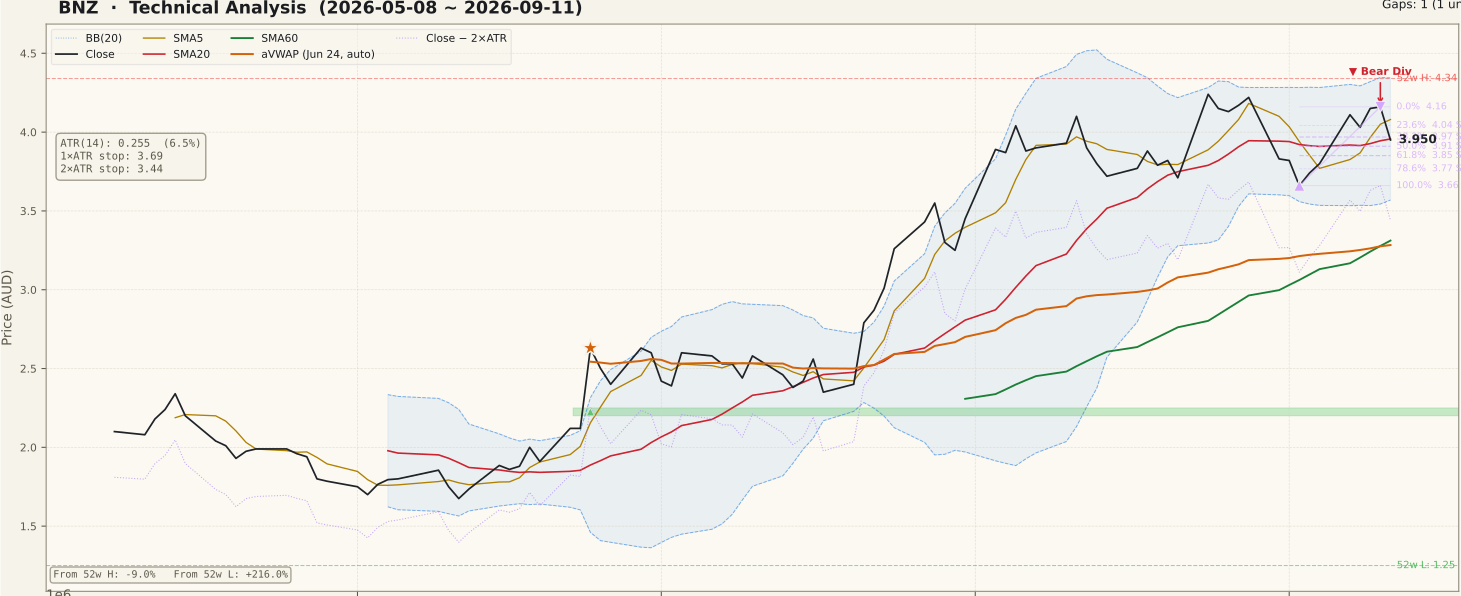
The moving-average stack is still in ascending order — SMA5 $4.08 above SMA20 $3.96 above SMA60 $3.31 — and that is the structural reason this reads as a pullback rather than a breakdown. The distance between the 20-day and the 60-day line is the tell for how mature the advance is: the 60-day average still sits well under the 20-day, which is what a trend that has been running for months looks like, not one assembled in the past fortnight. Price itself has lost the 5-day line and closed at $3.95, roughly 0.2% below the 20-day line, so the shorter averages are now overhead as resistance while the 60-day remains far beneath.
Bollinger geometry frames the same picture: upper band $4.34, midline $3.96, lower band $3.57, with band width at 19.58% — wide, consistent with the volatility of the August–September run rather than with compression. The close is effectively on the midline, the neutral point of the band. Price also remains above both anchored VWAPs ($1.85 from the November 6, 2024 anchor on the two-year view, $3.28 from the June 24, 2026 anchor on the 90-day view), meaning buyers from both of those reference points are collectively in profit, which historically reduces the supply of stock that has to be liquidated on a dip.
Two sessions define the near-term shape. On September 7 the close rose +8.16%, from $3.80 to $4.11; on September 11 the close gave back −5.05% from $4.16 to $3.95. That is the retracement the 90-day Fibonacci grid measures, anchored on the September 2 low ($3.66) and the September 10 high ($4.16): the close sits between the 38.2% level at $3.97 and the 50% level at $3.91.
② Volume

The last session traded 751,203 shares against a 20-day average of 1,029,190, a ratio of 0.73×. Read plainly, the give-back happened on lighter-than-normal turnover, which is the less damaging version of a down day — distribution normally announces itself with volume above average, not below it.
The more important volume observation belongs to the advance, not the decline. The September 7 move of +8.16% traded at only about 1.20× the 20-day average. A price move of that size on barely-above-average participation is the textbook case of an unconfirmed move: the classic beginner error is to treat the percentage as the signal and ignore that the volume did not corroborate it. Where a real change of hands is occurring, the volume bar usually tells you so.
One structural caveat applies to any ASX company of this size: turnover is thin enough that single-day volume readings are noisy, OBV and volume ratios carry less statistical weight than they would in a large cap, and spreads and slippage widen quickly when the tape gets busy. For a resource name, headline sensitivity to drilling and resource-update announcements compounds that.
③ MACD

MACD reads 0.1354 against a signal line of 0.1615, so the histogram is negative at −0.0261 and the last crossover was a dead cross dated August 14, 2026. Momentum has been decelerating for about a month, and nothing in the past week has reversed that.
Context matters for how bearish that is. Both lines remain comfortably above zero, which places this weakening inside an uptrend rather than at the start of a downtrend — a dead cross above the zero line is a loss of acceleration, whereas the same cross far below zero would be a different animal. The signal to follow now is the histogram: it has been negative since mid-August, and a narrowing back toward zero would be the first mechanical evidence that the pullback is maturing.
④ RSI

RSI(14) sits at 53.4 — neither overbought nor oversold, having cooled from the overbought readings of early August. The notable feature is the flagged regular bearish divergence. The two peaks the data identifies are August 5 (price $4.04, RSI 76.16) and September 10 (price $4.16, RSI 60.34): price made the higher high, the oscillator did not follow, and the gap between those two RSI readings is wide.
The disciplined reading of that is narrow. A divergence describes the possibility of exhaustion; it is not a confirmed top, and calling a top from a divergence alone is one of the most expensive habits a newer chart reader can form — divergences persist for weeks in strong trends and are frequently cancelled by a fresh momentum high. What would cancel this one is straightforward: RSI pushing back above its September 10 reading while price holds its recent structure. What would corroborate it is RSI losing 50 while price loses the $3.91 and $3.66 levels.
The OBV panel does not carry a divergence flag on either timeframe, so the two oscillators disagree at present. That disagreement is worth stating plainly rather than smoothing over: momentum is diverging, volume-flow is not.
⑤ Mansfield Relative Strength

Mansfield RS measured against the S&P/ASX 200 reads +69.96% — deep in outperformance territory and identical on the two-year and 90-day files, as an anchor-free measure should be. The state is classified as outperform with a falling slope.
The two horizons give different messages, and both are worth carrying. Against the prior week (63.92) the reading has risen by 6.03 points: in positive territory, a rising reading is accelerating outperformance. Against the prior month (70.31) it is 0.35 points lower: on that horizon outperformance is slowing, though only marginally. So the stock is still beating the index by a wide margin, the weekly trajectory has improved, and the monthly trajectory has flattened.
A frequent misreading here is to treat any falling slope as underperformance. At +69.96% the line is nowhere near the zero boundary that separates outperformance from lagging the index; a deceleration this shallow, this far above zero, changes the pace of the advantage, not its direction.
⑥ ATR & ADX

ATR(14) is $0.2551, or 6.46% of the closing price. That is a wide daily range — a typical session moves more than six percent of the share price — and it should govern how any level on this page is interpreted. Levels a couple of percent apart are, on this instrument, inside a single day's noise.
ADX(14) at 38.8 is firmly above the 25 threshold that marks a strong trend. The standing caution applies: ADX measures trend strength, not direction, so a high reading is equally consistent with a strong decline. Here the moving-average order and the position relative to both anchored VWAPs identify the direction as up, and the ADX reading tells you the move has conviction behind it.
The objective volatility reference derived from ATR is the 2× ATR technical invalidation level at $3.44, 12.9% below the close; the 1× level sits at $3.70. Those are volatility measurements, not forecasts — they mark where the move would have travelled far enough that the constructive chart reading no longer holds.
⑦ OBV

Both timeframes classify OBV as early accumulation, above its 20-day moving average, with a flat slope. On the 90-day view OBV is 10,155,624 against an MA20 of 8,835,406.6 — a spread of 14.94%. On the two-year view it is 56,288,582 against 54,968,364.6, a spread of 2.40%. The agreement across both windows is the useful part: volume flow has not rolled over alongside price.
One clarification, because the field name invites confusion: that percentage is the distance between OBV and its own 20-day average — a measure of how stretched the flow is — and it is not a divergence reading. The dedicated divergence field is null on both timeframes, which means no OBV divergence has been identified, in contrast to the RSI panel.
A flat slope with the line above its average is a holding pattern rather than an endorsement: flow is not deteriorating, but it is also not expanding to confirm a resumption of the advance. Given how thin this stock's turnover is, OBV should be weighted lightly here in any case.
Bull Case vs Bear Case
Bull Case
- Moving averages remain in ascending order — SMA5 $4.08 > SMA20 $3.96 > SMA60 $3.31 — and the wide 20/60 separation marks a trend of some maturity.
- ADX(14) at 38.8 is well above the 25 strong-trend threshold.
- Mansfield RS +69.96% against the S&P/ASX 200, with the weekly reading up 6.03 points from 63.92.
- Price holds above both anchored VWAPs — $1.85 (2y) and $3.28 (90d).
- OBV is above its 20-day average on both timeframes (+2.40% and +14.94%), with no divergence flagged.
- The pullback is contained so far: the close is 1.0% above the 50% retracement at $3.91, well clear of the September 2 low at $3.66 and the lower band at $3.57.
Bear Case
- RSI carries a flagged bearish divergence: price higher high $4.04 → $4.16 against RSI lower high 76.16 → 60.34.
- MACD has been under its signal line since the August 14 dead cross, histogram −0.0261.
- The close has lost the 5-day line and sits fractionally under the 20-day line and the Bollinger midline.
- The September 11 session gave back −5.05%, undoing most of the September 7 advance within three sessions.
- The largest advance in the window (+8.16% on September 7) traded at only 1.20× average volume and has no cause identified in publicly available information.
- ATR at 6.46% of price plus thin ASX small-cap turnover means wide ranges, wide spreads and unreliable single-day readings.
Scenarios
| Scenario | Probability | Path | Trigger / Invalidation |
|---|---|---|---|
| Pullback contained inside the trend | 45% | Price stabilises between the 50% retracement $3.91 and the September 2 low $3.66, reclaims the 20-day line at $3.96 and then the 5-day line at $4.08, with the September 10 high $4.16 as the next structural hurdle. | Confirmed by a daily close back above $4.08 on turnover above the 20-day average of 1,029,190. Negated by a close under $3.66. |
| Divergence resolves lower | 35% | The RSI divergence plays out: $3.91 gives way, the September 2 low $3.66 fails, and price works toward the lower Bollinger band $3.57 and the 2× ATR invalidation level $3.44, where the 60-day line at $3.31 becomes the deeper reference. | Confirmed by a close under $3.66 with volume above average and RSI losing 50. Negated by a reclaim of $4.08. |
| Range between $3.66 and $4.16 | 20% | Neither side resolves; ADX drifts down from 38.8, Bollinger width narrows from 19.58%, and price oscillates around the $3.96 midline while the moving averages converge. | Recognised by ADX falling under 25 with contracting band width. Resolved by a close outside the $3.66–$4.16 boundaries. |
Key Levels & Volatility References
| Level | Role | Distance | Basis |
|---|---|---|---|
| $4.34 | Resistance | +9.9% | 52-week high and the upper Bollinger band, both at $4.34 |
| $4.16 | Resistance | +5.3% | September 10 swing high; the 0% anchor of the current 90-day retracement grid |
| $4.08 | Resistance | +3.3% | 5-day SMA — the first average price slipped beneath this week |
| $3.97 | Resistance | +0.5% | 38.2% retracement of the Sep 2 – Sep 10 swing; the 20-day SMA and Bollinger midline sit immediately beneath at $3.96 |
| $3.91 | Support | −1.0% | 50% retracement of the Sep 2 – Sep 10 swing |
| $3.66 | Support | −7.3% | 100% retracement — the September 2 swing low that anchors the grid |
| $3.44 | Invalidation | −12.9% | 2× ATR(14) technical invalidation level (ATR $0.2551); the 1× level sits at $3.70 |
What to Watch
- Whether the 50% retracement at $3.91 contains the pullback, and below it whether the September 2 low at $3.66 survives a retest.
- Volume against the 20-day average of 1,029,190. A move in either direction on sub-average turnover — as both recent large sessions were, to differing degrees — remains unconfirmed.
- RSI relative to its September 10 reading of 60.34 and to the 50 line: a push above the former would neutralise the divergence, a loss of the latter would corroborate it.
- The MACD histogram at −0.0261 narrowing back toward zero, which would be the first mechanical sign that the August 14 dead cross has run its course.
- Any company announcement that would account for the September 7 advance. As of this writing no such cause is identified in publicly available information, and that absence is itself a reason for caution.
Conclusion
Past Analyses of This Stock same ticker · newest first
Other signals from this issue same publication date · 6 stocks
SwingRoo · swingroo.com · S&P/ASX 300 screened weekly