Santos
This analysis is based on closing-price data as of September 11, 2026. Whether you're researching Santos (STO) on the ASX or learning how to read stock charts, here are objective support, resistance and technical invalidation levels built from the RSI, MACD and ATR indicators.
Santos finished the week at $8.59, just 1.0% under its 52-week high of $8.68 and at the top of a two-year range whose low was $5.90. The two-year chart shows why: after the September 2025 break and a long base through the December quarter, the stock reclaimed its 60-day average in early 2026 and has ground higher ever since, with Mansfield relative strength crossing above zero in February and reaching +19.23% against the S&P/ASX 200. The moving-average structure is in full bullish order on both timeframes and ADX reads 28.2 — a genuine trend rather than a drift.
The qualifier sits in the oscillators and the tape. Both the 2-year and 90-day files flag a bearish RSI divergence — price printed a higher high on 11 September while RSI printed lower than at the 20 August peak — and the week's advance arrived on volume fractionally below its 20-day average. That combination, a strong trend with an unconfirmed leading edge, is what the rest of this page measures.
Snapshot as of Sep 11, 2026 close
| Metric | Value | Reading |
|---|---|---|
| Close | $8.59 | Top of the two-year range |
| 52-week high / low | $8.68 / $5.90 | −1.0% from high · +45.6% from low |
| SMA 5 / 20 / 60 | $8.48 / $8.28 / $7.81 | Full bullish alignment (close > 5 > 20 > 60) |
| Bollinger (20, 2) | $8.62 / $8.28 / $7.94 | Width 8.12% — close riding just under the upper band |
| aVWAP — 2-year (anchor 2025-09-18) | $7.27 | Price well above the long anchor |
| aVWAP — 90-day (anchor 2026-06-15) | $7.77 | Price above the short anchor |
| RSI(14) — 2y / 90d | 69.44 / 69.49 | Bearish divergence flagged on both frames |
| Mansfield RS vs S&P/ASX 200 | +19.23% | Outperform, rising (prev week 11.83 · prev month 7.73) |
| MACD(12,26,9) | 0.1600 / 0.1385 / +0.0215 | Golden cross 2026-09-08, histogram above zero |
| ADX(14) — 2y / 90d | 28.16 / 28.69 | Strong trend (strength, not direction) |
| ATR(14) | $0.172 (2.00%) | Moderate daily range for a large-cap energy name |
| OBV — 2-year | Early accumulation | Above its MA20 (+8.71%), slope flat |
| OBV — 90-day | Accumulation | Above its MA20 (+44.51%), slope rising |
| Volume | 10,261,785 vs 20d avg 10,387,629 | Vol/Avg 0.99× — advance not volume-confirmed |
| 1× / 2× ATR technical invalidation | $8.42 / $8.25 | 2× ATR sits 4.00% below the close |
| Unfilled gap (2-year) | $6.77 – $7.06 | Support gap dated 2026-03-02, far below current price |
① Price & Moving Averages
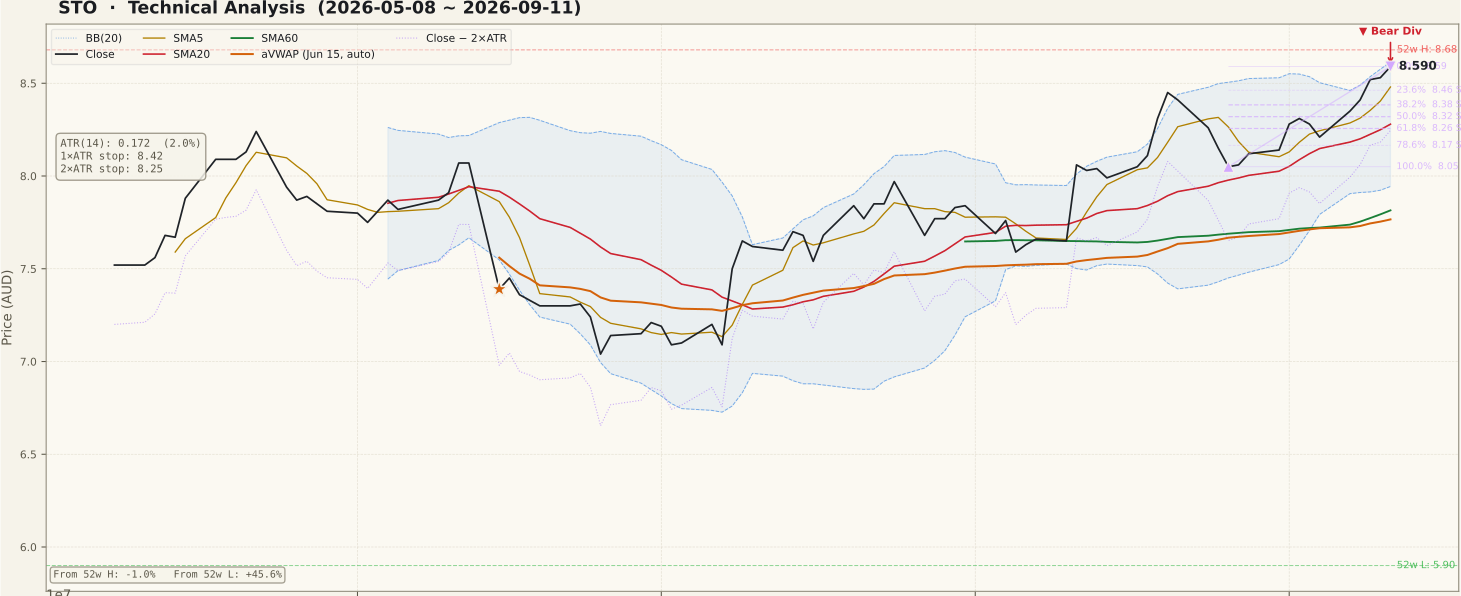
STO_price-90d-2026-09-13.svgThe alignment is textbook bullish: close $8.59 above SMA5 $8.48, above SMA20 $8.28, above SMA60 $7.81, with all three sloping up. On the two-year frame the 60-day average has been rising continuously since roughly March 2026, which is what separates this from a counter-trend bounce. The 90-day panel shows the July trough near the low $7s giving way to a stair-step advance through August and a firmer leg in September.
Overhead structure is tight and well defined. The Bollinger upper band sits at $8.62 and the 52-week high at $8.68 — only 1.0% above the close — so the next 1% of range is the part that decides whether this is a breakout or a stall. Band width of 8.12% is expanded rather than compressed, meaning the recent push has already consumed some of the volatility that normally fuels a fresh expansion.
Beneath price, the 90-day retracement grid anchored on the $8.05 low of 26 August and the $8.59 close of 11 September gives shelves at $8.46 (23.6%), $8.38 (38.2%), $8.32 (50%) and $8.26 (61.8%). Note that the deeper shelf clusters with SMA20 at $8.28 and with the 2× ATR invalidation level at $8.25 — three independent references landing within three cents of each other, which is what makes that band the structural line on this chart. Both anchored VWAPs ($7.27 from the September 2025 anchor, $7.77 from June 2026) sit far below, so there is no visible overhead supply shelf between price and the highs.
② Volume

STO_volume-90d-2026-09-13.svgThis is the weakest link in an otherwise clean structure. The most recent session traded 10,261,785 shares against a 20-day average of 10,387,629 — a Vol/Avg ratio of 0.99×. A move to the top of a two-year range on average-or-lighter participation is exactly the configuration that catches newer chart readers out: the price pattern says breakout, the tape says the move has not yet been confirmed by the people who would have to fund it.
Context matters, though. The 90-day panel shows no panic bars and no distribution spikes; the last five sessions into the close were a quiet, steady advance, each moving less than 2%, with turnover sitting near the 20-day average rather than collapsing. Liquidity is not a concern here — average daily volume above ten million shares places this well clear of the small-cap zone where volume and OBV readings degrade and spreads widen.
The practical reading is that the volume evidence is neutral, not negative. A push through $8.62–$8.68 on volume clearly above the 20-day average would convert a technical observation into a confirmed one; the same push on 0.9× volume would leave the divergence discussed below intact.
③ MACD

STO_macd-90d-2026-09-13.svgMACD registered a golden cross on 2026-09-08, three sessions before the reference close, with the MACD line at 0.1600 above its signal at 0.1385 and the histogram back into positive territory at +0.0215. The cross occurred well above the zero line, which marks it as a continuation signal inside an existing uptrend rather than an early-stage reversal off a base.
The 90-day panel shows the pattern that produced it: a dead cross in mid-August as the first September push faded, a shallow dip in the histogram that never carried the MACD line below zero, then the recovery into this cross. Momentum that pulls back to the zero line without breaching it is generally the healthier variety.
The caveat is that the histogram is small. At +0.0215 against a MACD value of 0.1600, the separation between the two lines is thin, so a couple of flat sessions would be enough to close the gap again. This is a fresh cross with modest thrust, not an accelerating one.
④ RSI

STO_rsi-90d-2026-09-13.svgRSI(14) reads 69.44 on the two-year frame and 69.49 on the 90-day frame — immediately under the conventional 70 overbought threshold. More importantly, both files flag a regular bearish divergence, and both identify the same two peaks: 2026-08-20 at $8.45 with RSI 72.36, and 2026-09-11 at $8.59 with RSI 69.49 (90-day values; the two-year file gives 72.21 and 69.44 for the same dates). Price made a higher high; momentum did not.
That is a real observation and it deserves to be stated plainly — but a divergence is a possibility of exhaustion, not a confirmation of a top. In a strong trend, RSI divergences resolve sideways as often as they resolve down, and they can persist for weeks while price continues higher; calling a top on a divergence alone, before any price-level failure, is one of the more expensive habits in chart reading. Confirmation would require price to lose structure, not merely momentum.
Two markers settle it either way. An RSI print back above the 20 August peak reading of roughly 72 would cancel the divergence outright. A slide below 50, in company with a close under the $8.25–$8.28 cluster, would confirm it. Between those two, the divergence stays open and unresolved.
⑤ Mansfield Relative Strength

STO_rs-90d-2026-09-13.svgMansfield RS measured against the S&P/ASX 200 reads +19.23%, state outperform, slope rising. Because this measure is anchor-free, the 2-year and 90-day files agree exactly, which is the expected cross-check.
The rate of change is the part worth dwelling on. The previous week's value was 11.83 and the previous month's was 7.73, so the weekly change is +7.40 and the monthly change +11.50. Positive and rising places the stock in the positive-accelerating quadrant — outperformance that is widening rather than merely being maintained. Roughly half of the entire two-year RS improvement has been added in the last month.
The two-year panel puts this in perspective: RS spent most of 2025 below zero, crossed decisively above in February 2026, and has held the outperform band since. A stock leading its index while the index itself is not falling is the cleanest of the bullish inputs on this page — and it is the one input the RSI divergence does not contradict.
⑥ ATR & ADX

STO_atr_adx-90d-2026-09-13.svgATR(14) is $0.172, or 2.00% of the close — a moderate daily range that makes the volatility arithmetic straightforward. One ATR below the close is $8.42; two ATR below is $8.25, i.e. 4.00% of downside before the current structure would have to be considered broken. The 90-day ATR track has eased from its late-August peak near $0.21, meaning the advance of the last fortnight has come with calmer daily ranges, not wilder ones.
ADX(14) reads 28.16 (2-year) and 28.69 (90-day), both above the 25 line that marks a strong trend. ADX measures strength, never direction — a high reading in a decline means a strong decline — so it must be read alongside the moving-average alignment, and here the two agree that the prevailing direction is up.
Worth noting that ADX has been grinding sideways in the high-20s rather than climbing, which suggests trend strength that is holding rather than intensifying. A slide back toward 20 would describe a trend losing definition even if price were still holding its shelves.
⑦ OBV

STO_obv-90d-2026-09-13.svgThe two timeframes disagree in degree, not direction, and both are worth stating. On the 90-day frame OBV is tagged accumulation: above its 20-day average, slope rising, and sitting 44.51% above that average. On the two-year frame the tag is early accumulation: still above its MA20, but only by 8.71% and with a flat slope. The short-window flow is emphatic; the long-window flow has only recently turned.
One caution on the figure itself, because the field name invites misreading: the 44.51% and 8.71% values measure the distance between OBV and its own 20-day average — a gauge of how stretched the flow is — and are not a divergence reading. The dedicated divergence field is null on both timeframes, so there is no OBV divergence to report here.
That matters for the balance of this page. The bearish signal on this chart comes from RSI alone; the volume-flow oscillator does not corroborate it. Where two oscillators disagree, the honest reading is that the evidence is mixed — the RSI divergence is a warning worth tracking, not a confirmed distribution pattern, and the sharply positive 90-day OBV is the main reason to treat it that way.
Bull vs Bear
Bull Case
- Full bullish moving-average alignment on both frames — close $8.59 > SMA5 $8.48 > SMA20 $8.28 > SMA60 $7.81, all rising.
- Mansfield RS +19.23% versus the S&P/ASX 200 and accelerating (weekly +7.40, monthly +11.50) — leadership widening, not fading.
- ADX 28.2/28.7 confirms a genuine trend rather than a drift, consistent with the alignment.
- MACD golden cross on 2026-09-08 with the histogram back above zero, and the cross occurring well above the zero line.
- OBV above its MA20 on both frames and rising strongly on the 90-day (+44.51% versus its average) — flow supports the advance.
- Price sits far above both anchored VWAPs ($7.27 and $7.77), leaving no obvious overhead supply shelf between the close and the 52-week high.
Bear Case
- Bearish RSI divergence on both frames: price $8.45 → $8.59 while RSI fell 72.36 → 69.49 between 20 August and 11 September.
- RSI at 69.5 is hard against the 70 overbought threshold — limited headroom before momentum readings become stretched.
- The advance to the range top came on Vol/Avg 0.99× — an unconfirmed push, the classic trap in breakout reading.
- Overhead is immediate and layered: Bollinger upper band $8.62, then the 52-week high $8.68 just 1.0% away.
- Two-year OBV slope is flat and only 8.71% above its MA20 — the long-window flow is far less emphatic than the 90-day tag suggests.
- Band width of 8.12% is already expanded and ADX is flat in the high-20s, so the move is running without the compression that usually precedes a fresh expansion.
Scenarios
| Scenario | Probability | Path | Trigger / Invalidation |
|---|---|---|---|
| Range extension | 45% | Holds the SMA5 shelf at $8.48, clears the band edge $8.62 and the 52-week high $8.68, opening unmapped ground above the two-year range. | Trigger: sustained close above $8.68 with volume above the 20-day average. Invalidation: close below $8.25. |
| Sideways digestion | 35% | Oscillates between the $8.25–$8.28 cluster and the band edge, letting the RSI divergence resolve through time rather than price while the moving averages catch up. | Trigger: closes alternating around SMA20 $8.28 with ADX easing toward 25. Invalidation of the range: decisive close outside $8.25–$8.68. |
| Divergence resolves lower | 20% | Loses the $8.25–$8.28 cluster, seeks the 90-day swing low $8.05 and then the two-year retracement grid at $8.02 and $7.92. | Trigger: close below $8.25 on expanding volume with RSI through 50. Invalidation: reclaim of $8.48. |
Probabilities are subjective weightings of the chart evidence above, not forecasts.
Key Levels & Volatility References
| Level | Role | Basis |
|---|---|---|
| $8.68 | Resistance | 52-week high — the defining overhead reference, 1.0% above the close |
| $8.62 | Resistance | Bollinger upper band (20, 2) |
| $8.59 | Current | Close of 11 September 2026; also the 0% anchor of the 90-day swing |
| $8.48 | Support | Rising SMA5 — nearest dynamic shelf beneath price |
| $8.46 | Support | 23.6% retracement of the 90-day swing ($8.05 → $8.59) |
| $8.32 | Support | 50% retracement of the 90-day swing |
| $8.25 | Invalidation | 2× ATR technical invalidation level (4.00% below the close); clusters with SMA20 $8.28 and the 61.8% retracement $8.26 |
What to Watch
- Volume on the next push. The $8.62–$8.68 band is the decisive zone; whether it is cleared on volume above the 20-day average or on another 0.99× session is the single most informative thing this chart can show next.
- RSI against the 20 August peak. A print back above roughly 72 cancels the bearish divergence; a slide through 50 confirms it. Everything between leaves it open.
- Two-year OBV slope. It is flat while the 90-day reading rises. A turn to rising on the long frame would align the two flow windows for the first time in this advance.
- The $8.25–$8.28 cluster. Three independent references — 2× ATR invalidation, SMA20 and the 61.8% retracement — converge there. It is the level that decides whether a pullback is routine or structural.
- ADX direction. Holding above 25 keeps the trend definition intact; a drift toward 20 would describe strength leaking away even while price holds.