West African Resources
$3.84 −5.42% from the 52-week high of $4.06 · +82.42% from the 52-week low of $2.11
This analysis is based on closing-price data as of September 11, 2026. Whether you're researching West African Resources (WAF) on the ASX or learning how to read stock charts, here are objective support, resistance and technical invalidation levels built from the RSI, MACD and ATR indicators.
The two-year panel shows a stock that has roughly doubled in stages: a long shelf near $1.50 through the second half of 2024, a step up through the first quarter of 2025, a wide and choppy range between roughly $2.40 and $3.30 that occupied most of the following twelve months, and then a fast advance out of a July 2026 low at $2.70 that has carried the close to $3.84 — 82.42% above the 52-week low of $2.11 and 5.42% under the 52-week high of $4.06. This week the screen picked WAF out on moving-average structure rather than on a single breakout bar, and the structure is intact: close $3.84 above SMA5 $3.82 above SMA20 $3.77 above SMA60 $3.24, with Mansfield RS at +25.71% against the S&P/ASX 200 and rising on both the weekly and the monthly measure. The complication sits in the oscillators. Both JSON frames flag an RSI bearish divergence — price made a higher high from $3.55 on August 11 to $3.89 on September 10 while RSI made a lower high from 71.58 to 62.50 — and MACD crossed down on September 2 with the histogram now at −0.0240. The trend is in good order; the momentum behind it has been thinning for a month.
Snapshot as of September 11, 2026 close
| Metric | Value | Reading |
|---|---|---|
| Close | $3.84 | 5.42% below the 52-week high, 1.29% below the September 10 closing high |
| 52-week high / low | $4.06 / $2.11 | Upper end of the two-year range, 82.42% above the low |
| SMA5 / SMA20 / SMA60 | $3.82 / $3.77 / $3.24 | Full rising order — close 0.52% above SMA5, 1.91% above SMA20, 18.56% above SMA60 |
| Bollinger upper / mid / lower | $4.05 / $3.77 / $3.49 | Close inside the band, 5.38% under the upper rail; width 14.79% of the middle band |
| aVWAP (2y, anchor Nov 26, 2025) | $3.18 | Close 20.71% above |
| aVWAP (90d, anchor Jun 15, 2026) | $3.26 | Close 17.69% above |
| RSI(14) | 59.7 (90d) / 59.6 (2y) | Mid-range and falling; bearish divergence flagged on both frames |
| RSI divergence peaks | Aug 11 $3.55 / RSI 71.58 → Sep 10 $3.89 / RSI 62.50 | Higher price high against a lower RSI high |
| Mansfield RS vs the S&P/ASX 200 | +25.71% | Outperform, rising (prev week 24.58, prev month 10.34) |
| MACD / signal / histogram | 0.1398 / 0.1638 / −0.0240 | Dead cross on September 2, 2026; both lines still well above zero |
| ADX(14) | 27.7 (90d) / 27.3 (2y) | Above 25 — a strong-trend reading, direction supplied by price |
| ATR(14) | $0.143 (3.72%) | About 14 cents of average daily range |
| OBV state | 90d accumulation, rising (+10.04% vs MA20) · 2y early accumulation, flat (+7.96%) | Above its MA20 on both timeframes; no OBV divergence reported |
| Volume vs 20-day average | 6,723,410 vs 4,957,555 (1.36×) | Above-average turnover on a lower session |
| Fibonacci swing | $2.70 (Jul 30) → $3.55 (Aug 11) | Up-swing; the whole retracement grid now sits below the market |
| Unfilled gaps | $3.51–$3.65 (Aug 20, 2026) · $2.47–$2.52 (Aug 6, 2025) | Both below the price; the nearer one is 4.95% under the close |
| 1× / 2× ATR technical invalidation | $3.70 / $3.55 | 2× sits 7.45% below the last close |
① Price & Moving Averages
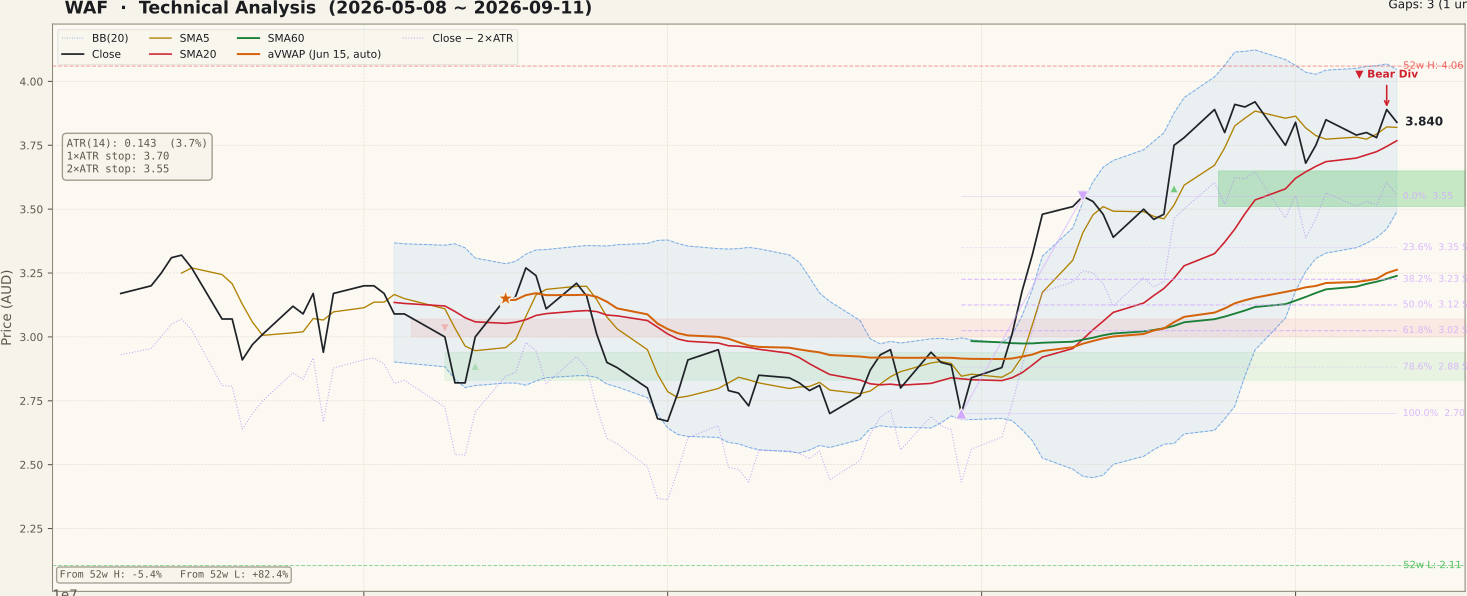
WAF_price-90d-2026-09-13.svgThis is the cleanest part of the page and the reason the screen surfaced the stock. Every average is in rising order beneath the price: close $3.84, SMA5 $3.8200, SMA20 $3.7680, SMA60 $3.2390. The spacing is worth reading as carefully as the order — 0.52% to SMA5, 1.91% to SMA20 and 18.56% to SMA60. The two fast lines are almost on top of the price, which is what a consolidation inside an advance looks like; the wide distance to SMA60 is the record of how fast the last six weeks moved rather than a live support reference.
The 90-day panel gives the sequence plainly. Price spent May and June drifting from about $3.20 down to the high $2.70s, based through most of July, then turned up sharply in the first week of August. The advance cleared $3.50 with a gap on August 20 that remains unfilled at $3.51–$3.65, ran the upper Bollinger rail through late August, and peaked at a $3.89 close on September 10. The last two weeks are a shallow sideways drift between roughly $3.75 and $3.90 while SMA20 climbs into the price — a consolidation of the move, not a reversal of it, at least so far.
Bollinger width is 14.79% of the middle band with the close 5.38% inside the upper rail at $4.0466, so the price is no longer pressed against the band the way it was in late August. Anchored VWAP from November 26, 2025 sits at $3.1811 and the 90-day anchor from June 15, 2026 at $3.2629; the close is 20.71% and 17.69% above them, so on either horizon the average price paid is far below the market and there is little overhead supply until the $4.05–$4.06 area. One caveat on the two-year panel: it carries a long straight-line stretch through roughly September to December 2025 where consecutive closes are absent. On the ASX that pattern is usually a trading halt or suspension, or a gap in the source series — it is not price action, and indicators computed across it should be read with that in mind.
② Volume

WAF_volume-90d-2026-09-13.svgThe final session turned over 6,723,410 shares against a 20-day average of 4,957,555 — a ratio of 1.36×. That is a genuinely above-average print, and it arrived on a session that finished 1.29% lower than the September 10 close. Elevated volume on a down day inside a consolidation is ambiguous by itself: it can be profit-taking into strength, or it can be the first sign that supply is meeting the advance. It is not, on its own, evidence of either.
The 90-day panel marks one true volume spike, in mid-June, well before this advance began. The August move off the $2.70 low was carried on bars that were consistently at or a little above the 20-day line rather than on any single dramatic surge, and the rising 20-day average through late August confirms that participation genuinely increased with the price. That is a healthier volume signature than a one-bar spike, because it means the move was absorbed over weeks rather than transacted in a session.
Liquidity is not a constraint here — daily turnover runs in the millions of shares, so the volume and OBV readings on this page carry more weight than they would on a thinly traded small cap, where a single parcel can distort both. The five sessions from September 7 to September 11 contained no anomalous volume event: the largest single-session move in that window was +2.91% on September 10, on 1.98× the average, which is well inside ordinary trading behaviour for a stock with a 3.72% average daily range.
③ MACD

WAF_macd-90d-2026-09-13.svgMACD is 0.1398 against a signal line of 0.1638, leaving the histogram at −0.0240 after a dead cross on September 2, 2026. That is the second clearly bearish reading on this page and it is nine sessions old, so it is no longer a fresh event — the histogram has been negative for the whole of the recent drift.
Context matters more than the cross itself. Both lines remain well above zero, and the 90-day panel shows the MACD line climbing from about −0.09 in mid-July to a peak near +0.22 in early September before rolling over. A dead cross that occurs high above the zero line, after a large advance, most often marks the end of the acceleration phase rather than the start of a decline: the two averages are converging because the rate of ascent slowed, not because price has broken down. The distinction matters, and the way to tell them apart is what happens next — a histogram that flattens and turns back up while price holds its range says the first reading was right; a MACD line that continues toward zero says the second is.
The comparison point is on the two-year panel, where the same pattern in April 2026 — a high dead cross after a strong run — was followed by a slide that took MACD below −0.15. The pattern does not settle the question either way; it simply means this configuration has resolved in both directions on this chart within the past year.
④ RSI

WAF_rsi-90d-2026-09-13.svgRSI(14) reads 59.7 on the 90-day frame and 59.6 on the two-year frame — mid-range, above the neutral 50 line, below the 70 overbought threshold. Taken alone that is an unremarkable number. What makes it the most important reading on the page is the divergence both JSON files flag.
The two peaks are specified. On August 11, 2026 the price was $3.55 with RSI at 71.58; on September 10, 2026 the price was $3.89 with RSI at 62.50. Price made a higher high of about 9.6% between those two dates while RSI made a lower high of nine points — a textbook regular bearish divergence. Read plainly, it says the second push higher was accomplished with less internal momentum than the first, which is the classic fingerprint of a trend that is maturing.
Two qualifications belong with that, and both cut against reading the divergence too hard. First, a divergence is a statement about the possibility of a reversal, not a confirmation of one; the price has not yet made a lower low, and until it does, the divergence is a caution rather than a signal. Divergences also routinely persist for weeks in strong trends and are unwound by consolidation rather than by decline. Second, the 90-day panel shows RSI held above 70 for roughly three weeks from mid-August into early September — that stretch is itself the mark of a strong trend, and it is the elevated readings during it that make the September peak look low by comparison. The honest summary is that momentum is thinning while structure remains intact, and those two things can coexist for some time.
⑤ Mansfield Relative Strength

WAF_rs-90d-2026-09-13.svgMansfield RS vs the S&P/ASX 200 reads +25.71%, state outperform, slope rising, and the figure is identical on both timeframes as it should be for an anchor-free measure. The previous week's value was 24.579 and the previous month's 10.343, so the weekly change is +1.13 points and the monthly change is +15.37 points. Positive and rising on both horizons puts WAF in the positive-and-accelerating quadrant — the most constructive of the four.
The 90-day panel adds the shape behind the number. RS was mildly positive through May, crossed below zero in early July and spent about a month in underperform territory, then turned up sharply in the first week of August and has been climbing since, reaching its highest reading of the window at the right edge. That is the single most bullish observation on this page, and it is the one that most clearly contradicts the RSI divergence: relative strength made a new high in the same week that RSI made a lower one.
The proportion is worth keeping in view. Most of the +15.37 monthly gain was earned in the first three weeks of August; the last week added only +1.13. Leadership is still improving, but the rate of improvement has decelerated markedly, which is a milder version of the same message the oscillators are giving. And the outperformance is roughly five weeks old — this is a stock that was lagging the index in July, not one with a multi-quarter record of leadership.
⑥ ATR & ADX

WAF_atr_adx-90d-2026-09-13.svgADX(14) is 27.7 on the 90-day frame and 27.3 on the two-year frame, both above the 25 line that marks a strong-trend regime. ADX measures the strength of a directional move without saying which direction it is, so it has to be read alongside the price panel — here price is rising, so a strong ADX supports the trend rather than warning about it. The two-year panel puts the reading in perspective: 27 is a solid figure for this stock but well below the readings above 30 it registered in the first quarter of 2026.
ATR(14) is $0.1428, or 3.72% of the price. That is the number that sets the scale for every level on this page. Fourteen cents of average daily range means the distance from the close at $3.84 down to the 1× ATR technical invalidation level at $3.70 is a single average session, and the distance to the 2× ATR level at $3.55 is two. It also means the gap between the close and the 52-week high at $4.06 is about a session and a half of ordinary movement — near, in ATR terms, even though it reads as 5.42% away.
The practical consequence is that on a chart this volatile, several of the levels in the table below sit within one or two ordinary sessions of each other. Levels that close together are best treated as zones rather than as lines, and a single wide day can cross more than one of them without meaning very much.
⑦ OBV

WAF_obv-90d-2026-09-13.svgThe two timeframes disagree in degree, and both are worth stating. On the 90-day frame OBV is 32,229,419 against a 20-day average of 29,287,537, tagged accumulation with a rising slope and standing 10.04% above its own MA20. On the two-year frame OBV is 39,909,247 against an MA20 of 36,967,365, tagged early accumulation with a flat slope and 7.96% above its MA20. Both frames have OBV above its average — the difference is that the shorter frame sees a rising line while the longer one sees a line that has only just recovered.
That split has a straightforward reading. The two-year OBV panel shows a line that peaked in September 2025, declined through most of the first half of 2026, and has been rebuilding since August — so at the two-year scale the recovery is real but young, which is exactly what "early accumulation" means. The 90-day panel shows the same rebuild as an uninterrupted climb from a negative reading in late July to the highest print of the window at the right edge.
One point to be precise about: the divergence_pct figures quoted above (10.04% and 7.96%) measure how far OBV sits from its own 20-day average — they are a measure of accumulation intensity, not a divergence. The dedicated divergence field is null on both frames, so no OBV divergence is reported. That matters because it means the divergence on this page is confined to RSI: volume flow is not corroborating the momentum warning. When price momentum weakens but volume flow does not, consolidation is a more common outcome than reversal — though that is a tendency, not a rule.
Bull Case vs Bear Case
Bull Case
- Full rising moving-average order — close $3.84 above SMA5 $3.82 above SMA20 $3.77 above SMA60 $3.24 — the structure the screen selected on this week.
- Mansfield RS +25.71% against the S&P/ASX 200 and rising on both horizons (+1.13 weekly, +15.37 monthly), at the highest reading of the 90-day window.
- Close 20.71% above the 2-year anchored VWAP $3.18 and 17.69% above the 90-day anchor $3.26 — almost no trapped supply between the price and either anchor.
- OBV above its MA20 on both frames; the 90-day line is tagged accumulation and rising, and no OBV divergence is reported to corroborate the RSI warning.
- ADX 27.7 confirms a strong-trend regime, and the unfilled August 20 gap at $3.51–$3.65 leaves a structural shelf beneath the market.
- The entire Fibonacci retracement grid from the July 30 – August 11 up-swing ($3.35 at 23.6% down to $2.70 at 100%) now sits below the price, so the swing has not surrendered any of its ground.
Bear Case
- RSI bearish divergence flagged on both frames — price $3.55 → $3.89 higher high against RSI 71.58 → 62.50 lower high, between August 11 and September 10.
- MACD dead cross on September 2 with the histogram at −0.0240; the MACD line has been falling from its early-September peak near +0.22 for nine sessions.
- The close is 5.42% under the 52-week high $4.06 and 5.38% under the Bollinger upper rail $4.05, having stopped short of both after riding the band in late August.
- The last session was 1.29% lower on 1.36× average volume — above-average turnover on a down day, which is at best ambiguous.
- Relative-strength leadership is five weeks old: RS was below zero as recently as early July, and the weekly gain has decelerated from double-digit monthly progress to +1.13.
- ATR at 3.72% means two ordinary adverse sessions cover most of the 7.45% distance from the close to the 2× ATR technical invalidation level at $3.55.
Scenarios
| Scenario | Probability | Path | Trigger / Invalidation |
|---|---|---|---|
| Sideways digestion unwinds the divergence | 45% | The drift between roughly $3.75 and $3.90 continues while SMA20 at $3.77 rises into the price. RSI works off the divergence through time rather than price, the MACD histogram flattens and turns back toward zero, and the structure is rebuilt without surrendering the August advance. | Trigger: continued closes between the August 20 gap top $3.65 and the September 10 high $3.89. Invalidated upward by a close above $3.89, downward by a close beneath $3.65. |
| Consolidation resolves upward toward the 52-week high | 33% | Price clears the $3.89 September high, the divergence is negated as RSI makes a higher high alongside price, and the move works toward the Bollinger upper rail at $4.05 and the 52-week high at $4.06 — about a session and a half of average range from here. | Trigger: a daily close above $3.89 on volume above the 20-day average of 4,957,555. Invalidated by a close back beneath SMA20 at $3.77. |
| The divergence resolves lower into the August gap | 22% | The thinning momentum proves decisive: price loses SMA5 and SMA20, then works back into the unfilled $3.51–$3.65 gap from August 20, where the 2× ATR technical invalidation level at $3.55 and the $3.55 swing-high anchor sit together. | Trigger: a daily close beneath $3.65. The structure that put this stock on the screen fails on a close beneath the 2× ATR technical invalidation level at $3.55. |
Key Levels & Volatility References
| Level | Role | Basis |
|---|---|---|
| $4.06 | Resistance | 52-week high (intraday extreme), 5.42% above the close; the Bollinger upper rail at $4.0466 sits in the same cent-band, making this one ceiling rather than two |
| $3.89 | Resistance | Closing high of September 10, 2026 and the second peak of the RSI bearish divergence — 1.30% above the close, the first hurdle in the way |
| $3.84 | Current | Last close, September 11, 2026 |
| $3.82 | Support | SMA5 ($3.8200), 0.52% below the close — the fastest average, still beneath the price |
| $3.77 | Support | SMA20 and the Bollinger middle band in the same place ($3.7680), 1.91% below the close; the rising short-term structure fails beneath it |
| $3.65 | Support | Upper edge of the unfilled gap of August 20, 2026 ($3.51–$3.65), 4.95% below the close; the first untested structural shelf |
| $3.55 | Invalidation | 2× ATR technical invalidation level ($3.554), 7.45% below the close; it sits inside the August gap and on the $3.55 swing-high anchor of August 11, so three separate references coincide there |
What to Watch
- Whether RSI makes a higher high alongside price. A move above the September 10 reading of 62.50 on a new price high negates the divergence outright; a lower RSI high on a flat or higher price extends it. This is the single question the next few weeks will answer.
- The MACD histogram, currently −0.0240. A flattening and a return toward zero would say the September 2 dead cross marked the end of the acceleration rather than the start of a decline; a MACD line that keeps falling toward zero says otherwise.
- Whether daily closes stay above SMA20 at $3.77 — the Bollinger middle band is in the same place, so the two references reinforce each other. Beneath it, the next shelf is the untested August 20 gap at $3.51–$3.65.
- Volume on any renewed attempt at $3.89 and $4.06. The last session traded 1.36× the 20-day average on a lower close; a push to new highs on comparable or better turnover would resolve the participation question in the constructive direction.
- Mansfield RS relative to last week's 24.58. The weekly gain has already narrowed to +1.13 points from a +15.37 monthly advance; RS rolling over while price holds its range would be the earliest sign the relative-strength edge is fading.
- Commodity pricing and sector news flow, which sit entirely outside these panels but can move a Materials-sector producer independently of anything on the chart. No such event appeared in the five sessions this page reads — but that is a statement about this week, not about next week.