South32
This analysis is based on closing-price data as of September 11, 2026. Whether you're researching South32 (S32) on the ASX or learning how to read stock charts, here are objective support, resistance and technical invalidation levels built from the RSI, MACD and ATR indicators.
South32 closed the week at $5.02, 5.8% below the $5.33 52-week high and 96.9% above the $2.55 low that anchors the two-year chart. The structure behind that number is an eight-week advance: price stepped off a $3.90 swing low on July 17 and reached $5.30 by September 9, carrying Mansfield relative strength to +24.0% against the S&P/ASX 200 and ADX to 31.2. What the weekly screen flagged here is the pause inside that advance rather than the advance itself — the last session of the week gave ground on 1.35× average volume and left the close beneath both the $5.18 SMA5 and the $5.10 SMA20, while the rising $4.60 SMA60 remains 9.0% lower. The momentum panels had already softened ahead of it: RSI sits back at 50.0 with a bearish divergence flagged between the July 23 and September 9 peaks, and MACD has been under its signal line since a dead cross on September 3.
Snapshot as of September 11, 2026
| Item | Value | Reading |
|---|---|---|
| Close | $5.02 | −5.8% from 52w high · +96.9% from 52w low |
| 52-week range | $2.55 – $5.33 | Upper end of the range; the high is 6.2% above the close |
| SMA 5 / 20 / 60 | $5.18 / $5.10 / $4.60 | All three rising and correctly ordered, but the close slipped below the 5-day and 20-day lines this week; it remains 9.0% above the 60-day line |
| Bollinger (20) | $5.42 / $5.10 / $4.78 | Band width 12.48%; the close sits between the mid-band and the lower band, in the lower half of the envelope |
| aVWAP (2y anchor Apr 7, 2025) | $3.61 | Price 38.9% above the long-horizon anchored average |
| aVWAP (90d anchor Jul 1, 2026) | $4.59 | Price 9.4% above — the cohort anchored to the July advance is onside |
| RSI(14) | 50.0 | Back at the midline from a 65-plus reading, with a bearish divergence flagged: $4.66 at RSI 65.66 on Jul 23 versus $5.30 at RSI 64.57 on Sep 9 |
| Mansfield RS (vs the S&P/ASX 200) | +24.0% | Outperforming, slope flat: −3.14 points on the week but +4.93 points on the month |
| MACD (12,26,9) | 0.1218 / 0.1493 / −0.0275 | Dead cross of Sep 3, 2026; histogram negative, though both lines remain clearly above zero |
| ADX(14) | 31.2 | Above 25 — a strong directional reading (30.8 on the two-year frame) |
| ATR(14) | $0.156 (3.1%) | An ordinary daily range for a large ASX materials constituent |
| OBV (2y / 90d) | early distribution / improving | Below MA20 on both frames — by 1.35% and 9.73% — but the slopes disagree: flat on the two-year panel, rising on the 90-day panel. No OBV divergence is flagged on either frame |
| Volume vs 20d avg | 1.35× | 19,309,342 shares against a 14,284,671 average — above-average participation on a session that gave ground |
| Unfilled gap | $4.08 – $4.17 | Support gap of Jul 21, 2026, still open well beneath the current structure |
| 1×ATR / 2×ATR technical invalidation | $4.86 / $4.71 | Volatility-based structural reference levels below the close |
① Price & Moving Averages
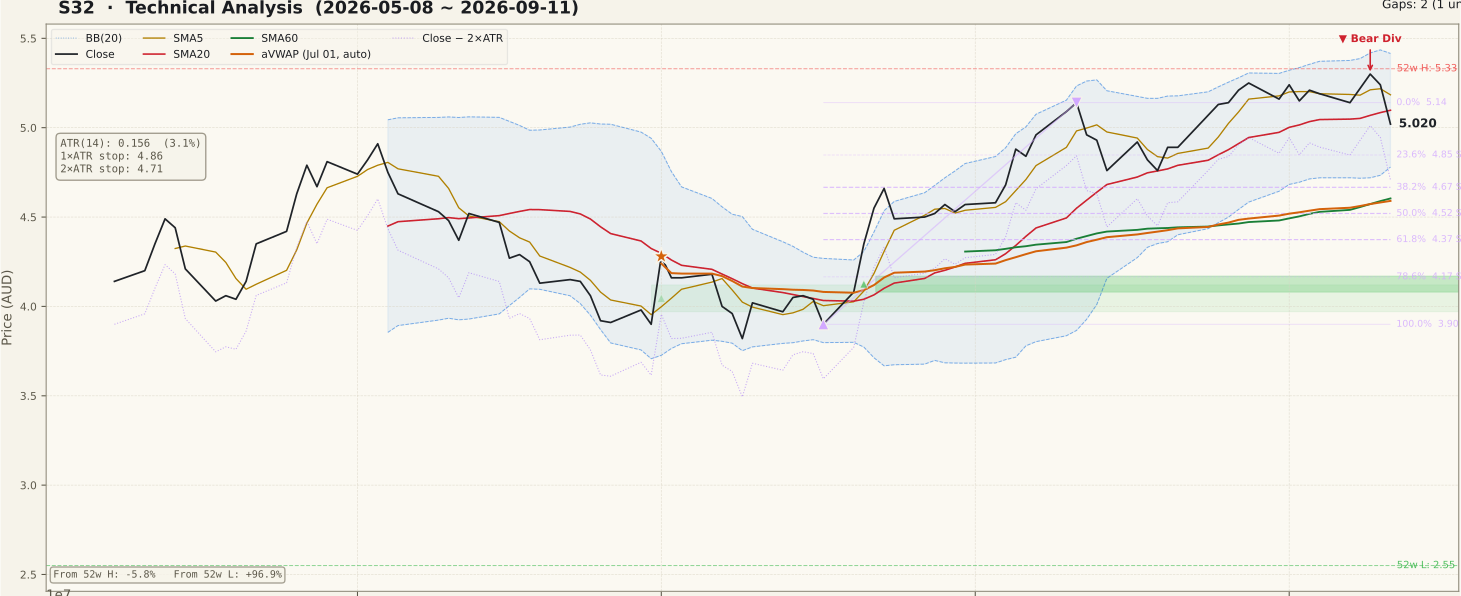
S32_price-90d-2026-09-13.svgThe two-year panel divides into three phases. From September 2024 into early 2025 price drifted inside a $3.20–$3.80 band, then broke down sharply in April 2025 to the $2.55 area — the 52-week low, and the session the tool selected as its long-horizon VWAP anchor (April 7, 2025). A long base followed through mid-2025, with a second test of the $2.55 shelf around September 2025. The third phase is a repair that has run since late 2025: a steady climb through the December–February stretch, a wide $4.00–$4.70 range from February to July 2026, and then the advance that carried price clear of that range to the $5.33 high visible at the right edge.
The 90-day window isolates the last leg and explains why this name surfaced on a pullback screen rather than a breakout screen. Price left a $3.90 low on July 17, worked through an unfilled gap at $4.08–$4.17 dated July 21, and reached $5.14 on August 11 before a short consolidation and a further push to $5.30 on September 9. The moving-average stack is still correctly ordered and rising — SMA5 $5.18 above SMA20 $5.10 above SMA60 $4.60 — but the week's final session left the close at $5.02, under the first two lines for the first time in this leg. That places the close in the lower half of a Bollinger envelope of 12.48% width, with the $5.10 mid-band now directly overhead and the $4.78 lower band beneath. The wider structure has not changed: the whole July–August retracement grid, from the $4.85 23.6% level down to the $3.90 swing origin, still sits below price, and the close remains 9.0% above the 60-day line.
② Volume

S32_volume-90d-2026-09-13.svgThe as-of session traded 19,309,342 shares against a 20-day average of 14,284,671, a ratio of 1.35×. That is the single most important qualifier on this week's reading: the pullback came with more participation than the average session, not less. A low-volume drift back into a trend is the benign version of a pause; an above-average one says the move had willing supply behind it.
Set against the 90-day panel, though, 1.35× is a moderate figure rather than an outlier. The chart's own spike threshold is 2× the average, and the only bars that cross it in this window sit around July 21, near the low of the swing — roughly 6.8 million and 5.2 million shares on the two heaviest days, well above anything printed since. Through August and early September the advance was carried on volume close to or slightly under the 20-day average line, which is the more common criticism of this structure: the climb to $5.30 was not itself volume-confirmed, so the heavier down session is a change in character rather than a break of one. The next few sessions matter more than this one — sustained above-average volume on further weakness would argue that distribution has begun, while a return to average turnover on a base would not.
③ MACD

S32_macd-90d-2026-09-13.svgMACD reads 0.1218 against a signal line at 0.1493, leaving the histogram at −0.0275 after a dead cross on September 3, 2026. The crossing itself is a deterioration signal, but the context around it cuts both ways. Both lines remain well above zero, which places this in the category of a momentum stall inside an up-trend rather than a trend reversal — the kind of cross that has appeared repeatedly on the 90-day panel and been followed by a golden cross shortly afterwards, most recently in late August.
The 90-day panel shows the sequence plainly: a rising MACD through late July and August that peaked near 0.21 in mid-August, a first dead cross, a golden cross that failed to lift the lines back to the prior peak, then this second cross. That pattern — lower momentum peaks against higher price peaks — is the same information the RSI divergence is describing, and the agreement between the two panels is worth more than either on its own. What would settle it is direction: a histogram that shrinks back toward zero and a recross would mark the stall as temporary, while a widening negative histogram with both lines rolling toward zero would describe something more durable.
④ RSI

S32_rsi-90d-2026-09-13.svgRSI(14) finished at 50.0, exactly on the midline, having spent most of August and early September in the 55–70 band without registering a sustained overbought reading. The chart flags a bearish divergence, and the underlying peaks are specific: $4.66 at RSI 65.66 on July 23 against $5.30 at RSI 64.57 on September 9. Price made a decisively higher high between those two points — 13.7% higher — while RSI made a marginally lower one.
Two cautions belong with that. First, the RSI gap between the peaks is about one point; a divergence built on so small a difference is a weak one, and the common beginner error is to treat any divergence as a completed top signal. It is not — a divergence is a statement about the rate of change, and it requires price confirmation before it means anything about direction. Second, neither peak reached 70, so this is not a momentum extreme unwinding; it is a trend that advanced without ever running hot. The 50 line is now the practical reference: readings that stabilise above it keep the up-trend interpretation available, while a sustained move into the 40s would give the divergence the follow-through it currently lacks.
⑤ Mansfield Relative Strength

S32_rs-90d-2026-09-13.svgMansfield relative strength against the S&P/ASX 200 reads +24.0%, comfortably in outperformance territory, with the tool describing the slope as flat. Because the measure is anchor-free, the two-year and 90-day panels give the identical value, and the longer frame supplies the context: the reading crossed above zero in late 2025 after a year spent below it, peaked above +40 in the February–June 2026 stretch, and has held the positive zone continuously since.
The two comparison points move in opposite directions, which is the detail worth carrying. The previous week's reading was 27.16 and the previous month's was 19.09, so the change is −3.14 on the week and +4.93 on the month. In positive territory a falling weekly change is a slowing of outperformance, not a deterioration into underperformance — S32 is still ahead of the index, just less emphatically than it was five sessions ago, and it remains materially ahead of where it stood a month back. That combination is consistent with a pullback inside relative leadership rather than a rotation out of it, and the level to watch is the +20 area that framed the trough of the July consolidation.
⑥ ATR & ADX

S32_atr_adx-90d-2026-09-13.svgATR(14) is $0.156, or 3.1% of the close — an ordinary daily range for a large ASX materials name, and the basis for the volatility references quoted throughout this page. One average true range below the close is $4.86; two are $4.71, which is 6.2% under the close and the level this analysis uses as its objective technical invalidation reference. On the 90-day panel ATR has ranged roughly between $0.13 and $0.17, so the current reading sits in the upper half of that band — volatility has picked up alongside the advance rather than compressing into it.
ADX(14) is 31.2 on the 90-day frame and 30.8 on the two-year frame, both above the 25 threshold that marks a strong directional regime. The panel shows the reading climbing from the low 20s through August as the advance extended. Two things about ADX are routinely misread. It measures the strength of a trend, not its direction, so a high reading would describe a strong decline just as readily as a strong advance. And it lags — a reading of 31 confirms the move that has already happened; it does not extend it. Taken with the moving-average structure, the fair summary is a strong up-trend that has paused, with the directional measure not yet reflecting the pause.
⑦ On-Balance Volume

S32_obv-90d-2026-09-13.svgThe two frames disagree, and both readings are worth stating. On the two-year panel OBV is 293,429,658 against an MA20 of 297,452,718, a gap of −1.35%, tagged early distribution with a flat slope. On the 90-day panel OBV is 37,324,478 against an MA20 of 41,347,538, a gap of −9.73%, tagged improving with a rising slope. The common element is position — OBV is below its 20-day average on both horizons — and the difference is direction, with the shorter frame turning up while the longer one has flattened out.
The 90-day panel makes the improvement visible: the OBV line fell through late June and July to a deep trough beneath its zero reference, then climbed steadily through August and has spent recent weeks back above that reference. That recovery is what the improving tag describes, and it is a genuine bullish input; the qualification is that the line is still under its own moving average, so the improvement has not yet converted into confirmed strength. Note that the divergence percentage quoted above is a distance to the moving average, not a price-versus-OBV divergence — the dedicated divergence fields are null on both frames, so no OBV divergence is flagged here, and the only divergence on this page is the RSI one.
Bull Case vs Bear Case
Bull Case
- Moving-average stack still correctly ordered and rising: SMA5 $5.18 > SMA20 $5.10 > SMA60 $4.60, with the close 9.0% above the 60-day line
- Mansfield RS +24.0% versus the S&P/ASX 200, positive without interruption since late 2025 and +4.93 points on the month
- Price above both anchored VWAPs — $3.61 on the two-year anchor (+38.9%) and $4.59 on the 90-day anchor (+9.4%)
- ADX 31.2 (30.8 on the two-year frame) — a strong directional regime rather than a drift
- 90-day OBV tagged improving with a rising slope, recovered from its July trough; no OBV divergence flagged on either frame
- The entire July–August retracement grid, $4.85 down to the $3.90 swing origin, sits beneath the close, with an unfilled $4.08–$4.17 gap further below
Bear Case
- Bearish RSI divergence flagged: $4.66 at RSI 65.66 on Jul 23 against $5.30 at RSI 64.57 on Sep 9, with RSI now back at 50.0
- MACD below its signal line since the Sep 3 dead cross, histogram −0.0275, echoing the same lower-momentum-higher-price pattern
- The close finished under both the $5.18 SMA5 and the $5.10 SMA20 — the first break of the short-term stack in this leg
- The give-back came on 1.35× average volume, 19,309,342 shares against 14,284,671 — participation was above average on a down session
- OBV below its MA20 on both frames; the two-year reading is tagged early distribution with a flat slope
- Mansfield RS slope flat and −3.14 points on the week — relative leadership cooled into the close of the week
Scenarios
| Scenario | Probability | Path | Trigger / Invalidation |
|---|---|---|---|
| Pullback resolves inside the up-trend | 45% | Price bases between the $4.85 23.6% shelf and the $5.10 mid-band, then works back above the 20-day line; MACD histogram narrows toward zero and RSI stabilises above 50 | Confirmation: a daily close above $5.10 on volume at or above the 14,284,671 average. Negated by a daily close below $4.85 |
| Advance resumes through the range high | 25% | A brief pause only, with price reclaiming $5.14 (the August 11 swing high) and pressing the $5.33 52-week high; upper Bollinger Band at $5.42 the next reference above | Confirmation: a daily close above $5.14 with volume above average and a MACD recross. Negated by a failure at $5.10–$5.14 on light turnover |
| Retracement deepens toward the 38.2% shelf | 30% | $4.85 and the $4.78 lower band give way; the RSI divergence gets its price confirmation and the structure retraces toward $4.67, with the $4.60 SMA60 and $4.59 90-day aVWAP clustered just beneath | Trigger: a daily close below $4.78 on above-average volume. The 2×ATR technical invalidation level at $4.71 marks where the July–September swing structure no longer holds together |
Key Levels & Volatility References
| Level | Role | Distance | Basis |
|---|---|---|---|
| $5.33 | Resistance | +6.2% | 52-week high, printed in the final week of the advance |
| $5.14 | Resistance | +2.4% | August 11, 2026 swing high — 0% of the current up-swing on the retracement grid |
| $5.10 | Resistance | +1.5% | SMA20 and Bollinger mid-band — the nearest overhead line after this week's close |
| $5.02 | Current | — | September 11, 2026 close on 1.35× average volume |
| $4.85 | Support | −3.4% | 23.6% retracement of the July 17 – August 11 swing ($3.90 – $5.14) |
| $4.78 | Support | −4.8% | Lower Bollinger Band (20, 2) at 12.48% band width |
| $4.71 | Invalidation | −6.2% | 2×ATR technical invalidation level — objective structural reference, just under the lower band |
What to Watch
- Whether the $5.10 SMA20 and mid-band is reclaimed or converts into overhead resistance — it is the single nearest line and the dividing point between the first and third scenarios.
- Volume character over the next few sessions. The 1.35× reading on the give-back is moderate; a run of above-average turnover on further weakness would be the distribution signature that the two-year OBV tag is hinting at.
- RSI behaviour around 50.0. The flagged divergence is built on a gap of roughly one point between peaks and needs price confirmation — a stabilisation above the midline leaves it unconfirmed.
- The MACD histogram at −0.0275. A narrowing histogram and a recross above the 0.1493 signal line would mark the September 3 cross as another of the short stalls visible on the 90-day panel.
- Mansfield RS at +24.0% after a −3.14 week. Holding the +20 area would keep the relative-leadership reading consistent with a pullback rather than a rotation.