New Hope Corporation
$6.33 −2.47% from the 52-week high of $6.49 · +67.90% from the 52-week low of $3.77
This analysis is based on closing-price data as of September 11, 2026. Whether you're researching New Hope Corporation (NHC) on the ASX or learning how to read stock charts, here are objective support, resistance and technical invalidation levels built from the RSI, MACD and ATR indicators.
The two-year chart divides cleanly into three acts: a slide from around $5.00 in late 2024 into a base near the bottom of the range through the first half of 2025, a long consolidation through the back half of that year, and a sustained advance through 2026 that has now carried the close to $6.33 — 67.90% above the 52-week low of $3.77 and 2.47% under the 52-week high of $6.49. The screen flagged this one as a breakout, and the structural evidence supports the label: the price has cleared the ceiling that contained every rally between March and August 2026, Mansfield RS is +29.06% against the S&P/ASX 200 and accelerating on both the weekly and monthly measures, and ADX is 48.52 — deep in the strong-trend band. The complication is what the tape did not do. The move to new highs arrived on volume of 1.02× the 20-day average, the last session closed 1.25% lower and finished back beneath SMA5, and RSI at 71.84 is already past the conventional overbought threshold. This is a clean structural breakout that has not yet been confirmed by participation.
Snapshot as of September 11, 2026 close
| Metric | Value | Reading |
|---|---|---|
| Close | $6.33 | 2.47% below the 52-week high |
| 52-week high / low | $6.49 / $3.77 | At the very top of the two-year range |
| SMA5 / SMA20 / SMA60 | $6.39 / $6.01 / $5.54 | Close above SMA20 and SMA60, but 0.94% beneath SMA5 |
| Bollinger upper / mid / lower | $6.56 / $6.01 / $5.46 | Close inside the band, 3.62% under the upper rail; width 18.32% |
| aVWAP (2y, anchor Sep 17, 2025) | $5.01 | Close 26.47% above |
| aVWAP (90d, anchor Jul 7, 2026) | $5.56 | Close 13.77% above |
| RSI(14) | 71.84 (90d) / 71.76 (2y) | Above the overbought threshold; no divergence reported |
| Mansfield RS vs the S&P/ASX 200 | +29.06% | Outperform, rising (prev week 22.77, prev month 8.16) |
| MACD / signal / histogram | 0.2426 / 0.2121 / +0.0305 | Golden cross on August 11, 2026; histogram positive |
| ADX(14) | 48.52 (90d) / 47.86 (2y) | Strong-trend regime, near the top of the two-year panel |
| ATR(14) | $0.1694 (2.68%) | About 17 cents of average daily range |
| OBV state | 90d accumulation, rising · 2y early accumulation, flat | Above its MA20 on both timeframes |
| Volume vs 20-day average | 2,500,756 vs 2,444,766 (1.02×) | Ordinary turnover on a new-high week |
| Fibonacci swing | $5.12 (Aug 5) → $6.45 (Sep 9) | Up-swing; levels below the price act as retracement support |
| 1× / 2× ATR technical invalidation | $6.16 / $5.99 | 2× sits 5.36% below the last close |
① Price & Moving Averages
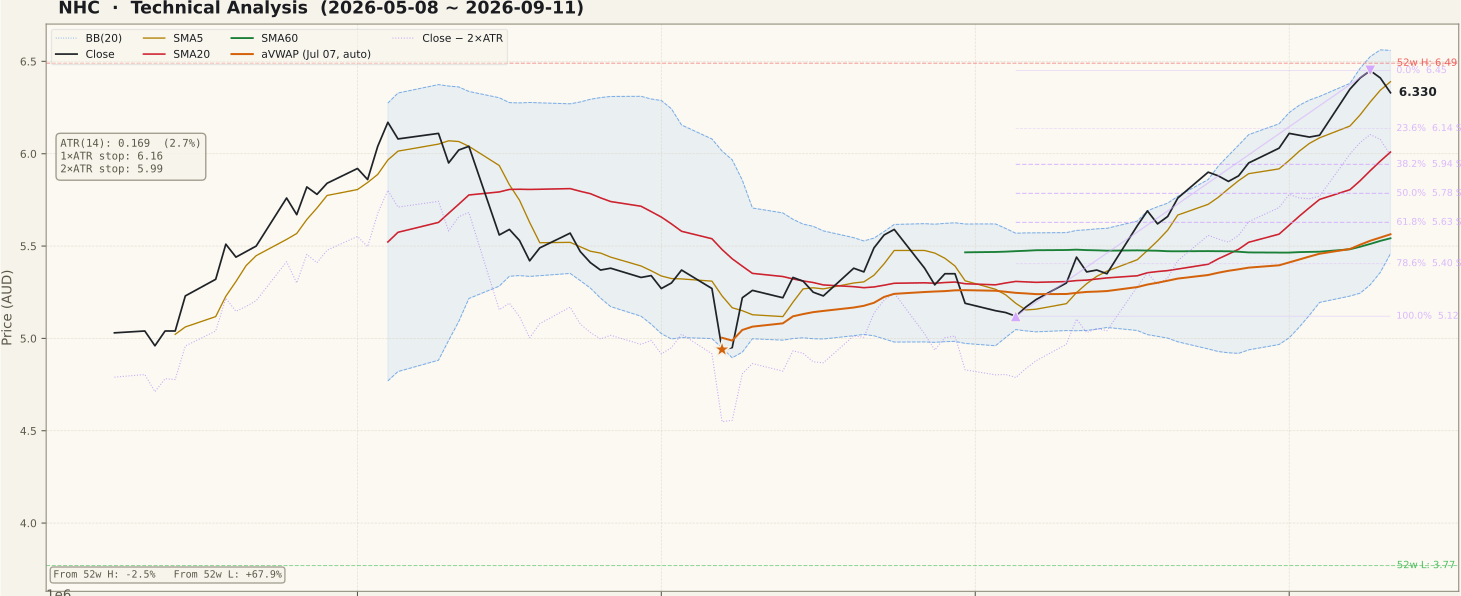
NHC_price-90d-2026-09-13.svgThe longer averages are in rising order and the price sits well clear of them: close $6.33 against SMA20 $6.0090 (+5.34%) and SMA60 $5.5420 (+14.22%). The 90-day panel shows why this qualifies as a breakout rather than another swing inside the range — from the July low the advance has been a steady staircase, and the last fortnight carried it above the band that capped the June rally. On the two-year panel the same move clears the highest closes recorded since the chart begins in September 2024.
The detail worth pausing on is the shortest average. SMA5 is $6.3900 and the close is $6.33, so the price finished below its five-day average — the first time in this advance that the fastest line has been given up. That is a single session, not a trend change, and the gap is under 1%; but it is the reason the nearest overhead reference on this page is a moving average rather than a structural high. Above it sit the swing anchor high of $6.45 from September 9 and the 52-week high of $6.49 (the anchor is a closing extreme, the 52-week figure an intraday one — two measures of the same ceiling).
Bollinger width is 18.32% of the middle band and the close is 3.62% inside the upper rail at $6.5594, so the price is extended but not outside the twenty-day distribution. Anchored VWAP from September 17, 2025 sits at $5.0052 and the shorter anchor from July 7, 2026 at $5.5637; the close is 26.47% and 13.77% above them respectively, meaning the average price paid since either anchor is far below the market and there is very little trapped overhead supply in the immediate area. The two-year chart carries one unfilled gap, at $3.52–$3.60 from April 10, 2025 — far enough below to be context rather than a working level.
② Volume

NHC_volume-90d-2026-09-13.svgThe final session traded 2,500,756 shares against a 20-day average of 2,444,766, a ratio of 1.02×. That is the single most important qualification on this page. The two volume spikes the 90-day panel marks are both in August, before the breakout; the push into new-high territory itself was transacted on unremarkable turnover.
One of the most common beginner errors is to treat a chart that has made a new high as a confirmed breakout regardless of what the volume bars did. The conventional reading is the opposite: a range breakout wants expanding participation, and 1.02× is participation that has not changed at all. This does not invalidate the structure — the advance up to this point was orderly and the OBV panel below shows genuine net inflow — but it means the breakout is unconfirmed on the one measure designed to confirm it.
③ MACD

NHC_macd-90d-2026-09-13.svgMACD reads 0.2426 against a signal line of 0.2121, a positive histogram of +0.0305, with the last crossover a golden cross dated August 11, 2026. The crossover formed below the zero line and the indicator has since climbed steadily, which is the constructive sequence: momentum turned before the price cleared the range rather than after.
Two qualifications come off the panels. On the 90-day frame the MACD line has now exceeded its early-June peak, so momentum is at its best reading of the quarter. On the two-year frame it is level with — not above — the spikes recorded in March and June 2026, each of which preceded a multi-week pullback. The histogram is also no longer expanding at the pace it set in late August, which is the first quiet signal that the rate of improvement is easing even while the direction stays positive.
④ RSI

NHC_rsi-90d-2026-09-13.svgRSI(14) reads 71.84 on the 90-day frame and 71.76 on the two-year frame — both a little past the conventional overbought line at 70, and both already turning down from a slightly higher peak earlier in the week. The JSON reports no RSI divergence and supplies no divergence peaks on either timeframe, so this page makes no divergence claim in either direction.
An RSI above 70 describes the speed of an advance, not its ending. In a genuine trend the oscillator can stay above the line for weeks, and the 2024–25 section of the two-year panel shows this stock doing exactly that during earlier runs. The practical consequence is narrower than a reversal call: the oscillator has spent its cushion, so any further gain starts from a stretched reading, and the three prior occasions in 2026 when RSI pushed past 70 — in February, March and June — each coincided with a local high on the price panel rather than with an acceleration.
⑤ Mansfield Relative Strength

NHC_rs-90d-2026-09-13.svgMansfield RS versus the S&P/ASX 200 reads +29.06% and is rising. Because the prior readings are absolute values rather than changes, the arithmetic has to be done explicitly: a week ago RS stood at 22.77, so the weekly change is +6.29; a month ago it stood at 8.16, so the monthly change is +20.90. Both changes are positive with RS itself in positive territory, which puts the stock in the positive-and-accelerating quadrant on both horizons — the strongest of the four configurations.
The two-year panel supplies the context that the reading alone does not. RS was negative for the whole of late 2024 and all of 2025, crossed zero in January 2026, and has been positive ever since, peaking near +48 in April. The current +29.06% is therefore a strong reading recovering from the August dip toward zero rather than a new extreme for this cycle. The distinction matters: relative leadership here is re-established, not freshly won, and it has not yet matched its own April benchmark.
⑥ ATR & ADX

NHC_atr_adx-90d-2026-09-13.svgATR(14) is $0.1694, or 2.68% of the last close (the 90-day frame gives $0.1692 and 2.67% — effectively identical). That is a moderate daily range for a stock at this price, and it sets the scale for every level below: one average session covers about 17 cents, so the entire distance from the close to the $6.14 retracement shelf is roughly one session, and the span from the 52-week high down to that shelf is about two. Levels this tightly packed should be read as zones rather than as lines. The 1× ATR technical invalidation level sits at $6.16 and the 2× level at $5.99, the latter 5.36% below the close.
ADX(14) reads 48.52 on the 90-day frame and 47.86 on the two-year frame, both far above the 25 threshold that separates a trending market from a ranging one, and near the top of the readings visible on the two-year panel. ADX measures the strength of a directional move rather than its direction, so on its own it says only that the market is committed; combined with the rising order of the longer averages it describes a trend rather than a chop. The reading is worth watching precisely because it is high — ADX above roughly 40 is historically closer to the maturity of a move than to its beginning.
⑦ OBV

NHC_obv-90d-2026-09-13.svgThe two timeframes agree in direction and differ in maturity. On the 90-day frame OBV is 51,748,358 against an MA20 of 46,904,354, tagged as accumulation, above its average and rising. On the two-year frame OBV is 93,463,479 against an MA20 of 88,619,475, tagged as early accumulation, above its average but with a flat slope. Strong recent net inflow, in other words, sitting on a longer-term reading that has only recently turned constructive — though the two-year panel shows the OBV line climbing without interruption since January 2026.
The gap between OBV and its own MA20 is 10.33% on the 90-day frame and 5.47% on the two-year frame. It is worth being explicit about what that number is, because the field name misleads: it measures the distance between OBV and its own moving average — how stretched the inflow is — and it is not a divergence. The actual divergence fields are null on both timeframes for both RSI and OBV, so no divergence is claimed here. What OBV does add is the counterweight to the volume panel: the breakout session was ordinary, but the cumulative flow behind the advance has been positive and persistent, which is the more informative of the two readings over a multi-week horizon.
Bull Case vs Bear Case
Bull Case
- Price is in new 52-week-high territory: close $6.33, 2.47% under the $6.49 high and 67.90% above the $3.77 low, clearing the ceiling that capped every 2026 rally from March onward.
- Longer averages in rising order and comfortably beneath the price — close 5.34% above SMA20 $6.01 and 14.22% above SMA60 $5.54.
- Mansfield RS +29.06% and accelerating on both measures (+6.29 weekly, +20.90 monthly), in the positive-and-accelerating quadrant.
- ADX(14) at 48.52 (90d) / 47.86 (2y), deep in the strong-trend band and near the top of the two-year panel.
- OBV above its MA20 on both frames — 90-day accumulation and rising, with the two-year line climbing steadily since January 2026.
- Price 26.47% above the 2-year anchored VWAP ($5.01) and 13.77% above the 90-day anchor ($5.56), leaving little trapped supply nearby; MACD golden cross from August 11 still intact with a positive histogram.
Bear Case
- The new-high session carried volume of just 1.02× the 20-day average (2,500,756 vs 2,444,766) — a breakout without a participation increase.
- RSI 71.84 is past the overbought threshold, and the three earlier 2026 pushes above 70 (February, March, June) each coincided with a local high rather than an acceleration.
- The close finished 0.94% beneath SMA5 $6.39 after a lower session — the first time the fastest average has been given up during this advance.
- Mansfield RS at +29.06% is still well short of its April 2026 peak near +48, so leadership is recovering rather than setting a new extreme.
- Close sits 5.34% above SMA20 and 14.22% above SMA60; a reversion to either mean is a meaningful move from here.
- With ATR at 17 cents, the whole band from the 52-week high $6.49 down to the $6.14 shelf is about two average sessions wide, so a single wide day can cross several of the levels on this page.
Scenarios
| Scenario | Probability | Path | Trigger / Invalidation |
|---|---|---|---|
| Breakout extends on confirming volume | 35% | The price recovers SMA5 at $6.39, clears the $6.45 swing anchor and the $6.49 52-week high, and works toward the upper Bollinger rail at $6.56 with the band expanding rather than pinching. | Trigger: a daily close above $6.49 on volume meaningfully above the 20-day average. Invalidated by a close back beneath $6.14. |
| Sideways digestion inside the retracement shelf | 45% | The stretched RSI unwinds through time rather than price: the close works between $6.14 (23.6% retracement) and $6.45 while SMA20 at $6.01 rises toward it, rebuilding the structure without surrendering the range breakout. | Trigger: a close back under $6.39 without follow-through beneath $6.14. Invalidated upward by a close above $6.49, downward by a close beneath $5.94. |
| Failed breakout back toward the mean | 20% | The unconfirmed volume proves decisive: the price loses the $6.14 shelf, the 38.2% retracement at $5.94 gives way, and the move retraces toward SMA20 and the Bollinger middle band at $6.01 or the August base beneath it. | Trigger: a close beneath the 2× ATR technical invalidation level at $5.99. The rising structure fails on a close beneath SMA20 at $6.01 that is not recovered within a few sessions. |
Key Levels & Volatility References
| Level | Role | Basis |
|---|---|---|
| $6.49 | Resistance | 52-week high (intraday extreme) — the outer edge of the two-year range, 2.47% above the close |
| $6.45 | Resistance | Closing high of September 9 and the 0% anchor of the current up-swing |
| $6.39 | Resistance | SMA5 — the nearest overhead reference, 0.94% above the close after the final session closed beneath it |
| $6.33 | Current | Last close, September 11, 2026 |
| $6.14 | Support | 23.6% retracement of the August 5 – September 9 up-swing; the 1× ATR technical invalidation level at $6.16 sits in the same 2-cent zone |
| $6.01 | Support | SMA20 and the Bollinger middle band, in the same place; the rising short-term structure fails beneath it |
| $5.99 | Invalidation | 2× ATR technical invalidation level, 5.36% below the close; the 38.2% retracement at $5.94 lies immediately under it |
What to Watch
- Volume on any renewed attempt at $6.49. A second push to new highs on turnover near 1.0× the 20-day average would leave the classic unconfirmed breakout pattern intact; a clear expansion would resolve the single largest question on this page.
- Whether the close recovers SMA5 at $6.39 within a few sessions, or whether $6.45 becomes the first lower high of a pullback.
- Whether the $6.14 shelf — the 23.6% retracement with the 1× ATR level at $6.16 in the same zone — contains a first pullback, or gives way inside a single average session.
- Whether Mansfield RS keeps climbing toward its April peak near +48 or rolls over the way it did through June and July; RS turning down while price makes new highs would be the warning that the leadership is thinning.
- Commodity pricing and sector news flow, which sit entirely outside the chart but can move an energy-sector producer independently of anything on these panels — no such event appeared in the five sessions this page reads, but that is a statement about this week, not about next week.