ORA Banda Mining
This analysis is based on closing-price data as of September 11, 2026. Whether you're researching ORA Banda Mining (OBM) on the ASX or learning how to read stock charts, here are objective support, resistance and technical invalidation levels built from the RSI, MACD and ATR indicators.
ORA Banda Mining closed Friday at $1.545, 10.2% below the $1.72 52-week high set intraday on January 21, 2026 and 65.2% above the $0.935 low of mid-September 2025. The two-year panel puts the current fortnight in context: the gold producer peaked in late January, spent five months grinding back to a $1.02 close on June 11, then rebuilt through July and August — including a gap higher on August 20 that carried the close from $1.39 to $1.585 in one session — before stalling at $1.675 on August 24. Since that high the chart has worked sideways rather than unwound, and the close now sits almost exactly on the 20-day average. The useful lens this week is therefore a shallow pause inside an intact advance rather than either a breakout or a breakdown: Mansfield RS is +18.66% versus the S&P/ASX 200 and OBV is in accumulation on both frames, but MACD crossed down on September 2, a bearish RSI divergence is flagged into the September 10 high, and ADX at 19.2 says the move has no directional conviction behind it right now.
Snapshot as of September 11, 2026
| Item | Value | Reading |
|---|---|---|
| Close | $1.545 | −10.2% from 52w high, +65.2% above 52w low |
| 52-week range | $0.935 – $1.72 | Upper third of the yearly range; the high dates from January 21, 2026 |
| SMA 5 / 20 / 60 | $1.552 / $1.538 / $1.282 | Rising longer averages, but the close is 0.45% below SMA5; +0.44% above SMA20 and +20.5% above SMA60 |
| Bollinger (20) | $1.704 / $1.538 / $1.372 | Band width 21.56%; price sits on the mid-band, roughly mid-channel |
| aVWAP (2y anchor) | $1.313 (Jan 29, 2026) | Price is 17.7% above the volume-weighted average since the January peak |
| aVWAP (90d anchor) | $1.326 (Jun 11, 2026) | Price is 16.5% above the short-term average, anchored on the June low |
| RSI(14) | 56.0 | Neutral-firm (2y frame 56.0), but a bearish divergence is flagged on both frames |
| Mansfield RS (vs the S&P/ASX 200) | +18.66% | Outperforming; +17.66 points over a month from +1.00, but −1.73 points over the past week |
| MACD(12,26) | 0.064 / signal 0.077 | Dead cross of September 2 still in force; histogram −0.013 |
| ADX(14) | 19.2 | Ranging — below the 20 threshold (2y frame 18.9) |
| ATR(14) | $0.084 (5.43%) | Wide daily range for a $1.55 stock — the 2×ATR band spans 10.9% of price |
| OBV | 2y: 148,856,929 vs MA20 123,202,892 — above, rising (+20.82% spread) · 90d: −47,925,374 vs MA20 −73,579,411 — above, rising (+34.87% spread) | Accumulation tag on both frames; no OBV divergence flagged (field is null on both) |
| Volume (last session) | 9,084,355 vs 11,434,734 avg (0.79×) | Below average — the pause is happening on lighter turnover |
| Unfilled gaps | $1.42 – $1.48 · $1.255 – $1.305 | Two open beneath price (Aug 20, 2026 and Aug 6, 2026) |
| 1×ATR / 2×ATR levels | $1.461 / $1.377 | 2×ATR = technical invalidation level (−10.9% from close) |
① Price & Moving Averages
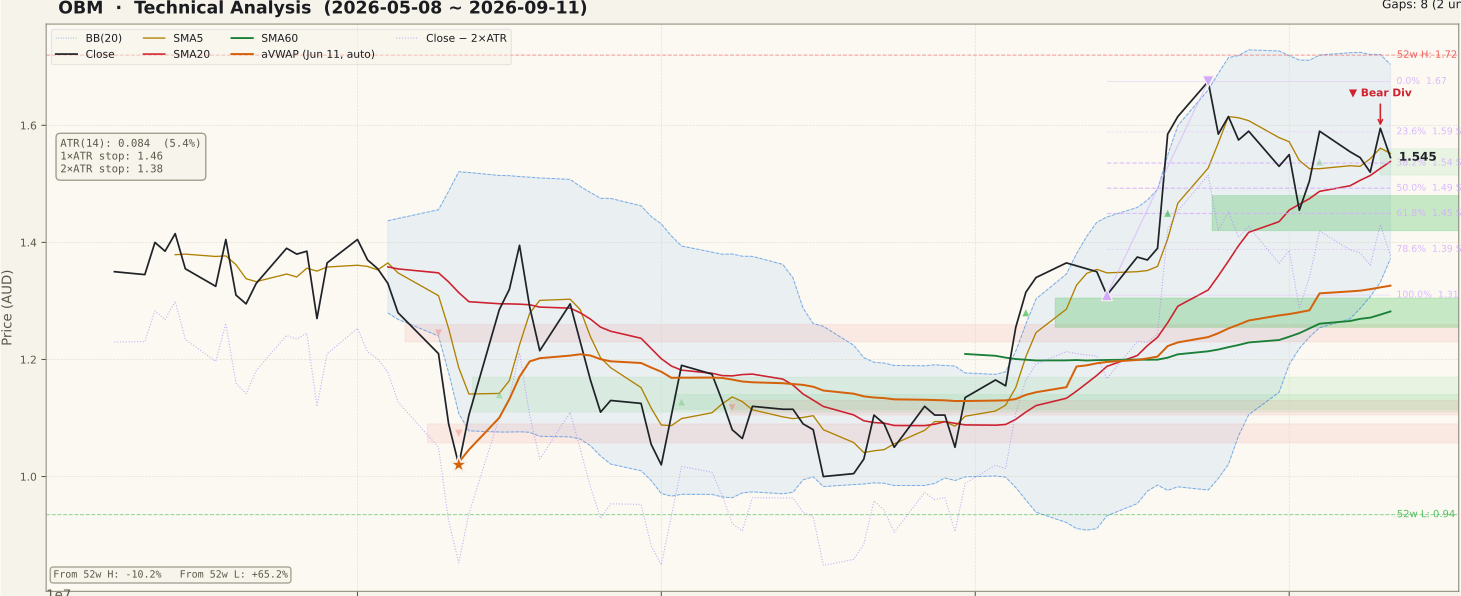
OBM_price-90d-2026-09-13.svgThe longer averages remain stacked the right way up — SMA20 $1.538 well above SMA60 $1.282, with the close 20.5% clear of the 60-day line — so the two-year uptrend that began at the June low is structurally intact. What has changed is the short end: at $1.545 the close is 0.45% below SMA5 $1.552 and only 0.44% above SMA20, which is the signature of a flat consolidation rather than a trend in motion. The Fibonacci grid is anchored on the August 14 low $1.31 and the August 24 high $1.675, and price is holding just above the 38.2% retracement at $1.536 — a shallow give-back, not a structural one; the 50% and 61.8% levels sit lower at $1.492 and $1.449. Bollinger width of 21.56% with price pinned to the mid-band at $1.538 describes a mid-channel balance: the upper band $1.704 is near the 52-week high, the lower band $1.372 sits almost exactly on the 2×ATR invalidation reference. Two unfilled gaps remain open below — $1.42–$1.48 from August 20 and $1.255–$1.305 from August 6 — and on the ASX those vertical moves in small and mid-cap resources names are commonly associated with announcement-driven sessions or trading halts, so the blank space is not a data fault.
② Volume

OBM_volume-90d-2026-09-13.svgThe closing session traded 9,084,355 shares against a 20-day average of 11,434,734 — a ratio of 0.79×. That is the most important qualifier on the week: the September 10 push of +4.93% came on only 0.68× the average, which is precisely the volume-unconfirmed advance that beginners most often read as strength, and the following session gave back −3.13%. One outsized bar does sit in the recent record — September 4 closed +5.65% on 4.63× the 20-day average — but it is the sixth session back, outside the five-session window this review treats as current, and no catalyst for it was identified in public sources; it is recorded here as fact, not as an interpretation. For context, the August 11 and August 20 sessions were materially heavier still, so the current consolidation is being built on distinctly lighter turnover than the advance that produced it. Volume itself is adequate for a stock of this size, so the volume-derived readings below carry normal weight rather than the reduced weight a thinly traded name would warrant.
③ MACD

OBM_macd-90d-2026-09-13.svgMACD is the clearest bearish item on the page. The line sits at 0.064 beneath its signal at 0.077, leaving the histogram at −0.013 after a dead cross dated September 2. Two qualifications matter. First, the cross happened well above the zero line, which is characteristic of a pause inside an uptrend rather than a trend reversal — a cross far below zero would be the more serious configuration. Second, the histogram is shallow and the two lines are close together, so the condition is fragile in both directions: a couple of firm closes would flip it, and a couple of soft ones would widen it. Taken with ADX below 20, the honest reading is momentum that has gone flat, not momentum that has turned down.
④ RSI

OBM_rsi-90d-2026-09-13.svgRSI(14) reads 56.0 on the 90-day frame and 56.0 on the two-year frame — mid-range, neither stretched nor washed out. The notable item is the flagged bearish divergence: the first peak is August 10 at a close of $1.365 with RSI 67.65, the second is September 10 at $1.595 with RSI 61.93. Price made the higher high while the oscillator made the lower one, which is the textbook pattern for a tiring advance. The discipline a newer chart reader most often skips is the second half of the rule: a divergence marks possibility, not a confirmed top, and it is only resolved one way or the other by what price does next — it is routinely negated when an advance resumes and RSI simply pushes past the earlier reading. Here the divergence is live but unconfirmed, because the structure beneath it has not broken.
⑤ Mansfield Relative Strength

OBM_rs-90d-2026-09-13.svgMansfield RS versus the S&P/ASX 200 stands at +18.66%, firmly above the zero line, and the reading is anchor-free so it is identical on both frames. The month-over-month comparison is the strongest number on this page: RS was +1.00% a month ago, so the stock has added 17.66 points of relative performance — positive territory and accelerating. The week-over-week comparison goes the other way: RS was +20.39% a week ago, a change of −1.73 points, which in positive territory is slowing outperformance, not deterioration. Note the tension with the JSON's own slope tag of "rising", which is computed over a longer window than one week — the two are describing different horizons rather than contradicting each other, and the weekly fade is consistent with a consolidation giving back a little ground while the index holds steady.
⑥ ATR & ADX

OBM_atr_adx-90d-2026-09-13.svgATR(14) is $0.084, or 5.43% of the close — a wide true range that has a direct consequence: the objective 2×ATR technical invalidation level sits at $1.377, 10.9% below the close, and the 1×ATR reference at $1.461 is already 5.4% away. Volatility of that magnitude means position sizing, not level selection, does most of the risk work here. ADX(14) at 19.2 (18.9 on the two-year frame) is below the 20 threshold, which classifies the tape as ranging. That is worth dwelling on, because the moving-average stack and the relative-strength reading both look like a trend while ADX says directional conviction has drained out of it — the August advance was strong, but the last fortnight has not been. ADX measures strength without direction, so a low reading here is neutral information, not bearish information.
⑦ On-Balance Volume

OBM_obv-90d-2026-09-13.svgOBV agrees on both frames, which is the most constructive alignment on the page. On the two-year frame it reads 148,856,929 against a 20-day average of 123,202,892 — above its average and rising, tagged accumulation, with the value sitting 20.82% clear of that average. On the 90-day frame the series is windowed and therefore negative in absolute terms — −47,925,374 against a −73,579,411 average — but the relationship is the same: above, rising, accumulation, a 34.87% spread. Two cautions. That spread figure is the distance between OBV and its own 20-day average, a measure of accumulation intensity — it is not a divergence reading, despite the similar name. And the dedicated divergence field is null on both frames, so no OBV divergence is flagged here; the bearish divergence discussed above belongs to RSI alone, and the two oscillators are pointing different ways. That disagreement is recorded as it stands rather than resolved in either direction.
Bull Case vs Bear Case
Bull Case
- Longer averages remain stacked — SMA20 $1.538 above SMA60 $1.282, with the close 20.5% clear of the 60-day line.
- Mansfield RS +18.66% versus the S&P/ASX 200, up 17.66 points in a month from +1.00% — positive and accelerating on the monthly horizon.
- OBV is above its 20-day average and rising on both frames, tagged accumulation (+20.82% two-year, +34.87% 90-day spread).
- Price holds well above both volume-weighted anchors — 17.7% over the January aVWAP $1.313 and 16.5% over the June aVWAP $1.326, so there is little trapped overhead supply from those anchors.
- The give-back since August 24 has reached only the 38.2% retracement at $1.536, leaving the 50% and 61.8% levels untouched.
- Two unfilled gaps below — $1.42–$1.48 and $1.255–$1.305 — leave defined structure beneath the current range.
Bear Case
- MACD dead cross of September 2 is still in force, histogram −0.013 and the line below signal (0.064 vs 0.077).
- Bearish RSI divergence flagged on both frames: close $1.365 / RSI 67.65 on August 10 against $1.595 / RSI 61.93 on September 10.
- The close is 0.45% below SMA5 and the final session was −3.13% — the September 10 attempt failed within the same week.
- ADX 19.2 is below 20: the tape is ranging, with no directional conviction behind the August advance.
- No volume confirmation on the recent upside — September 10's +4.93% came on 0.68× average volume and the closing session on 0.79×.
- ATR 5.43% of price puts the 2×ATR invalidation reference 10.9% away, and weekly RS change of −1.73 points shows outperformance slowing.
Scenarios
| Scenario | Probability | Path | Trigger / Invalidation |
|---|---|---|---|
| Range continuation | 50% | Price oscillates between the $1.536–$1.538 confluence and the $1.589 Fibonacci 23.6% level while ADX stays under 20 and the MACD histogram grinds back toward zero. | Holds while closes stay inside that band; resolved once either edge is taken with volume above the 11.4m average. |
| Advance resumes | 30% | Reclaim of SMA5 $1.552 and then $1.589 opens the August 24 high $1.675, with the upper Bollinger band $1.704 and the 52-week high $1.72 above that. | Needs a close above $1.589 on above-average volume, which would also negate the RSI divergence; a MACD golden cross would corroborate. |
| Deeper retracement | 20% | Loss of the $1.536 / SMA20 shelf exposes the 50% level $1.492, the 61.8% level $1.449 and the unfilled August 20 gap at $1.48–$1.42. | Triggered on consecutive closes below $1.536; the 2×ATR technical invalidation level $1.377 marks where the August structure no longer stands. |
Key Levels & Volatility References
| Level | Role | Basis | Distance |
|---|---|---|---|
| $1.675 | Resistance | August 24, 2026 swing high and Fibonacci 0% anchor — the same area as the late-January closing high | +8.4% |
| $1.589 | Resistance | Fibonacci 23.6% of the August 14 → August 24 swing; price is now beneath it | +2.8% |
| $1.552 | Resistance | SMA5 — the nearest moving average above price | +0.45% |
| $1.545 | Current | September 11, 2026 close | — |
| $1.538 – $1.536 | Support | SMA20 and Bollinger mid-band, overlapping the Fibonacci 38.2% retracement | −0.4% to −0.6% |
| $1.492 | Support | Fibonacci 50% of the August swing | −3.4% |
| $1.377 | Invalidation | 2×ATR below the close (ATR $0.084) — also the lower Bollinger band at $1.372 | −10.9% |
What to Watch
- Whether the $1.536–$1.538 confluence (Fibonacci 38.2%, SMA20, Bollinger mid-band) holds on a closing basis — it is the thinnest shelf on the chart, and three references share it.
- The MACD histogram: −0.013 is shallow enough that it resolves quickly either way, and a fresh golden cross would repair the September 2 signal.
- Volume on any move above $1.589 — without a reading above the 11,434,734 average it repeats the unconfirmed pattern of September 10.
- Whether the bearish RSI divergence is negated by RSI pushing past 61.93 on a higher close, or confirmed by price failing beneath $1.595.
- Mansfield RS week over week: the −1.73-point fade from +20.39% is the first relative-strength softening in a month.