Benz Mining Corp.
This analysis is based on closing-price data as of August 28, 2026. Whether you're researching Benz Mining Corp. (BNZ) on the ASX or learning how to read stock charts, here are objective support, resistance and technical invalidation levels built from the RSI, MACD and ATR indicators.
Benz Mining Corp. finished the week at $4.22, just 2.8% under the $4.34 52-week high — a high that printed intraday during that same August 28 session — and 278.5% above the $1.12 low at the other end of the range. The two-year chart is one of the steepest re-ratings on this screen: price traded in cents through late 2024 and climbed through a chain of unfilled support gaps between $0.11 and $2.25 across 2025 and the first half of 2026. Mansfield relative strength against the S&P/ASX 200 reads +85.5% and ADX sits near 52 on both timeframes, which together describe an unusually strong and well-established trend. One session dominates the past week and it was event-driven: on August 24 the close jumped 14.3% to $4.24 after the company announced an A$150m placement priced at A$3.71 per CDI — a nil discount to the August 21 close of $3.71 — alongside high-grade drill results from the Icon deposit at its Glenburgh gold project, with proceeds allocated to an expanded drill programme working toward a maiden Mineral Resource Estimate in H1 2027. Two structural facts sit either side of that bar: the moving-average alignment predates it by 23 sessions, and the four sessions after it were quiet.
Snapshot as of August 28, 2026
| Item | Value | Reading |
|---|---|---|
| Close | $4.22 | −2.8% from 52w high · +278.5% from 52w low |
| 52-week range | $1.12 – $4.34 | At the top of a range that has almost quadrupled in a year; the $4.34 high printed on the Aug 28 session itself |
| SMA 5 / 20 / 60 | $4.18 / $3.95 / $2.96 | Aligned SMA5 > SMA20 > SMA60, close +0.9% above the SMA5 and +42.4% above the SMA60 |
| Bollinger (20) | $4.28 / $3.95 / $3.61 | Band width 17.11% — narrower than a fortnight ago; price is sitting just inside the upper edge |
| aVWAP (2y anchor Nov 6, 2024) | $1.79 | Price 136.2% above — the average position established since late 2024 is deeply onside |
| aVWAP (90d anchor Jun 24, 2026) | $3.19 | Price 32.4% above — no overhead supply shelf from the short-frame anchor either |
| RSI(14) | 66.2 (90d) / 66.1 (2y) | Firm but not overbought; a bearish divergence is recorded on both frames (Jul 28 vs Aug 24 peaks) |
| Mansfield RS (vs the S&P/ASX 200) | +85.5% | Exceptional outperformance; +18.45 on the week and +16.08 on the month — positive and accelerating |
| MACD (12,26,9) | 0.272 / 0.284 / −0.012 | Dead cross Aug 14, 2026, but the two lines are now only 0.012 apart and both sit far above zero |
| ADX(14) | 51.9 (90d) / 51.4 (2y) | Strong — more than double the 25 threshold on both frames |
| ATR(14) | $0.268 (6.36%) | Very high — a 6.4% average daily range places every volatility-derived reference far from price |
| OBV (2y / 90d) | early accumulation / accumulation | Both above their MA20; 2y flat with +4.24% spacing, 90d rising with +25.42%. Bullish divergence recorded on both frames |
| Volume vs 20d avg | 1.34× | 1,452,482 shares against a 1,088,067 average — the heaviest of the four post-announcement sessions |
| Retracement grid (90d) | $3.55 – $2.35 | Up-swing anchored Jul 17 low $2.35 to Jul 28 high $3.55; price trades above the entire grid, so it sits beneath as deeper structure |
| Unfilled gaps | $2.25–$2.20 | Jun 24, 2026 support gap, 47% beneath the close; nine older gaps sit between $0.11 and $1.23 |
| 1×ATR / 2×ATR technical invalidation | $3.95 / $3.68 | Volatility-based structural references, 6.4% and 12.7% below the close |
① Price & Moving Averages
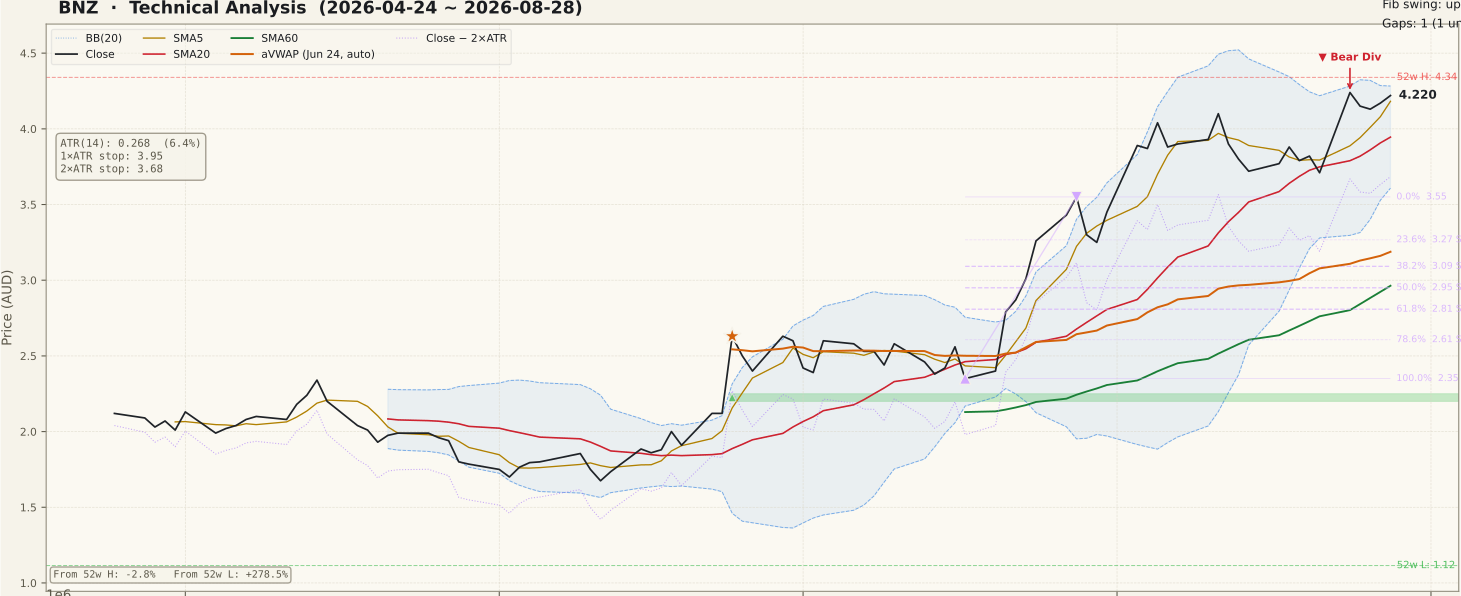
BNZ_price-90d-2026-08-30.svgThe $4.22 close sits 0.9% above the SMA5 at $4.18, 7.0% above the SMA20 at $3.95 and 42.4% above the SMA60 at $2.96 — the textbook upward alignment, SMA5 above SMA20 above SMA60, with all three rising. That alignment is worth dating precisely, because it is the structural fact of this chart rather than a product of last week's news: on the daily closing series the SMA5 > SMA20 > SMA60 order has held continuously since the July 22 close, 28 sessions through the basis date and 23 sessions before the August 24 bar. The distance between the SMA20 and the SMA60 — $0.98, or 33% of the SMA60 value — is the arithmetic signature of a vertical move, and averages that far apart converge either by price pausing or by price retracing.
The August 24 session needs stating plainly. It closed at $4.24, up 14.3% from the $3.71 close of August 21, and it was event-driven: the company announced an A$150m placement priced at A$3.71 per CDI — a nil discount to that $3.71 August 21 close — together with high-grade drill results from the Icon deposit at its Glenburgh gold project, with the proceeds directed to an expanded drill programme aimed at a maiden Mineral Resource Estimate in H1 2027. That single bar accounts for most of the week's advance, and no chart pattern predicted it. What the price series does show is the four sessions that followed: closes of $4.15, $4.13, $4.17 and $4.22 — a nine-cent band, well inside one ATR of $0.268 — so the move was neither extended nor given back.
Bollinger Bands frame $3.61 to $4.28 around a $3.95 mid with band width at 17.11%, and the close sits just under the upper edge rather than outside it. Both anchored VWAPs are far below the market: $1.79 on the two-year anchor of November 6, 2024, and $3.19 on the 90-day anchor of June 24, 2026, so neither anchor leaves an overhead supply shelf. The 90-day retracement grid runs from the July 17 low of $2.35 to the July 28 high of $3.55 and price now trades above the whole grid, which puts the 0% anchor at $3.55 underneath as the nearest structural shelf rather than overhead resistance, with 23.6% at $3.27 and 38.2% at $3.09 below that.
② Volume

BNZ_volume-90d-2026-08-30.svgFriday traded 1,452,482 shares against a 20-day average of 1,088,067 — a Vol/Avg ratio of 1.34×, moderately above normal and the heaviest of the four sessions since the announcement (1,139,209, then 790,252, then 904,607, then 1,452,482). Turnover through that stretch decayed and then picked up again into the basis date, which is the profile of digestion rather than of a one-day spike being unwound.
The counter-intuitive detail is the announcement session itself. August 24 traded 1,448,908 shares for its 14.3% advance — roughly 1.33× the 20-day average, and lighter than either of the two sessions immediately before it, which turned over 2,207,184 and 2,239,569 shares on August 20 and 21. Those two pre-announcement bars are the heaviest of the entire 90-day window, and the second of them closed at $3.71, near the low of its range. A large price move on volume that does not exceed the days preceding it is a caution flag on the usual "volume confirms the move" reading: the repricing came from the announcement rather than from a surge of turnover.
One market-specific caveat applies with force here. This is a gold explorer, and ASX explorers and developers reprice on drilling and resource announcements rather than on chart mechanics; ASX small and mid caps also routinely enter trading halts of a couple of days around capital raisings, which leaves gaps and blank stretches in the volume record that are procedural rather than data errors. Volume analysis on this cohort carries less information than it does on an industrial name.
③ MACD

BNZ_macd-90d-2026-08-30.svgMACD reads 0.272 against a signal line of 0.284, leaving a histogram of −0.012. The last recorded cross is the dead cross of August 14, 2026 — which occurred ten days before the announcement bar, during the mid-August drift. Both lines remain a long way above zero, so what the panel describes is a loss of upward acceleration inside positive momentum, not a shift into negative momentum.
The magnitude matters as much as the sign. At −0.012 the histogram is barely negative — the two lines are effectively together, and a gap that narrow is closer to a pending re-cross than to an established downtrend in momentum. Dead crosses far above the zero line behave differently from those near it: above zero the more common resolution is a pause that lets the averages converge, whereas a cross that drags both lines through zero is the version associated with a trend change. The panel is nowhere near that. The honest qualification is that the histogram has not yet turned positive, so the improvement remains a convergence rather than a confirmed re-acceleration.
④ RSI

BNZ_rsi-90d-2026-08-30.svgThe RSI reads 66.2 on the 90-day frame and 66.1 on the two-year frame — firm, above the 50 pivot, and still below the 70 overbought threshold despite a 14.3% single-session advance in the past week. That is a less stretched reading than a casual look at the price panel would suggest.
A regular bearish divergence is recorded on both timeframes, and the two peaks are supplied. The first is July 28, 2026 at a price of $3.55 with the RSI at 76.48; the second is August 24, 2026 at a price of $4.24 with the RSI at 68.11. Price therefore made a higher high of 19.4% between the two points while the oscillator made a lower high, 8.37 points weaker — the classic pattern. Two qualifications belong alongside it. First, a divergence signals the possibility of a reversal, not its confirmation; until price reverses and structure breaks, it remains an unconfirmed warning. Second, and specific to this chart, the second divergence peak is the announcement session itself, so the momentum reading being compared is one produced by a corporate event rather than by the accumulated trend — a mechanical divergence whose second leg has a known external cause.
The two-year panel gives context: the oscillator has spent most of the past twelve months above 50, with brief excursions toward 30 at each consolidation, which is what a persistent uptrend looks like on a 14-period oscillator.
⑤ Mansfield Relative Strength

BNZ_rs-90d-2026-08-30.svgMansfield RS against the S&P/ASX 200 stands at +85.5%, tagged outperform. That is an exceptional level — it says the stock has outrun the index by a wide margin over the measurement window, and the two-year panel shows the line climbing from around zero in mid-2025 to its present position without a sustained break lower. On this week's screen it is the strongest relative reading in the universe.
The direction is positive on both horizons. A week ago the reading was +67.02% and a month ago +69.39%, which makes the change +18.45 on the week and +16.08 on the month. In positive territory a positive change is acceleration, so the four-quadrant reading is positive and accelerating on both the weekly and the monthly comparison. One inconsistency deserves flagging rather than smoothing over: the JSON tags the recent slope as falling even though both the week-on-week and month-on-month comparisons are firmly positive. The two are measured over different spans, and the level plus the two dated comparisons are the more reliable evidence — but readers should note that the most recent readings are not uniformly rising.
The caution attached to a number this high is not that it is wrong but that it is extended. Relative strength near +85% has a long way it can fall before it stops describing outperformance, and part of the latest acceleration comes from the single announcement bar rather than from a steady grind against the index.
⑥ ATR & ADX

BNZ_atr_adx-90d-2026-08-30.svgATR(14) is $0.268, or 6.36% of price, and it sizes every volatility-derived reference on this page. One ATR below the close sits at $3.95 and the 2×ATR technical invalidation level at $3.68, which is 12.7% beneath the close. A structure that wide is the direct cost of a stock that has nearly quadrupled in twelve months: ordinary daily noise on this name covers a range that would represent a decisive break on a large-cap.
There is a useful confluence at the 1×ATR line. The $3.95 reference sits essentially on top of the SMA20 at $3.9455, which is also the Bollinger mid-line — three independent constructions landing on the same figure, which makes $3.95 the single most important intermediate level on the chart. The 2×ATR invalidation at $3.68 then sits just above the lower Bollinger Band at $3.61 and above the $3.55 swing-high shelf, so the volatility line and the nearest structural shelf are close but distinct.
ADX(14) reads 51.9 on the 90-day frame and 51.4 on the two-year frame — more than double the 25 threshold that marks an established trend, and among the highest readings this screen produces. ADX measures strength, not direction, so a reading this high says only that whichever way price has travelled, it has travelled with conviction. Trends registering ADX above 50 are historically closer to a consolidation phase than to the beginning of a move, because the indicator measures directional travel that has already happened.
⑦ OBV

BNZ_obv-90d-2026-08-30.svgThe two timeframes agree on direction and disagree on intensity. The 90-day window reads accumulation: OBV at 11,198,031 above a 20-day average of 8,928,247, slope rising, spacing +25.42%. The two-year window reads early accumulation: OBV at 55,850,504 above an MA20 of 53,580,720, spacing +4.24%, but with a flat slope. The difference between +25.42% and +4.24% is a scale effect rather than a contradiction — the two-year series has accumulated across an entire re-rating, so a fortnight of flow barely moves its percentage. Note also that this spacing figure measures OBV against its own moving average and is not a divergence reading, despite the similar wording.
The divergence proper is recorded separately, and on both frames it reads bullish, with the same two dated peaks. The first is August 14, 2026 at a price of $3.72 with OBV at 7,378,975 on the 90-day series; the second is August 21, 2026 at a price of $3.71 with OBV at 8,724,897. Price made a marginally lower close between the two points, 0.3% down, while OBV rose 18.2% — flow building underneath a flat price, which is the constructive form. On the two-year series the same dates read 52,031,448 and 53,377,370.
The two oscillators disagree, and that disagreement is the honest reading of the chart. The RSI records a bearish divergence into the August 24 peak; OBV records a bullish divergence into the August 21 low. They are measured over different pairs of dates and neither is confirmed by subsequent price action. A reader who wants one answer from the divergence section is not going to get it here.
Bull Case
- Moving-average alignment intact and pre-dating the news — SMA5 $4.18 above SMA20 $3.95 above SMA60 $2.96, continuously since the July 22 close, 23 sessions before the August 24 bar.
- Mansfield RS +85.5% versus the S&P/ASX 200, the strongest relative reading on this week's screen, and up 18.45 points on the week and 16.08 on the month.
- ADX 51.9 / 51.4 across the two frames — more than double the 25 threshold, describing a firmly established rather than an emerging trend.
- Both anchored VWAPs sit far below price ($1.79 two-year, $3.19 90-day), so there is no overhead supply shelf from either anchor.
- OBV above its MA20 on both frames with a bullish divergence recorded on both; the 90-day slope is rising with +25.42% spacing.
- The four sessions after the announcement held a nine-cent band ($4.13 to $4.22), well inside one ATR — the move was digested rather than handed back.
Bear Case
- The week's advance is concentrated in a single event-driven bar: August 24 closed +14.3% on a placement and drill-results announcement, not on chart mechanics.
- An RSI bearish divergence is recorded on both frames — Jul 28 ($3.55, RSI 76.48) to Aug 24 ($4.24, RSI 68.11), price 19.4% higher on an 8.37-point weaker oscillator.
- The 14.3% session traded 1,448,908 shares, lighter than the 2,207,184 and 2,239,569 of the two sessions before it — the price move was not confirmed by exceptional turnover.
- MACD remains below its signal line after the Aug 14 dead cross, with the histogram still negative at −0.012.
- ATR at 6.36% of price puts the 2×ATR technical invalidation level 12.7% below the close — a very wide structure to respect.
- Price sits 2.8% under the 52-week high and just inside the $4.28 upper Bollinger Band, with the SMA20 33% above the SMA60 — averages that stretched converge by pausing or by retracing.
Scenarios
| Scenario | Probability | Path | Trigger / Invalidation |
|---|---|---|---|
| Consolidation resolves upward | ~40% | The four-session band above $4.13 persists, price clears the $4.28 upper Bollinger Band and the $4.34 52-week high, the MACD histogram crosses back above zero and relative strength extends from +85.5%. | Trigger: a daily close above $4.34 on above-average volume. Invalidated by a daily close back beneath the $3.95 SMA20 / Bollinger mid confluence. |
| Range-building beneath the high | ~40% | The announcement gain is retained but not extended; price oscillates between the $4.18 SMA5 and the $3.95 SMA20 while the averages catch up, the RSI divergence resolves sideways and the MACD lines re-cross without a new high. | Trigger: continued closes inside $3.95–$4.34. Resolved upward by a close above $4.34; resolved downward by a close under $3.95. |
| The event bar is retraced | ~20% | The RSI bearish divergence is confirmed by price, the $3.95 confluence fails, and the market works back toward the pre-announcement $3.71 area, the $3.68 invalidation level and the $3.61 lower Bollinger Band, with the $3.55 July 28 swing high as the deeper shelf. | Trigger: a daily close below $3.95. Structure described above ends on a daily close beneath the 2×ATR technical invalidation level at $3.68. |
Key Levels & Volatility References
| Level | Role | Basis |
|---|---|---|
| $4.34 | Resistance | 52-week high, printed intraday on the Aug 28, 2026 session — 2.8% above the close |
| $4.28 | Resistance | Upper Bollinger Band (20, 2σ), 1.5% above the close; band width 17.11% |
| $4.22 | Current close | Aug 28, 2026 close on 1.34× the 20-day average volume |
| $4.18 | Support | SMA5, rising — the close is 0.9% above it, the first fast average beneath price |
| $3.95 | Support | Three-way confluence: SMA20 $3.9455, Bollinger mid-line and the 1×ATR volatility reference $3.952 — 6.4% below the close |
| $3.68 | Invalidation | 2×ATR technical invalidation level, 12.7% below the close and just above the $3.61 lower Bollinger Band |
| $3.55 | Support | Jul 28, 2026 swing high and the 0% anchor of the 90-day up-swing — the deeper structural shelf |
What to Watch
- Whether the $4.13–$4.22 band of the four post-announcement sessions persists. Repricing on a corporate announcement is a step change; whether it becomes a base or a spike is decided by how long price stays there, not by the size of the bar.
- The $3.95 confluence where the SMA20, the Bollinger mid-line and the 1×ATR reference meet. It is the level at which the pre-announcement structure and the post-announcement structure would become the same chart again.
- Volume character — whether turnover settles back toward 1.0× with price steady, or whether the 2.2 million-share sessions of August 20 and 21 reappear on down bars. The first is digestion; the second is visible supply.
- The MACD histogram at −0.012: a cross back above zero would confirm the convergence that has been running since the August 14 dead cross, while a widening negative reading alongside the RSI divergence would give that divergence its confirmation.
- Mansfield RS at +85.5%: how much of the +18.45 weekly gain survives once the announcement session rolls out of the comparison window is the cleanest test of whether the leadership is structural or event-supplied.