Benz Mining Corp.
This analysis is based on closing-price data as of August 21, 2026. Whether you're researching Benz Mining Corp. (BNZ) on the ASX or learning how to read stock charts, here are objective support, resistance and technical invalidation levels built from the RSI, MACD and ATR indicators.
Benz Mining Corp. closed the week at $3.71, some 14.0% below the $4.32 52-week high set on August 4, 2026 and 237.3% above the $1.10 low that anchors the other end of the range. The two-year chart is one of the steepest advances on this screen: price spent late 2024 trading in cents, worked through a chain of unfilled gaps from $0.61 to $2.25 across 2025 and the first half of 2026, and re-rated again through July and early August. Mansfield relative strength versus the S&P/ASX 200 sits at +66.6% and ADX at roughly 50 — both readings describe an unusually strong, well-established trend. What has changed is the last two weeks: the close is back beneath both the SMA5 and the SMA20 for the first time since the August surge, MACD crossed down on August 14, and relative strength has eased from +70.3 a week ago. This is a pullback inside an intact uptrend, not a broken chart — but it is being measured against an ATR of 7.0% of price, which makes every level on this page a wide one.
Snapshot as of August 21, 2026
| Item | Value | Reading |
|---|---|---|
| Close | $3.71 | −14.0% from 52w high · +237.3% from 52w low |
| 52-week range | $1.10 – $4.32 | Upper quarter of a range that has more than quadrupled in a year |
| SMA 5 / 20 / 60 | $3.79 / $3.75 / $2.76 | Stack still aligned SMA5 > SMA20 > SMA60, but the close has slipped below the two shorter averages |
| Bollinger (20) | $4.22 / $3.75 / $3.28 | Band width 25.07% — wide; price is mid-band after riding the upper edge in early August |
| aVWAP (2y anchor Nov 6, 2024) | $1.74 | Price 113% above — the average position taken since late 2024 is deeply onside |
| aVWAP (90d anchor Jun 24, 2026) | $3.08 | Price 20.5% above — positioning since the late-June gap is also onside |
| RSI(14) | 57.0 | Neutral-positive; clear of both thresholds, no divergence recorded on either timeframe |
| Mansfield RS (vs the S&P/ASX 200) | +66.6% | Strong outperformance, but −3.75 on the week and −1.52 on the month — positive and slowing |
| MACD (12,26,9) | 0.247 / 0.308 / −0.061 | Dead cross Aug 14, 2026; both lines still well above zero, histogram negative |
| ADX(14) | 50.0 (2y) / 50.6 (90d) | Strong — double the 25 threshold on both frames; a firmly established trend |
| ATR(14) | $0.260 (7.00%) | Very high — a 7% average daily range pushes every volatility-derived level far from price |
| OBV (2y / 90d) | early accumulation / accumulation | Both above MA20; 2y flat with +3.27% divergence, 90d rising with +26.71% |
| Volume vs 20d avg | 2.18× | 2,239,569 shares against a 1,029,635 average — the heaviest session of the 90-day window, on a down day |
| Unfilled gaps | $2.25–$2.20 | Jun 24, 2026 support gap, 39% beneath the close; eight older gaps sit between $0.13 and $1.23 |
| 1×ATR / 2×ATR technical invalidation | $3.45 / $3.19 | Volatility-based structural reference levels, 7.0% and 14.0% below the close |
① Price & Moving Averages
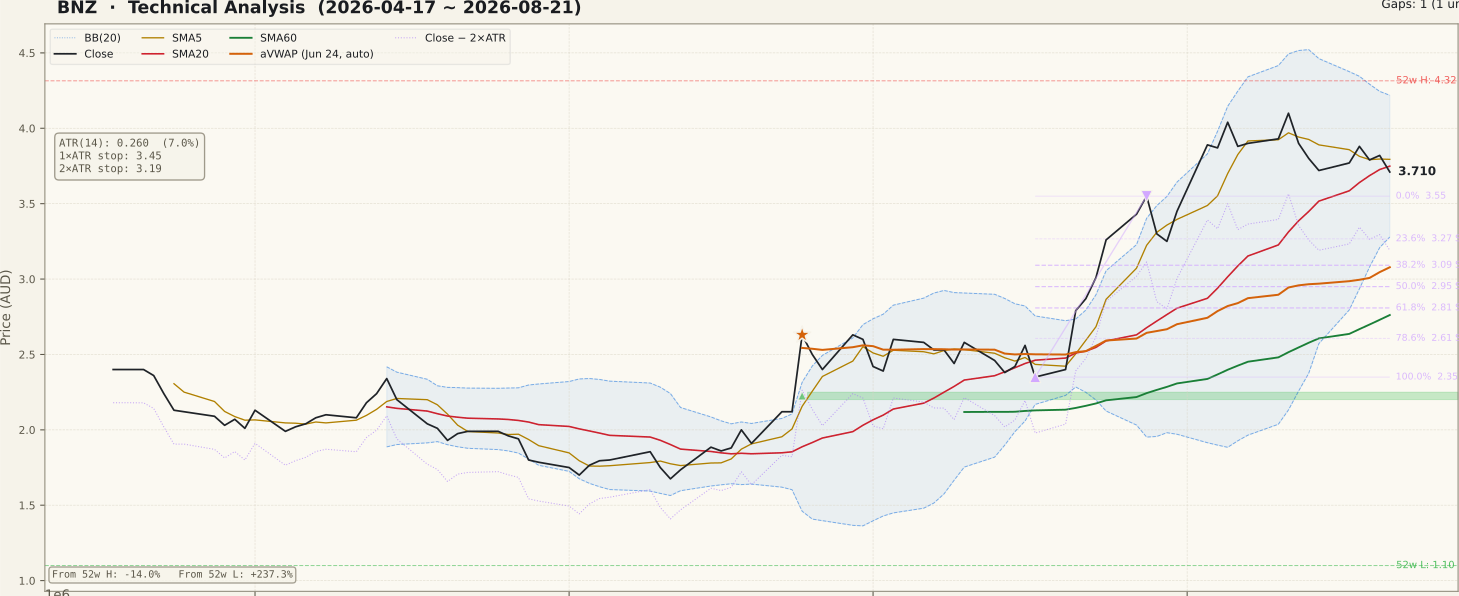
BNZ_price-90d-2026-08-23.svgThe close at $3.71 sits below the SMA5 at $3.79 and the SMA20 at $3.75, while remaining 34% above the SMA60 at $2.76. The order of the averages themselves is unchanged — SMA5 above SMA20 above SMA60, the classic upward alignment — so what the panel shows is price dipping under two fast lines that are still pointing higher, not a stack that has rolled over. The gap between the SMA20 and the SMA60 is the more telling number: $0.99, or 36% of the SMA60 value. Averages that far apart are the arithmetic signature of a vertical move, and they tend to converge either by price pausing or by price retracing.
Bollinger Bands frame the range at $3.28 to $4.22 around a $3.75 mid, with band width at 25.07%. The bands are wide rather than compressed, and price has come off the upper edge it was riding in early August to sit essentially on the mid-line. Both anchored VWAPs are far below the market: the two-year line reads $1.74 (anchored November 6, 2024) and the 90-day line $3.08 (anchored June 24, 2026), so there is no overhead supply shelf from either anchor. The 90-day retracement grid is drawn from the July 17 low of $2.35 to the July 28 high of $3.55, and price has since traded above that 0% anchor entirely — which means the grid now sits underneath as deeper structure rather than overhead, with 23.6% at $3.27, 38.2% at $3.09 and 50% at $2.95. The nearest genuine shelf beneath the close is therefore the $3.55 anchor itself.
② Volume

BNZ_volume-90d-2026-08-23.svgFriday traded 2,239,569 shares against a 20-day average of 1,029,635 — a Vol/Avg ratio of 2.18×, the heaviest single session of the 90-day window. The session before it traded 2,207,184 shares, so this is two consecutive days at roughly double normal turnover rather than one isolated spike.
The awkward detail is what price did on that turnover. The August 21 session closed at $3.71, down from $3.82, having traded as high as $3.93 — a wide range that finished near its low on the biggest volume bar of the window. Heavy volume confirms whichever direction the bar resolves in, and this one resolved down. Set against that, the same panel shows the early-August advance was itself built on above-average bars (August 3 through August 11 all traded between 0.9 and 1.7 million shares), so the trend has not been running on thin turnover. The honest reading is that supply has become visible at the top of the range without yet overwhelming the structure.
One market-specific caveat: this is a resources name, and ASX explorers and developers reprice on drilling and resource announcements rather than on chart mechanics. Volume spikes in this cohort frequently carry news that price data alone cannot identify.
③ MACD

BNZ_macd-90d-2026-08-23.svgMACD crossed below its signal line on August 14, 2026 — MACD 0.247 against a signal of 0.308, with a histogram of −0.061. That is a genuine momentum deterioration and it is the clearest bearish reading on the page. The qualification is equally clear: both lines remain a long way above zero, so what has occurred is a loss of upward acceleration within positive momentum, not a shift into negative momentum.
The distinction matters because MACD dead crosses that occur far above the zero line behave differently from those that occur near it. Above zero, the more common resolution is a pause or a shallow retracement that lets the averages converge, after which the histogram can turn back up without price making a new low. A cross that drags both lines down through zero is the version that marks a trend change, and the panel is not there yet. The histogram has been negative for five sessions and has been narrowing rather than widening — worth watching, because a histogram that turns back toward zero while price stabilises above $3.55 is a materially different chart from one that keeps widening.
④ RSI

BNZ_rsi-90d-2026-08-23.svgThe RSI reads 57.0 on both the two-year and the 90-day frames — above the 50 pivot, nowhere near the 70 overbought line, and nowhere near the 30 oversold line. No divergence is recorded on either timeframe and no divergence peaks are supplied, so there is nothing here to read as exhaustion. Reading peaks into the shape of the line when the field is null is the most common error this indicator invites, and it is not available on this chart.
The 90-day panel gives the sequence: the oscillator pushed into the 70s during the August 3 to August 11 advance, then unwound to the high 50s as price handed back part of that move. A retreat from overbought to the mid-to-high 50s without breaking 50 is textbook trend behaviour rather than a warning — the 50 line is the level that separates a pullback from a reversal on this indicator, and it has not been tested. The two-year panel puts that in context: the RSI has spent most of the past twelve months above 50, with brief excursions into the 30s at each consolidation, which is what a persistent uptrend looks like on a 14-period oscillator.
⑤ Mansfield Relative Strength

BNZ_rs-90d-2026-08-23.svgMansfield RS versus the S&P/ASX 200 stands at +66.6%, tagged outperform with a falling slope. That level is exceptional — it means the stock has outrun the index by roughly two-thirds over the measurement window, and the two-year panel shows the line climbing from below zero through 2025 to its current position without a sustained break lower.
The direction is where the caution sits. A week ago the reading was +70.3% and a month ago +68.1%, so the change is −3.75 on the week and −1.52 on the month. In positive territory a negative change is slowing, not deterioration — the stock is still beating the index, just by a shrinking margin, and the monthly figure shows the loss is recent and concentrated in the last week rather than a month-long fade. This is the single most useful framing on the page: the level says leadership, the slope says the leadership is being tested. Relative strength at this altitude has a long way it can fall before it stops being outperformance, so a further slide would not by itself change the picture; a slide that carried the line back under its own July levels would.
⑥ ATR & ADX

BNZ_atr_adx-90d-2026-08-23.svgATR(14) is $0.260, or 7.00% of price — a very high reading, and the number that sizes every volatility-derived reference on this page. One ATR below the close sits at $3.45 and the 2×ATR technical invalidation level at $3.19, which is 14.0% beneath the close. A structure that wide is the direct cost of trading a stock that has quadrupled in twelve months, and it is the single most important practical fact on the chart: normal noise on this name covers a range that would represent a decisive break on a large-cap.
ADX(14) reads 50.0 on the two-year frame and 50.6 on the 90-day frame — double the 25 threshold that marks an established trend, and among the highest readings this screen produces. ADX measures strength, not direction, so a reading this high simply says that whichever way price has been moving, it has been moving with conviction. Two things follow. First, trends registering ADX above 50 are historically closer to a consolidation phase than to the start of a move, because the indicator is measuring accumulated directional travel that has already happened. Second, the $3.19 invalidation level falls below the entire 90-day trading range and beneath the July 28 swing high at $3.55 — so the volatility-derived line and the nearest structural shelf are two distinct events here, not one, which is unusual and gives the chart a clear intermediate reference.
⑦ OBV

BNZ_obv-90d-2026-08-23.svgThe two timeframes agree on direction and disagree on intensity. The 90-day window reads accumulation: OBV at 8,103,996 above its 20-day average of 6,395,854, slope rising, divergence +26.71%. The two-year window reads early accumulation: OBV at 53,952,322 above an MA20 of 52,244,180, but with a flat slope and a much milder +3.27% divergence.
The divergence between the two figures is a scale effect rather than a contradiction. The two-year OBV series has accumulated across an entire re-rating, so its 20-day average is enormous and a fortnight of flow barely moves the percentage; the 90-day series starts near zero, so the same flow reads as +26.71%. The direction is what matters on the short frame and the slope is what matters on the long one — and the long slope is flat, which is the more sober signal. Flat two-year OBV while price is 14% off its high says flow has stopped adding to the position even though it has not started leaving. The constructive continuation to look for is the two-year slope turning up while price stabilises above $3.55; the warning would be that slope rolling over while the heavy-volume down sessions of the past week repeat.
Bull Case
- Moving-average stack still aligned upward — SMA5 $3.79 above SMA20 $3.75 above SMA60 $2.76, with the close 34% clear of the 60-day line.
- Mansfield RS +66.6% versus the S&P/ASX 200 — among the strongest relative readings on this screen, and positive throughout the past year.
- ADX 50.0 / 50.6 on the two frames — double the 25 threshold, describing a firmly established rather than an emerging trend.
- Both anchored VWAPs far below price ($1.74 two-year, $3.08 90-day) — no overhead supply shelf from either anchor.
- OBV above its MA20 on both timeframes; the 90-day state is accumulation with a rising slope and +26.71% divergence.
- RSI 57.0 has retreated from the August overbought excursion without breaking the 50 pivot — pullback behaviour, not reversal behaviour.
Bear Case
- MACD dead cross of Aug 14, 2026 with the histogram at −0.061 — upward momentum has been lost, even if both lines remain above zero.
- The close has slipped beneath both the SMA5 $3.79 and the SMA20 $3.75 for the first time since the early-August advance.
- The heaviest volume bar of the 90-day window (2.18× average) landed on a down session that closed near its low.
- Mansfield RS has fallen 3.75 points in a week (+70.3% to +66.6%) — still outperformance, but a shrinking margin.
- ATR at 7.00% of price puts the 2×ATR technical invalidation level 14.0% below the close — an extremely wide structure to respect.
- SMA20 $3.75 sits 36% above SMA60 $2.76; averages stretched that far apart converge by pausing or by retracing.
Scenarios
| Scenario | Probability | Path | Trigger / Invalidation |
|---|---|---|---|
| Pullback resolves inside the trend | ~45% | Price stabilises above the $3.55 July 28 swing high, the SMA5 and SMA20 at $3.79/$3.75 are reclaimed, the MACD histogram narrows back toward zero and relative strength re-accelerates from +66.6%. | Trigger: a daily close back above $3.79 on above-average volume. Invalidated by a daily close below $3.55. |
| Deeper retracement to the band floor | ~35% | The August 14 dead cross plays out, $3.55 gives way, and price works down toward the lower Bollinger Band at $3.28 and the 23.6% retracement at $3.27, with the $3.19 invalidation level immediately beneath that pair. | Trigger: a daily close below $3.55. Invalidated by a reclaim of the $3.75 SMA20 and Bollinger mid. |
| Trend structure unwinds | ~20% | The $3.19 level gives way, opening the 38.2% retracement at $3.09 and the 50% at $2.95, with the 90-day aVWAP $3.08 inside that band and the SMA60 $2.76 the deeper reference; relative strength would be expected to break its year-long uptrend alongside. | Trigger: a daily close below the 2×ATR technical invalidation level at $3.19 — that ends the structure described above. |
Key Levels & Volatility References
| Level | Role | Basis |
|---|---|---|
| $4.22 | Resistance | Upper Bollinger Band (20, 2σ); the $4.32 52-week high of Aug 4, 2026 sits just above it |
| $3.79 | Resistance | SMA5 — the first average overhead, reclaimed or not on a daily close |
| $3.75 | Resistance | SMA20 converging with the Bollinger mid-line at the same $3.749 value |
| $3.71 | Current close | Aug 21, 2026 close, on 2.18× the 20-day average volume |
| $3.55 | Support | Jul 28, 2026 swing high; 0% anchor of the 90-day up-swing — the first shelf beneath the close |
| $3.28 | Support | Lower Bollinger Band, converging with the 23.6% retracement at $3.27; the 1×ATR reference sits above at $3.45 |
| $3.19 | Invalidation | 2×ATR technical invalidation level, 14.0% below the close and beneath the whole 90-day range |
What to Watch
- Whether the $3.55 July 28 swing high survives as a shelf — it is the only structural level between the close and the $3.28/$3.27 band-floor confluence, so it carries the whole intermediate structure.
- The MACD histogram at −0.061: narrowing back toward zero while price stabilises is the evidence the Aug 14 cross was a pause; widening while price slips under $3.55 is the evidence it was a turn.
- Volume character — whether the two consecutive 2× sessions are followed by heavy down-bars or by turnover decaying toward 1.0× with price steady. The first is distribution, the second is digestion.
- Mansfield RS versus the S&P/ASX 200: +66.6% now, −3.75 on the week. A further slide still leaves the stock outperforming, but a break of the line's own July levels would end a year-long relative uptrend.
- The two-year OBV slope, currently flat with price 14% off its high — flow that has stopped adding without yet leaving. That slope turning up or rolling over resolves the disagreement between the two timeframes.