AMP Limited
This analysis is based on closing-price data as of September 11, 2026. Whether you're researching AMP Limited (AMP) on the ASX or learning how to read stock charts, here are objective support, resistance and technical invalidation levels built from the RSI, MACD and ATR indicators.
AMP Limited closed the week at $2.46, 1.6% under its $2.50 52-week high and 115.8% above the $1.14 low that anchors the two-year chart. This is a recurring name on the moving-average screen rather than a new one, and the reason is visible in the ordering itself: SMA5 $2.458 above SMA20 $2.41 above SMA60 $2.10, all three rising with the close above every line, an arrangement that has been continuously in place since mid-June rather than formed this week. Behind it is a $1.645-to-$2.46 advance off the July 7 swing low — 49.5% in nine weeks — carried by an ADX of 56.9 and Mansfield relative strength of +44.2% against the S&P/ASX 200, the strongest reading anywhere on the two-year panel. The counterweight has not moved either: momentum is still cooling while price is not. RSI has eased to 63.5 with a bearish divergence flagged against the early-August peak, MACD has sat below its signal line since the August 14 dead cross, and Friday's session printed 0.67× average volume — the lightest participation of the recent sequence at the top of the range.
Snapshot as of September 11, 2026
| Item | Value | Reading |
|---|---|---|
| Close | $2.46 | −1.6% from 52w high · +115.8% from 52w low |
| 52-week range | $1.14 – $2.50 | Near the top of the range; the high sits $0.04 above the close and has not been cleared |
| SMA 5 / 20 / 60 | $2.458 / $2.41 / $2.10 | Rising and correctly stacked; the close is 0.1% above SMA5, 2.2% above SMA20 and 17.3% above the 60-day line |
| Bollinger (20) | $2.51 / $2.41 / $2.30 | Band width 9.0%; the close sits inside the envelope, about 2.2% under the $2.5147 upper band rather than riding it |
| aVWAP (2y anchor Feb 12, 2026) | $1.66 | Price 47.8% above the long-horizon anchored average |
| aVWAP (90d anchor Jul 16, 2026) | $2.25 | Price 9.4% above — the cohort anchored to the mid-July advance remains onside |
| RSI(14) | 63.5 | Back below 70 and below both divergence peaks, with a bearish divergence flagged: $2.42 at RSI 85.58 on Aug 7 versus $2.48 at RSI 69.24 on Sep 10 |
| Mansfield RS (vs the S&P/ASX 200) | +44.2% | Outperforming with a rising slope, and the highest reading on the two-year panel: +0.62 points on the week, +7.89 points on the month |
| MACD (12,26,9) | 0.0743 / 0.0842 / −0.0098 | Dead cross of Aug 14, 2026; histogram still negative, though both lines remain far above zero |
| ADX(14) | 56.9 | Far above 25 — a very strong directional reading (56.8 on the two-year frame) |
| ATR(14) | $0.067 (2.7%) | An ordinary daily range for a liquid ASX financial |
| OBV (2y / 90d) | early accumulation / accumulation | Both frames above their MA20 — gaps of +7.9% and +16.85% — but the two-year slope reads flat while the 90-day slope rises. No OBV divergence is flagged on either frame |
| Volume vs 20d avg | 0.67× | 7,709,461 shares against an 11,529,949 average — a distinctly quiet session near the range high |
| Unfilled gap | $2.19 – $2.25 | Support gap of Aug 6, 2026, still open beneath the current structure |
| 1×ATR / 2×ATR technical invalidation | $2.39 / $2.33 | Volatility-based structural reference levels below the close |
① Price & Moving Averages
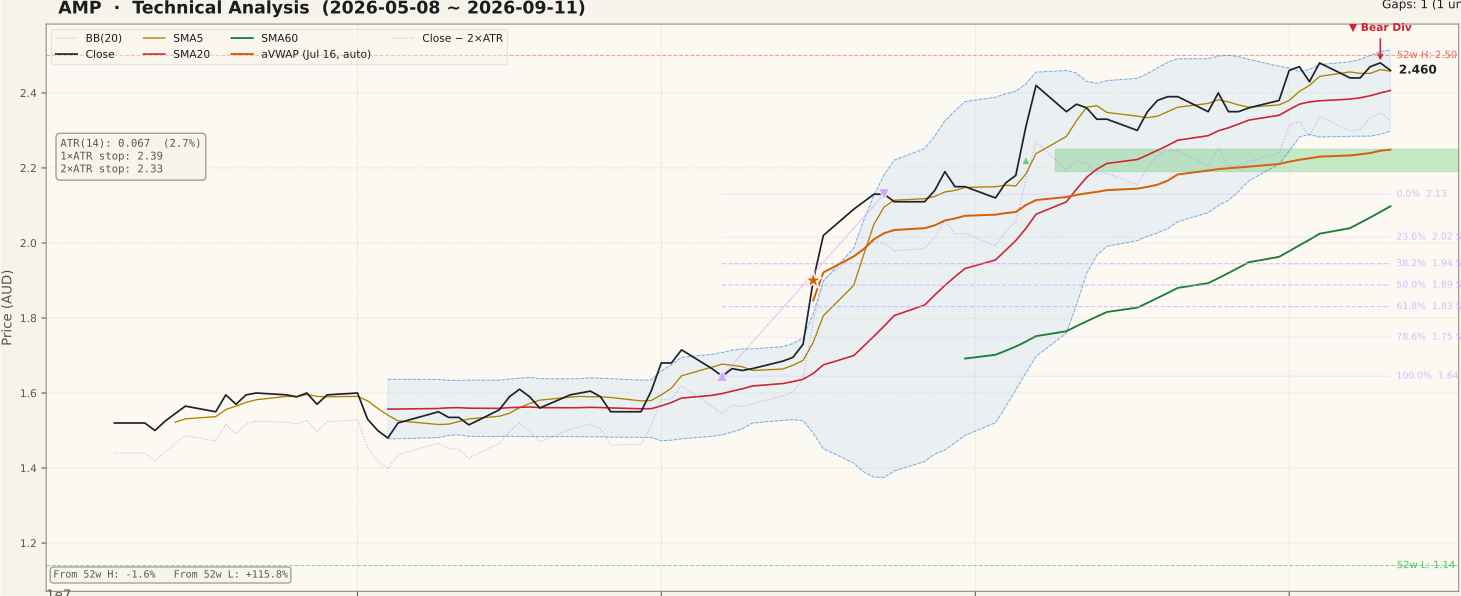
AMP_price-90d-2026-09-13.svgThe two-year frame separates into three regimes. From September 2024 to January 2026 price oscillated inside a broad $1.20–$1.90 band, failing at the upper edge more than once. February 2026 broke that structure vertically, taking price to the $1.14 52-week low — the session the tool also selected as its long-horizon VWAP anchor, February 12, 2026. That event sits roughly seven months behind the current close and is recorded here as chart context only. The third regime is repair and advance: a base through March to June, then a trend from July that has carried price 115.8% above the low and clear of the entire prior range.
The 90-day window isolates that advance and shows why this is a moving-average reading rather than a breakout reading. The stack is old, not new — the close has remained above a rising SMA5, SMA20 and SMA60 continuously since mid-June — and the shape over the last three weeks is a stair-step drift rather than a thrust. Price stepped off the $1.645 swing low of July 7, reached $2.13 by July 23, extended through the unfilled $2.19–$2.25 gap of August 6, and has since worked sideways-to-higher beneath the $2.50 high at the right edge of the panel. Two details temper the picture. The close is 17.3% above SMA60, a wide stretch from the medium-term mean that resolves either through time or through a pullback. And with Bollinger width at 9.0% the close now sits about 2.2% inside the $2.5147 upper band — the band-riding visible in early August has stopped, which reads as a loss of upward pressure rather than as damage to the trend. One structural note: the whole Fibonacci retracement grid, anchored to the July 7–July 23 swing, sits below price — its 0% level at $2.13 is already 13.4% beneath the close, so the grid describes the launch of this leg rather than any nearby shelf.
② Volume

AMP_volume-90d-2026-09-13.svgFriday traded 7,709,461 shares against a 20-day average of 11,529,949 — a Vol/Avg ratio of 0.67×. Price is holding within 1.6% of its 52-week high on roughly two-thirds of normal participation.
This is precisely the trap the volume panel exists to catch, and it is worth stating plainly because the rest of the chart looks strong: a bar that sits at the top of a range on lighter-than-normal turnover has not been confirmed by participation. The wider panel is more constructive — through July and August the heavier bars in the 90-day window consistently accompanied up-days, the signature a genuine markup phase produces, and the two-year panel shows nothing like the single-session spike that marked the February 2026 break. Note also what the thin volume is not: it is not distribution. Distribution would show heavy bars on down-days, and September has produced neither. Quiet drift near a high is most often supply and demand both stepping back, which resolves in whichever direction arrives with volume. A daily close above $2.50 on turnover at or above the 11.5 million average would be the confirmation these sessions have withheld.
③ MACD

AMP_macd-90d-2026-09-13.svgMACD registered a dead cross on August 14, 2026 and has not recovered it. The line reads 0.0743 against a signal of 0.0842, with the histogram at −0.0098. The two-year and 90-day frames agree to three decimal places, so there is no timeframe conflict to resolve.
Where that cross occurred matters more than the label attached to it. Both lines remain far above zero — the cross happened close to the highest MACD readings of the entire two-year window, not beneath the zero line — which makes it a deceleration reading rather than a reversal reading. The 90-day panel shows the histogram expanding through the late-July surge, peaking in early August, and running shallowly negative for about four weeks since, with both lines now sloping down together. That is what a trend produces when it advances more slowly than before: the averages converge because the rate of change fell, not because direction changed. The honest caveat is duration — four weeks of negative histogram while price made higher closes is longer than a one-week pause, and the two lines converging toward zero from above is the path a trend takes when it is ending as well as the path it takes when it is resting. A histogram that deepens while price is beneath the $2.41 SMA20 shelf would be the version of this signal that carries weight.
④ RSI

AMP_rsi-90d-2026-09-13.svgRSI(14) reads 63.5 — neutral-to-firm, below the 70 overbought threshold and well above the 50 line. A regular bearish divergence is flagged on both frames, and the field gives both peaks: $2.42 at RSI 85.58 on August 7, then $2.48 at RSI 69.24 on September 10. Price made the higher high; the oscillator made a markedly lower one.
The divergence is real and should be read for what it is rather than what it might become. A 16-point drop in RSI between two peaks four and a half weeks apart is a large deterioration in the rate of advance, and the second peak of $2.48 was itself rejected — Friday closed $0.02 lower at $2.46. That is the beginner's trap in the other direction, though: a divergence is a statement about momentum, not a confirmed top, and this one is measured from RSI 85.58, a near-blow-off reading that almost any subsequent peak would fail to match. Divergences taken from such extremes are the least reliable variety, and none of the price structure beneath — the $2.41 SMA20 shelf, the $2.33 volatility line — has been broken to confirm it. The reading that would confirm it is a daily close beneath those shelves with RSI slipping under 50.
⑤ Mansfield Relative Strength

AMP_rs-90d-2026-09-13.svgMansfield RS against the S&P/ASX 200 reads +44.2% with a rising slope — the highest value anywhere on the two-year panel, and identical across both frames as the anchor-free construction requires. AMP is not merely rising; it is rising considerably faster than the Australian market.
The rate of that outperformance is the detail worth extracting. RS was 43.61 a week ago and 36.35 a month ago, so the gain is +0.62 points on the week against +7.89 points on the month. Both changes are positive in positive territory, which places the reading in the accelerating quadrant, but almost the entire monthly advance was banked in the earlier weeks — the last week added less than a tenth of it. That is the relative-strength equivalent of what the MACD panel shows: leadership intact, the rate of gain flattening. The two-year panel puts this in context, with RS below zero as recently as March 2026 and stepping decisively above it in July. A deeply negative RS is a warning that overrides bullish signals elsewhere; this is the opposite case, and the leadership reading remains the strongest single argument the chart makes.
⑥ ATR & ADX

AMP_atr_adx-90d-2026-09-13.svgADX(14) reads 56.9 on the 90-day frame and 56.8 on the two-year frame — far above the 25 line that separates a trending market from a range, and among the highest readings visible on either panel. ADX measures strength rather than direction, and here the direction is set by the price panel: this is a strong uptrend by that measure.
ATR(14) is $0.067, or 2.7% of price. The panel shows volatility stepping up sharply with the July advance and staying elevated since, easing only slightly over the past fortnight. Those two numbers set the objective structural references at the foot of this page: 1×ATR beneath the close is $2.39 and 2×ATR is $2.33, the latter 5.4% below the current price and sitting just under the $2.41 SMA20 shelf. That $2.33 line is the technical invalidation level used throughout this analysis — the point at which the July-to-September sequence described in section ① no longer holds its shape. It is worth adding the standard caution about a very high ADX: a reading near 57 describes a trend that is mature and well advanced, not one that is beginning, and elevated ATR means ordinary daily noise is now worth about seven cents.
⑦ OBV

AMP_obv-90d-2026-09-13.svgThe two frames tag differently and both are worth stating. On the 90-day frame OBV is tagged accumulation — above its MA20, slope rising, with the line running +16.85% above that average. On the two-year frame the tag is early accumulation — above MA20 by +7.9%, but with a flat slope. No OBV divergence is flagged on either frame.
Read together, the message is that cumulative flow has supported the advance and has not yet contradicted it. The 90-day panel shows OBV climbing steadily from early July, tracking the price advance step for step, which is the confirmation the volume panel could not supply from a single light session. The flat two-year slope is not a contradiction but a matter of scale: measured across 500 sessions, nine weeks of accumulation registers as a level shift rather than a gradient. One clarification for readers comparing figures: the +16.85% and +7.9% values are gaps between OBV and its own 20-day average — a measure of how stretched flow is from its mean, not a divergence signal. The divergence field itself is empty on both frames, which means the panel offers no support to the bearish RSI reading discussed in section ④.
Bull Case vs Bear Case
Bull Case
- Rising, correctly ordered MA stack in place since mid-June: close $2.46 > SMA5 $2.458 > SMA20 $2.41 > SMA60 $2.10
- Mansfield RS +44.2% vs the ASX 200 — the highest reading on the two-year panel, slope rising (+0.62 week, +7.89 month)
- ADX 56.9 on the 90-day frame and 56.8 on the two-year frame — a strongly directional regime
- OBV above MA20 on both frames (+16.85% and +7.9%), 90-day slope rising, and no OBV divergence flagged
- Price above both anchored VWAPs — $1.66 from the February 12 anchor and $2.25 from the July 16 anchor
- The entire July retracement grid ($2.13 down to $1.645) and the unfilled $2.19–$2.25 gap sit well beneath the close
Bear Case
- Bearish RSI divergence flagged on both frames: $2.42 at RSI 85.58 (Aug 7) versus $2.48 at RSI 69.24 (Sep 10); RSI now 63.5
- MACD below its signal line since the August 14 dead cross — roughly four weeks of negative histogram (−0.0098) against higher closes
- Volume 0.67× the 20-day average (7,709,461 against 11,529,949) — participation is not confirming the range high
- The $2.50 52-week high is still 1.6% overhead and unbroken, with the $2.51 upper Bollinger band capping the same zone
- Band-riding has stopped: the close now sits 2.2% inside the upper band at 9.0% band width, not above it
- Price 17.3% above SMA60 with ADX near 57 — the stretch and the strength both describe a mature move, and the two-year OBV slope is only flat
Scenarios
| Scenario | Probability | Path | Trigger / Invalidation |
|---|---|---|---|
| Trend resolves through the range high | 30% | The four-week coil beneath $2.50 resolves upward, clearing the 52-week high and the $2.51 upper band together and re-opening the band-riding behaviour seen in early August. | Trigger: a daily close above $2.50 on volume at or above the 11,529,949 average. Invalidation: failure back beneath $2.41 within the same week. |
| Pause or shallow retracement inside an intact trend | 45% | Momentum keeps cooling while the trend structure survives: price works between the $2.41 SMA20 shelf and the $2.50 high, letting the moving averages catch up to a close that is 17.3% above SMA60. | Trigger: continued closes between $2.41 and $2.50 with RSI in the 50–70 band. Invalidation: a daily close beneath $2.33. |
| Trend structure breaks | 25% | The RSI divergence and the MACD dead cross receive price confirmation: a close beneath the $2.41 shelf, then the $2.33 volatility line, with the $2.25 aVWAP and the unfilled $2.19–$2.25 gap as the first deep magnets below. | Trigger: a daily close beneath $2.33 on above-average volume. Invalidation: recovery and a close back above $2.41. |
Key Levels & Volatility References
| Level | Role | Distance | Basis |
|---|---|---|---|
| $2.51 | Resistance | +2.2% | Upper Bollinger Band (20) — the close sits inside it rather than on it |
| $2.50 | Resistance | +1.6% | 52-week high, unbroken |
| $2.46 | Current | — | Sep 11, 2026 close on 0.67× average volume; SMA5 $2.458 sits immediately beneath |
| $2.41 | Support | −2.2% | SMA20 and Bollinger mid — the first separated shelf below the close |
| $2.33 | Invalidation | −5.4% | 2×ATR technical invalidation level, just under the SMA20 shelf |
| $2.30 | Support | −6.6% | Lower Bollinger Band (20) |
| $2.25 | Support | −8.5% | Top edge of the unfilled Aug 6, 2026 gap ($2.19–$2.25); the 90-day aVWAP of $2.2489 sits on the same line |
What to Watch
- Volume at the range high. Whether a daily close above $2.50 arrives with turnover at or above the 11,529,949 average. The 0.67× session is the single weakest element of an otherwise strong chart.
- The $2.41 shelf. SMA20 and the Bollinger mid line coincide there. A daily close beneath it is the first price confirmation the flagged RSI divergence has lacked; $2.33 is the volatility-based line beneath that.
- MACD histogram. −0.0098 narrowing back toward zero, or a fresh golden cross with both lines still far above zero, would mark the August pause as consolidation. A deepening histogram alongside a sub-$2.41 close reads the other way.
- Mansfield RS increments. The weekly gain has narrowed to +0.62 points from +7.89 on the month. A flat or negative weekly change would be the first sign the leadership argument is eroding.
- The $2.19–$2.25 gap. Still unfilled from August 6 and coinciding with the 90-day aVWAP — the first deep magnet if the structure gives way.