AMP Limited
This analysis is based on closing-price data as of August 7, 2026. Whether you're researching AMP Limited (AMP) on the ASX or learning how to read stock charts, here are objective support, resistance and technical invalidation levels built from the RSI, MACD and ATR indicators.
AMP closed Friday at $2.42, just 1.2% below a 52-week high of $2.45 that was set in the very same session, and 112.3% above the $1.14 low from earlier in the year. The two-year panel explains why that matters: after a long stretch of range-bound trade and a February breakdown, price has now cleared the entire two-year structure in a 47.1% advance off the July 7 swing low at $1.645, with Mansfield RS at +40.2% versus the S&P/ASX 200 and ADX at 57.3 confirming a genuinely strong directional trend. The cost of that move is extension, and it is not a footnote — RSI(14) at 85.6 has been above 70 for roughly three weeks, Friday's push to the high came on 0.8× average turnover, and the nearest structural support sits in the $2.25–$2.11 band, beneath the $2.27 2×ATR technical invalidation level. The working lens is a confirmed range breakout in a stretched condition: the trend evidence is strong, the margin for error is thin.
Snapshot as of August 7, 2026
| Item | Value | Reading |
|---|---|---|
| Close | $2.42 | −1.2% from 52w high, +112.3% above 52w low |
| 52-week range | $1.14 – $2.45 | Closing at the very top of the yearly range |
| SMA 5 / 20 / 60 | $2.24 / $2.08 / $1.75 | Full bullish alignment, all three rising |
| Bollinger (20) | $2.46 / $2.08 / $1.70 | Band width 36.5% — wide, expanded; close pressing the upper band |
| aVWAP (2y anchor) | $1.54 (Feb 12, 2026) | Price far above the post-breakdown cost basis |
| aVWAP (90d anchor) | $2.11 (Jul 16, 2026) | Short-term cost basis sits inside the July–August shelf |
| RSI(14) | 85.6 | Deeply overbought; bearish divergence flagged (2y frame 85.5) |
| Mansfield RS (vs the S&P/ASX 200) | +40.2% | Outperforming and accelerating (prior week +29.2, prior month +3.4) |
| MACD(12,26) | 0.151 / signal 0.137 | Golden cross printed Aug 6; histogram +0.014 |
| ADX(14) | 57.3 | Strong directional trend (2y frame 56.8) |
| ATR(14) | $0.075 (3.11%) | Elevated daily range for a stock at this price |
| OBV | 2y: above MA20, rising (+25.6%) · 90d: above MA20, rising (+43.4%) | Accumulation on both frames |
| Volume (last session) | 12,195,071 vs 15,240,935 avg (0.8×) | Below-average turnover on the push to the 52-week high |
| 1×ATR / 2×ATR levels | $2.35 / $2.27 | 2×ATR = technical invalidation level (−6.2% from close) |
① Price & Moving Averages
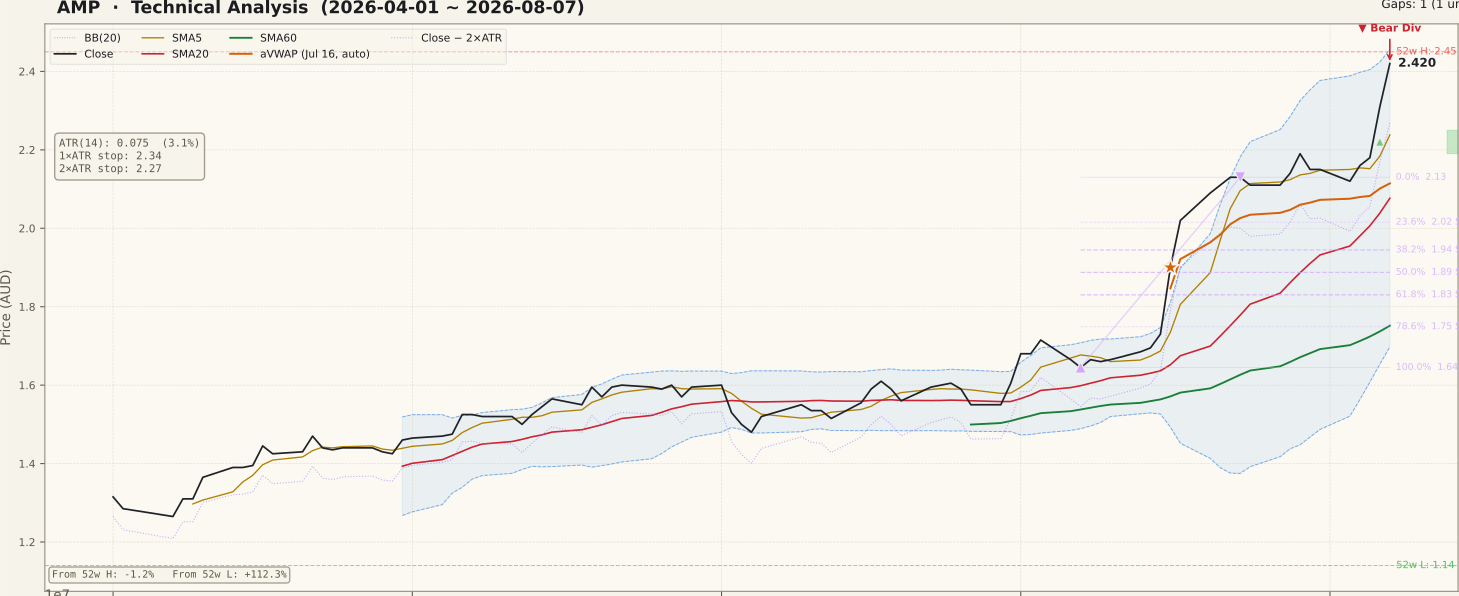
AMP_price-90d-2026-08-09.svgThe moving-average stack is as clean as it gets: close $2.42 above SMA5 $2.24, above SMA20 $2.08, above SMA60 $1.75, with all three curving upward. The 90-day panel shows the shape behind those numbers — a quiet base through April and May, a first thrust from the July 7 swing low at $1.645 to the July 23 high at $2.13, a two-week shelf just under that high, and then a second, steeper leg into Friday's close. On the two-year frame the same advance reads as a structural event rather than a bounce: repeated attempts at the old overhead band through 2025 and early 2026 all failed, February's breakdown carried price to the $1.14 52-week low, and the recovery has now taken price above everything in the two-year window. Bollinger width at 36.5% is very wide and the close is pressing the upper band at $2.46 — band walking of this kind marks strong trends, but it is a late-expansion reading rather than an early one. One caveat on the Fibonacci grid: it is anchored to the July leg ($1.645 → $2.13), and price has since traded well clear of the 0% anchor, so the whole retracement ladder from $2.02 down to $1.645 describes deep-reversion references, not proximate structure. The nearest real structure below is the unfilled $2.19–$2.25 gap left on August 6.
② Volume

AMP_volume-90d-2026-08-09.svgThis is the weakest link in an otherwise strong picture. The final session traded 12,195,071 shares against a 20-day average of 15,240,935 — only 0.8× normal turnover — on the day price tagged a fresh 52-week high. The 90-day panel does show the August 6 session running clearly above its 20-day average line, so the initial break was properly sponsored; it simply did not reach the 2× threshold the chart flags as a spike. The only two flagged spikes in the window sit in mid-July, at the very start of the advance, which is the classic signature of an initiating thrust. A new high made on below-average participation is not fatal on its own — quiet drift higher is common inside strong trends — but it does mean Friday's close carries less confirmation than the price action alone suggests. Turnover of roughly A$29m on the day means liquidity itself is not a concern here; the question is conviction, not tradability.
③ MACD

AMP_macd-90d-2026-08-09.svgMACD sits at 0.151 against a signal line of 0.137, having printed a golden cross on August 6 with the histogram back positive at +0.014. Read plainly, momentum re-accelerated exactly as the breakout occurred, which is what a continuation looks like. The nuance is the altitude: on the two-year panel this is the highest absolute MACD reading of the whole window, far above every prior swing peak, and crosses that occur this far above the zero line say "the trend is already running" rather than "the trend is starting". The panel also shows a brief dead cross in the days just before, so the current signal is a return to positive momentum after a short stall, not an unbroken run. A histogram that keeps expanding would confirm the second leg; a rollover from this altitude would be the first mechanical sign that the August thrust is done.
④ RSI

AMP_rsi-90d-2026-08-09.svgRSI(14) reads 85.6 — not merely overbought but near the top of the indicator's practical range, and the panel shows it has stayed inside the overbought zone for roughly three weeks without a reset. That deserves to be stated plainly rather than explained away: readings above 85 leave very little headroom, and the most common resolutions are a sideways pause or a sharp give-back, not a continued vertical climb. The flagged bearish divergence is specific — on July 22 price printed $2.13 with RSI at 86.46; on August 7 price made a much higher high at $2.42 while RSI managed only 85.55. Honesty about scale matters here: that is a lower momentum high, but the gap is under one RSI point against a 13.6% higher price, so it is a marginal divergence rather than a decisive one. A divergence is a possibility of reversal, not a confirmation, and it needs price follow-through before it counts. The more actionable reading is simpler — the trend is intact, the indicator is stretched, and the risk of paying the highest price of the year is at its maximum precisely here.
⑤ Mansfield RS vs the S&P/ASX 200

AMP_rs-90d-2026-08-09.svgMansfield RS reads +40.2% versus the S&P/ASX 200, and both the 90-day and two-year frames agree on that figure as they must, since the measure is anchor-free. The rate of change is the story: a week ago RS stood at +29.2 and a month ago at +3.4, giving a weekly change of +11.0 points and a monthly change of +36.8. Positive and accelerating is the strongest of the four relative-strength quadrants, and the two-year panel confirms the transition is real — RS spent the March-to-June stretch below zero, crossed into positive territory in early July, and has gone near-vertical since. The caution is symmetrical with everything else on this page: an RS line this steep is a description of a vertical price move, and it flattens when that move pauses. The early warning to watch for is RS stalling while price still makes marginal new highs.
⑥ ATR & ADX

AMP_atr_adx-90d-2026-08-09.svgATR(14) is $0.075, or 3.11% of price, and the panel shows it climbing steeply as the August leg unfolded — daily ranges have roughly doubled from the quiet June condition. ADX at 57.3 on the 90-day frame (56.8 on the two-year frame) is comfortably above the 25 threshold and still rising, which says the directional trend is powerful. Remember ADX measures strength, not direction: a high reading tells you the move is orderly and persistent, not that it will continue. The volatility references derived from ATR are worth reading carefully in this case. The 1×ATR level sits at $2.35 (−3.1% from the close) and the 2×ATR technical invalidation level at $2.27 (−6.2%). Because ATR is measured over fourteen sessions that still include the quiet pre-breakout shelf, that 2×ATR band is unusually tight relative to the current structure — it sits only two cents above the top of the August 6 gap and roughly seven per cent above the July–August consolidation shelf near $2.11. In other words, a pullback that is entirely ordinary in structural terms would still carry price through the volatility line.
⑦ OBV

AMP_obv-90d-2026-08-09.svgOBV is the strongest counterweight to the extension argument. On the 90-day frame it sits at 248,544,232 against a 20-day average of 173,294,237 — a +43.4% spread — in an accumulation state with a rising slope, and the two-year frame agrees: 369,568,862 versus 294,318,867, a +25.6% spread, also rising. Both timeframes therefore point the same way, which is not always the case and adds weight to the reading. Crucially, OBV has made new highs alongside price rather than lagging it, so volume flow is not corroborating the bearish RSI divergence — that matters, because a divergence without a volume-flow confirmation is the weaker of the two. The honest caveat is mechanical: OBV is a running total, so a near-vertical price move drags it upward almost by construction, and a +43.4% spread above its own average is a stretched reading in its own right. A loss of the 20-day average on a down session would remove the main bullish counterweight on this page.
Bull Case
- Mansfield RS +40.2% vs the S&P/ASX 200 and accelerating — +11.0 points in a week, +36.8 in a month.
- Full bullish alignment: close $2.42 > SMA5 $2.24 > SMA20 $2.08 > SMA60 $1.75, all three rising.
- Multi-year range breakout — the close is 1.2% off the 52-week high and there is no overhead chart structure above $2.45 anywhere in the two-year window.
- OBV in accumulation on both frames, above its 20-day average and rising (+43.4% on 90d, +25.6% on 2y), making new highs with price.
- MACD golden cross printed August 6 with the histogram back positive at +0.014, right as the breakout occurred.
- ADX 57.3 and rising — a strong, orderly directional trend, with an unfilled $2.19–$2.25 gap left directly beneath price as first structure.
Bear Case
- RSI(14) at 85.6 — extreme extension, with the indicator parked above 70 for about three weeks and almost no headroom left.
- Bearish RSI divergence flagged: price $2.13 → $2.42 (Jul 22 → Aug 7) while RSI slipped 86.46 → 85.55.
- The push to a new 52-week high came on 0.8× average turnover (12.2m vs 15.2m) — the follow-through session lacked the volume the breakout day had.
- Price is pinned to the upper Bollinger band ($2.46) with band width already at 36.5% — a late-stage expansion reading, not an early one.
- The $2.27 2×ATR technical invalidation level is only 6.2% below the close and sits above the August 6 gap, so even an ordinary reversion to the $2.11 shelf would breach it.
- The move is mature: +112.3% above the 52-week low and +47.1% from the July 7 swing low in about a month, with the whole Fibonacci ladder ($2.02 down to $1.645) far beneath spot.
Scenarios
| Scenario | Probability | Path | Trigger / Invalidation |
|---|---|---|---|
| Digestion — sideways or shallow give-back | 45% | RSI unwinds from 85.6 through time rather than price, or via a drift into the $2.25–$2.11 band where the August 6 gap, the SMA5 and the 90-day aVWAP at $2.11 converge with the July–August shelf. The larger trend stays intact while RS and OBV stay positive. | Daily closes above $2.11 keep this framing; a close back inside the $2.19–$2.25 gap is the first confirmation the August leg is being retraced. |
| Trend continuation — band walk extends | 35% | Price stays above the $2.25 gap top and continues along the upper Bollinger band, clearing $2.45 and $2.46 into open chart space with no two-year overhead structure remaining. | Daily closes above $2.45 with turnover back above the 20-day average; the case weakens on repeated rejections at the high on below-average volume. |
| Sharper mean reversion | 20% | The RSI divergence resolves downward, price loses the $2.11 shelf and unwinds toward the July-leg retracements at $2.02 (23.6%) and $1.94 (38.2%), with the rising SMA20 at $2.08 sitting between them. | A daily close below the $2.27 2×ATR technical invalidation level opens this path; the constructive reading is objectively wrong beneath it. |
Key Levels & Volatility References
| Price | Role | Basis |
|---|---|---|
| $2.46 | Resistance | Upper Bollinger band (20, 2σ) |
| $2.45 | Resistance | 52-week high, set August 7, 2026 |
| $2.42 | Current | Close, August 7, 2026 |
| $2.35 | Volatility reference | 1×ATR below the close (−3.1%) |
| $2.27 | Invalidation | 2×ATR technical invalidation level (−6.2% from close) |
| $2.25 | Support | Top of the unfilled August 6 gap ($2.19–$2.25) |
| $2.11 | Support | 90-day aVWAP (Jul 16 anchor) inside the July–August shelf |
What to Watch
- The $2.19–$2.25 gap. It is the first real structure beneath price. Daily closes above $2.25 keep the breakout reading clean; a close back inside the gap is the earliest evidence the August leg is unwinding.
- Turnover at the highs. Friday's 0.8× reading is the one genuinely weak data point. A move through $2.45 on above-average volume would settle the conviction question; repeated marginal highs on thin participation would argue the opposite.
- How RSI resolves. An unwind from 85.6 through sideways time is trend-friendly; an unwind through price is not. Watch which one the tape chooses over the next fortnight.
- OBV against its 20-day average. The +43.4% spread is the main counterweight to the extension case — losing that average during a down session would remove it and leave the RSI divergence unopposed.
- The slope of Mansfield RS. A weekly change of +11.0 points is acceleration. RS flattening or turning down while price still prints marginal new highs is the earliest signal that leadership is fading.