AMP Limited
This analysis is based on closing-price data as of September 4, 2026. Whether you're researching AMP Limited (AMP) on the ASX or learning how to read stock charts, here are objective support, resistance and technical invalidation levels built from the RSI, MACD and ATR indicators.
AMP Limited closed the week at $2.48, within 0.8% of a $2.50 52-week high and 117.5% above the $1.14 low that anchors the two-year chart. What the weekly screen flagged here is not a fresh event but a durable one: the moving-average stack has been correctly ordered for months rather than days, with SMA5 $2.44 above SMA20 $2.38 above SMA60 $2.02, all rising and all beneath the close. Behind that ordering is a $1.645-to-$2.48 advance off the July 7 swing low — 50.8% in two months — carried by an ADX of 58.7 and Mansfield relative strength of +43.4% against the S&P/ASX 200, the highest reading anywhere on the two-year panel. The counterweight sits in the momentum panels rather than the trend panels: RSI has slipped back to 69.2 with a bearish divergence flagged, MACD has been below its signal line since a dead cross on August 14, and Friday's push back to $2.48 was made on 0.86× average volume.
Snapshot as of September 4, 2026
| Item | Value | Reading |
|---|---|---|
| Close | $2.48 | −0.8% from 52w high · +117.5% from 52w low |
| 52-week range | $1.14 – $2.50 | At the top of the range; the high sits just $0.02 above the close |
| SMA 5 / 20 / 60 | $2.44 / $2.38 / $2.02 | Rising and correctly stacked, close above all three and 22.5% above the 60-day line |
| Bollinger (20) | $2.48 / $2.38 / $2.28 | Band width 8.13% — a comparatively tight envelope; the close finished marginally above the $2.4757 upper band |
| aVWAP (2y anchor Feb 12, 2026) | $1.64 | Price 50.8% above the long-horizon anchored average |
| aVWAP (90d anchor Jul 16, 2026) | $2.23 | Price 11.2% above — the cohort anchored to the mid-July advance is onside |
| RSI(14) | 69.2 | Just under the 70 threshold, with a bearish divergence flagged: $2.42 at RSI 85.58 on Aug 7 versus $2.48 at RSI 71.89 on Sep 4 |
| Mansfield RS (vs the S&P/ASX 200) | +43.4% | Outperforming with a rising slope: +6.9 points on the week, +3.2 points on the month |
| MACD (12,26,9) | 0.0885 / 0.0963 / −0.0078 | Dead cross of Aug 14, 2026; histogram still negative, though both lines remain well above zero |
| ADX(14) | 58.7 | Far above 25 — a very strong directional reading (58.4 on the two-year frame) |
| ATR(14) | $0.071 (2.9%) | An ordinary daily range for a liquid ASX financial |
| OBV (2y / 90d) | early accumulation / accumulation | Both frames above their MA20 — +11.19% and +18.51% gaps to the average — but the two-year slope reads flat while the 90-day slope rises. No OBV divergence is flagged on either frame |
| Volume vs 20d avg | 0.86× | 9,612,702 shares against an 11,156,192 average — a below-average session for a close at the top of the range |
| Unfilled gap | $2.19 – $2.25 | Support gap of Aug 6, 2026, still open beneath the current structure |
| 1×ATR / 2×ATR technical invalidation | $2.41 / $2.34 | Volatility-based structural reference levels below the close |
① Price & Moving Averages
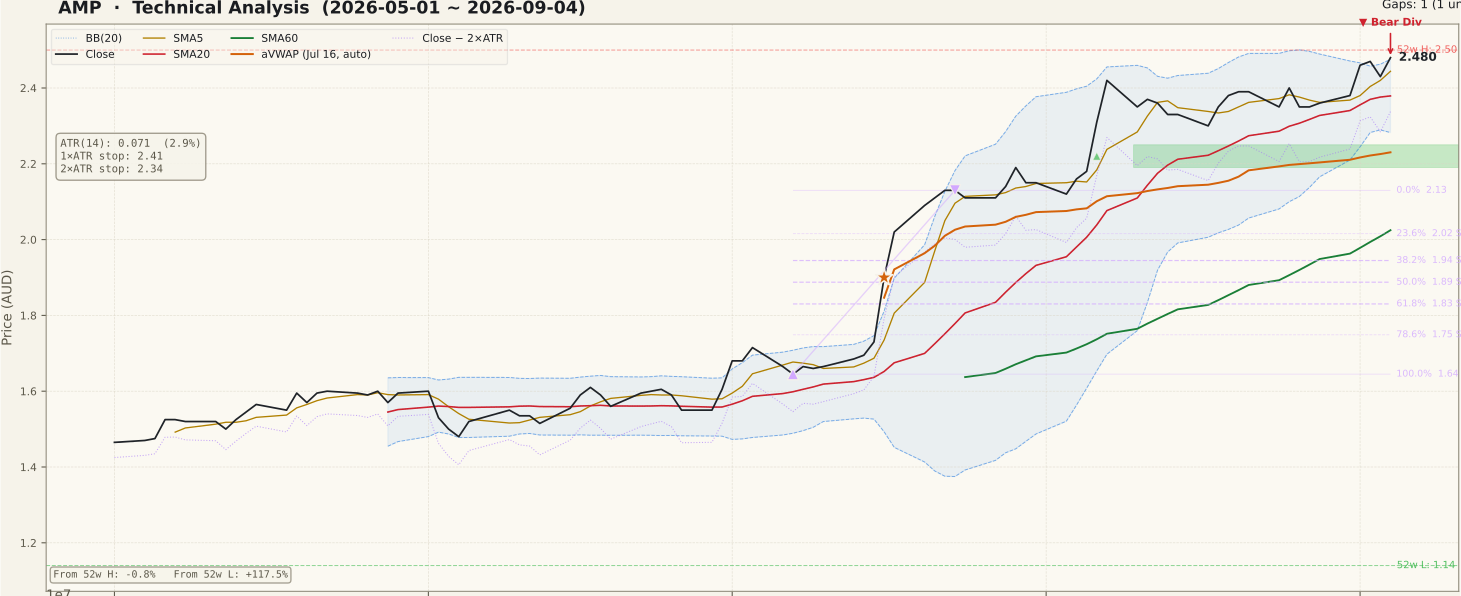
AMP_price-90d-2026-09-06.svgThe two-year frame reads as three distinct regimes. From September 2024 to January 2026 price oscillated in a broad $1.20–$1.90 band with two failed attempts to hold the upper edge. In February 2026 that structure broke violently: the panel shows a vertical drop to the $1.14 low, which is both the 52-week low and the session the tool selected as its long-horizon VWAP anchor (February 12, 2026). That event sits roughly seven months behind the current close and is recorded here as chart context only. The third regime is the repair and advance — a grinding base through March to June, then a trend from July onward that has taken price 117.5% above the low and clear of the entire prior range.
The 90-day window isolates that advance and explains why this name surfaced on a moving-average screen rather than a breakout screen. The alignment is old, not new: SMA5 $2.44 sits above SMA20 $2.38, which sits above SMA60 $2.02, all three rising, with the close above every line — and price has held that ordering continuously since mid-June rather than crossing into it this week. Price stepped off the $1.645 swing low of July 7, reached $2.13 by July 23, extended through an unfilled gap at $2.19–$2.25 on August 6, and has since worked to the $2.50 high visible at the right edge of the panel. Two details temper the picture. The close is 22.5% above the SMA60, a wide stretch from the medium-term mean that historically resolves through time or through a pullback. And the Bollinger envelope has contracted to 8.13% width while price finished marginally above the $2.4757 upper band — band-riding of that kind describes a strong trend, but it also leaves no room overhead inside the band structure.
② Volume

AMP_volume-90d-2026-09-06.svgFriday traded 9,612,702 shares against a 20-day average of 11,156,192 — a Vol/Avg ratio of 0.86×. The move back to $2.48, within two cents of the 52-week high, therefore arrived on below-average participation.
This is the specific trap the volume panel exists to catch. A price bar that reaches the top of a range on lighter-than-normal turnover has not been confirmed by participation, and treating it as a completed breakout is the most common beginner error on a chart that otherwise looks this strong. The wider panel is more constructive: through July and August the heavier bars in the 90-day window consistently accompanied up-days, which is the signature a genuine markup phase produces, and the two-year panel shows nothing resembling the enormous single-session spike that marked the February 2026 break. The honest summary is that flow has supported the advance overall while the most recent bar did not add to that evidence — a resolution above $2.50 on turnover at or above the 11.2 million average would be the confirmation this session withheld.
③ MACD

AMP_macd-90d-2026-09-06.svgMACD registered a dead cross on August 14, 2026 and has not recovered it. The line reads 0.0885 against a signal of 0.0963, with the histogram at −0.0078. The two-year and 90-day frames agree to four decimal places, so there is no timeframe conflict to resolve.
Where that cross happened matters more than the label. Both lines sit far above zero — the cross occurred close to the highest MACD readings of the entire two-year window, not beneath the zero line — which makes it a deceleration reading rather than a trend-reversal reading. The 90-day panel shows the histogram expanding through the late-July surge, peaking in early August, and running shallowly negative for roughly three weeks since. That sequence is what a trend produces when it advances at a slower rate than before: the averages converge because the rate of change fell, not because direction changed. Note also that price has made higher closes during those three negative-histogram weeks, which is a divergence between price and momentum in itself. A histogram that deepens while price is beneath the $2.38 SMA20 would be the version of this signal that carries weight; a return to positive with $2.44 intact would mark the August pause as consolidation inside the trend.
④ RSI

AMP_rsi-90d-2026-09-06.svgRSI(14) reads 69.2, just beneath the 70 overbought threshold after several weeks inside it, and the tool flags a regular bearish divergence with both peaks identified. The first peak is August 7, 2026: price $2.42, RSI 85.58. The second is September 4, 2026: price $2.48, RSI 71.89. Price is 2.5% higher at the second peak while the oscillator is 13.69 points lower. One housekeeping note for readers comparing figures: the headline RSI(14) value of 69.2 and the divergence tool's peak reading of 71.89 refer to the same session but come from different fields in the data, and both are reported here as published rather than reconciled into one number.
Two qualifications belong beside that divergence, and both are routinely skipped. The first is that an RSI of 85.58 is an extreme print — near the ceiling of what the indicator produces — and a lower RSI on a subsequent, only marginally higher price high is close to arithmetically unavoidable after a reading that hot. Divergences measured from a near-blow-off peak are the least reliable class of divergence. The second is that a divergence signals the possibility of exhaustion, never a confirmed top; it requires price confirmation, and price has confirmed nothing — the close is 0.8% from the 52-week high. Resolution shows up on the price panel, not in the oscillator: a daily close beneath $2.38 with the divergence in place would be confirmation, while a decisive close above $2.50 with RSI holding near 70 would negate it.
⑤ Mansfield Relative Strength

AMP_rs-90d-2026-09-06.svgMansfield RS versus the S&P/ASX 200 stands at +43.4%, deep in outperform territory, with the slope tag reading rising. A week ago the reading was +36.5%, so the weekly change is +6.9 points. A month ago it was +40.2%, so the monthly change is +3.2 points. Because the reading is positive and moving further from zero on both measures, this qualifies as acceleration in the strict sense. The internal shape is worth noticing, though: the weekly gain is more than double the monthly gain, which means relative strength eased through mid-August before this week's step up — the lead was rebuilt rather than compounded steadily.
The two-year panel gives that number its context. Relative strength was firmly positive through late 2024, spent the March-to-June 2025 stretch below zero as an index laggard, recovered to a modest positive through late 2025, then collapsed to roughly −22 in the February 2026 break. It crossed back above zero around June 2026 and has climbed to the highest readings of the entire window since. A zero-line crossing followed by a sustained climb is the sequence that identifies a real change in how the market treats a stock, and on this page it is the single strongest piece of evidence. The counterweight is scale — a +43.4% lead is very large, and leads of that size are consolidated at least as often as they are extended.
⑥ ATR & ADX

AMP_atr_adx-90d-2026-09-06.svgATR(14) is $0.071, or 2.9% of price. That figure sizes the structural reference levels used throughout this page: 1×ATR below the close is $2.41 and the 2×ATR technical invalidation level is $2.34, some 5.7% under the close. Stating the arithmetic is useful — a 2×ATR excursion is roughly two ordinary sessions of range for this stock, so $2.34 is a structural reference rather than a tight one, and it sits just below the $2.38 SMA20 shelf.
ADX(14) reads 58.7 on the 90-day frame and 58.4 on the two-year frame. That is not merely above the 25 threshold — it is among the highest readings anywhere on the two-year panel, matched only during the February 2026 collapse. The standard caution applies in the other direction here: ADX measures the strength of a directional move, not its direction, and in February a comparable reading accompanied a crash. Today direction is unambiguously up from the moving-average ordering, so a reading near 59 confirms an exceptionally strong advance. What it does not confirm is durability — ADX is a lagging measure of what has already occurred, and extreme readings describe trends that are mature rather than young. The ATR line has been elevated since mid-July, which means daily ranges are wide relative to the spring, and any single-session break of a level on this page deserves scepticism as a result.
⑦ OBV

AMP_obv-90d-2026-09-06.svgThe two timeframes agree on position and disagree on slope. On the two-year window OBV sits at 405,579,546 against a 20-day average of 364,756,752 — above the average by 11.19%, tagged early accumulation, with a slope reading of flat. On the 90-day window OBV is 261,397,018 against a 220,574,224 average, a wider 18.51% gap, an accumulation state, and a rising slope. It is worth being precise about what that percentage is: it measures the distance between OBV and its own 20-day average, not a divergence between OBV and price.
On the divergence question proper, the data is explicit — neither frame flags an OBV divergence, so the classic bearish non-confirmation pattern (price at a new high while cumulative volume visibly lags) is not present here. On both panels the OBV line is at or near its own highs alongside price. That is the constructive half of the reading, and it partly offsets Friday's light volume bar. The detail to file away is the flat two-year slope: it says the pace of flow has stopped increasing on the longer horizon even as the 90-day series climbs, which is the same message the MACD histogram is sending from a different direction.
Bull Case
- Rising, correctly stacked moving averages — SMA5 $2.44 > SMA20 $2.38 > SMA60 $2.02 — held continuously for months rather than crossed into this week.
- Mansfield RS +43.4% vs the S&P/ASX 200, the highest reading on the two-year panel, positive on both horizons: +6.9 points on the week, +3.2 on the month.
- ADX 58.7 (58.4 on the two-year frame) — among the strongest directional readings anywhere on the chart.
- OBV above its MA20 on both timeframes (+11.19% and +18.51%) with a rising 90-day slope, and no OBV divergence flagged on either frame.
- Price above both anchored VWAPs — $1.64 on the two-year anchor and $2.23 on the 90-day anchor — so every anchored cohort sits on the favourable side of its average.
- The entire July retracement grid, from the $2.13 anchor down to $1.645, now lies beneath the close, with the unfilled $2.19–$2.25 gap of August 6 as an additional shelf.
Bear Case
- A bearish RSI divergence is flagged — $2.42 at RSI 85.58 on Aug 7 versus a 2.5% higher $2.48 at RSI 71.89 on Sep 4 — with RSI now back below 70 at 69.2.
- MACD has been beneath its signal line since the Aug 14 dead cross, histogram −0.0078, while price has continued to make higher closes.
- Friday's return to $2.48 came on 0.86× average volume — participation did not confirm the move to the top of the range.
- The close finished marginally above the $2.4757 upper Bollinger Band with band width at only 8.13%, so there is no headroom inside the band structure.
- The two-year OBV slope reads flat and the state is only early accumulation — long-horizon flow has not confirmed the recent extension the way the 90-day frame has.
- Price is 22.5% above the $2.02 SMA60 and ADX near 59 describes a mature move; the $2.50 high is only 0.8% overhead, so the structure is being tested at its ceiling.
Scenarios
| Scenario | Probability | Path | Trigger / Invalidation |
|---|---|---|---|
| Trend extends through the range high | ~35% | Price clears the $2.50 52-week high on turnover at or above the 11.2 million average, the Bollinger envelope expands from its current 8.13% width, and the MACD histogram returns to positive. The retracement grid and the $2.19–$2.25 gap stay far below as the structure's floor. | Trigger: a daily close above $2.50 on above-average volume. Weakened by another advance on sub-average turnover. |
| Pause or shallow retracement inside the trend | ~45% | The divergence and the unrecovered dead cross resolve sideways to lower. Price gives back the $2.44 SMA5 and works toward the $2.38 SMA20 and Bollinger mid, where the trend structure remains intact and the moving-average ordering survives. A normal pause after a 50.8% advance. | Trigger: a daily close below $2.44. Invalidated by a reclaim of $2.50 on above-average volume. |
| Trend structure breaks | ~20% | The light-volume push to the range high proves to be the end of the advance. Price closes through the $2.34 technical invalidation level, then through the $2.28 lower band, and works into the unfilled August 6 gap at $2.19–$2.25, where the 90-day aVWAP at $2.23 also sits. The next references beneath are the $2.13 July swing high and the 23.6% retracement at $2.02. | Trigger: a daily close below the 2×ATR technical invalidation level at $2.34 — that ends the swing structure described above. |
Key Levels & Volatility References
| Level | Role | Basis |
|---|---|---|
| $2.50 | Resistance | 52-week high, set during the current advance — 0.8% above the close and the nearest overhead reference |
| $2.48 | Current close | Sep 4, 2026 close on 0.86× average volume, finishing marginally above the $2.4757 upper Bollinger Band |
| $2.44 | Support | SMA5 ($2.444) — the first rising line beneath the close, 1.5% below it |
| $2.38 | Support | SMA20 and Bollinger mid ($2.379) — the first structural shelf, 4.1% below the close |
| $2.34 | Invalidation | 2×ATR technical invalidation level below the close (5.7%), sitting just under the SMA20 shelf |
| $2.28 | Support | Lower Bollinger Band ($2.2823) — 8.0% below the close at the current 8.13% band width |
| $2.25 – $2.19 | Support | Unfilled support gap of Aug 6, 2026; the 90-day aVWAP at $2.230 (anchored Jul 16) falls inside this pocket |
What to Watch
- $2.50 with volume attached. The 52-week high is $0.02 overhead. Whether it is cleared on turnover at or above the 11.2 million average — rather than on another 0.86× session — resolves most of the ambiguity on this page.
- The $2.44 and $2.38 shelves. The SMA5 and then the SMA20 with the Bollinger mid-line. Above them the recent action is a pause; a daily close beneath $2.38 gives the RSI divergence the price confirmation it currently lacks.
- The MACD histogram at −0.0078, negative for roughly three weeks while price made higher closes. Whether it deepens with price under $2.38, or crosses back to positive with $2.44 intact.
- Bollinger band width at 8.13% with price on the upper band. Expansion alongside a higher close is trend continuation; contraction with price slipping into the band is the more common resolution of a tight envelope at a range high.
- Mansfield RS versus the S&P/ASX 200 — whether the +43.4% reading keeps widening from the +36.5% of a week ago, or rolls over from a lead that is already the largest on the two-year chart.