Treasury Wine Estates
This analysis is based on closing-price data as of October 30, 2026. Whether you're researching Treasury Wine Estates (TWE) on the ASX or learning how to read stock charts, here are objective support, resistance and technical invalidation levels built from the RSI, MACD and ATR indicators.
Treasury Wine Estates closed at $6.17 on October 30, its highest close since late October 2025 and within 0.5% of the $6.20 52-week high — a high set intraday in the same session. The two-year chart is a long decline from about $12 in late 2024 to a $3.34 low in March 2026, followed by a seven-month recovery that has lifted Mansfield relative strength versus the S&P/ASX 200 to +22.30%, its strongest reading on the two-year panel. The trend structure that frames this week's signal was in place before Friday: SMA5 > SMA20 > SMA60 since Sep 25 and the close above SMA60 since early May. The breakout itself, however, rests on a single bar — Oct 30 rose +4.05% on 3.47× average volume, with no company-specific catalyst identified — and RSI at 74.0 carries a bearish divergence against the Oct 16 peak.
Snapshot as of October 30, 2026
| Item | Value | Reading |
|---|---|---|
| Close | $6.17 | −0.5% from 52w high · +84.7% from 52w low; highest close since Oct 27, 2025 |
| 52-week range | $3.34 – $6.20 | The $6.20 high is the Oct 30 intraday high; the $3.34 low dates from March 2026 |
| SMA 5 / 20 / 60 | $5.93 / $5.80 / $5.58 | SMA5 > SMA20 > SMA60 since Sep 25; close above all three |
| Bollinger (20) | $6.15 / $5.80 / $5.45 | Band width 12.06%; the close sits just above the upper band |
| aVWAP (2y anchor Dec 17, 2025) | $4.81 | Price well above the long-term anchored average |
| aVWAP (90d anchor Aug 10, 2026) | $5.61 | Price above the average anchored to the Aug 10 high-volume advance |
| RSI(14) | 74.0 | Above 70 (overbought zone); bearish RSI divergence flagged (Oct 16 → Oct 30) |
| Mansfield RS (vs the S&P/ASX 200) | +22.30% | Outperforming and rising; +5.69 points on the week and +9.01 on the month (positive, accelerating) |
| MACD (12,26,9) | 0.1332 / 0.1197 / +0.0135 | Golden cross on Oct 30, above the zero line (two-year frame 0.1334 / 0.1201 / +0.0134) |
| ADX(14) | 23.1 | Emerging trend (22.9 on the two-year frame) |
| ATR(14) | $0.141 (2.3%) | Low volatility; 2×ATR spans 4.6% of the share price |
| OBV (2y / 90d) | early accumulation / accumulation | Above MA20 on both frames (flat on 2y, rising on 90d); no OBV divergence flagged |
| Volume vs 20d avg | 3.47× | 11,620,869 shares against a 3,348,548 average — a single-bar spike |
| 1×ATR / 2×ATR technical invalidation | $6.03 / $5.89 | Volatility-based structural reference levels below the close |
① Price & Moving Averages
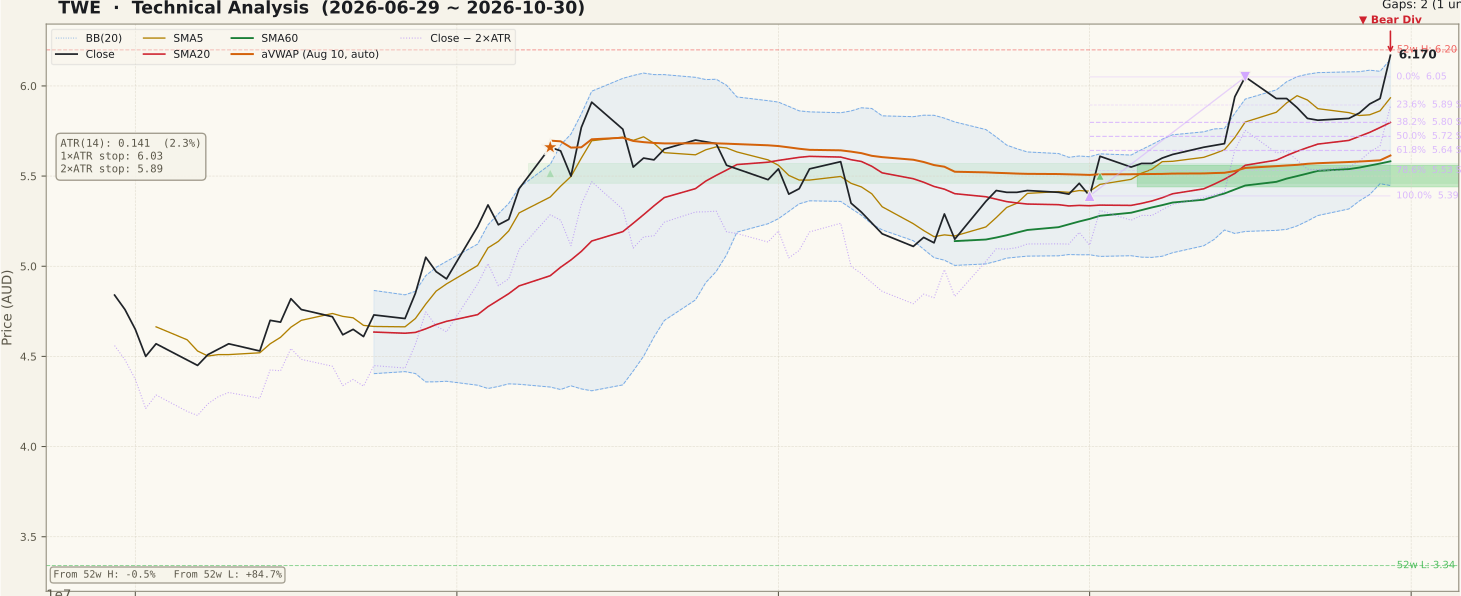
TWE_price-90d-2026-11-01.svgThe two-year frame is dominated by a long decline. Price slid from about $12 in late 2024 through 2025, broke lower with a gap on Oct 13, 2025 (the $6.37–$6.88 gap above today's price is still unfilled), and bottomed at $3.34 in March 2026. Since April the chart has recovered steadily: SMA60 flattened and turned up through mid-2026, and the two-year aVWAP anchored on Dec 17, 2025 ($4.81) now sits well below price as support. The August 2026 full-year results period is visible as a burst of activity — Aug 10 rose +4.2% on about 3.5× volume, the bar that anchors the 90-day aVWAP ($5.61) — followed by a peak near $5.91 in mid-August and a pullback to the low $5s in September.
On the 90-day frame, price based near $5.15–$5.40 through late September and early October, gapped up on Oct 2 (the $5.44–$5.56 gap below is unfilled support), and climbed to a $6.05 close on Oct 16. The Oct 15 (+4.58%, 1.93×) and Oct 16 (+1.85%, 2.37×) sessions coincided with the company's AGM, at which guidance was reaffirmed. Price then eased to $5.81 by Oct 23 before rising for five sessions into the Oct 30 close of $6.17.
The timing of each condition matters here. The close has been above SMA60 since early May and above SMA20 since Sep 22. The SMA5 > SMA20 > SMA60 ordering formed on Sep 25 (after earlier formations on May 21, Jun 5 and Jul 16) and has held since; the close slipped under SMA5 from Oct 21 to Oct 26. The breakout bucket's defining condition — a close above the prior 20-session closing high — appeared repeatedly in the October run (Oct 2, Oct 9 and Oct 12–16), but the current version, a close above the Oct 16 high of $6.05, formed on a single bar: Oct 30. That bar also produced the MACD golden cross. The preceding trend structure stands on its own, but the breakout and the momentum cross are one day old. On the 90-day Fibonacci swing from $5.39 (Oct 1) to $6.05 (Oct 16), the 23.6% retracement is $5.89, 38.2% is $5.80 and 50% is $5.72; the chart labels the $6.05 swing high as resistance, but price is now above it. The close is slightly above the upper Bollinger Band ($6.15).
② Volume

TWE_volume-90d-2026-11-01.svgThe Oct 30 bar traded 11,620,869 shares, 3.47× the 20-day average of 3,348,548 (that average includes the day itself) — one of the three tallest bars on the 90-day panel alongside the mid-August results period and Sep 18. The Sep 18 session (−2.6% on about 3.2×) was the S&P/ASX quarterly index rebalance day, a market-wide volume event. The screened ASX universe's median volume ratio was about 0.92× on Oct 30 and ran 0.65–1.30× across Oct 12–30, a normal market backdrop; adjusted for that, the Oct 30 bar is still about 3.8× — a stock-specific spike.
No company-specific announcement was identified for Oct 30. The broader market that day saw rotation toward defensive sectors after a decline in US technology shares, but that is a description of the market tone, not an identified cause for this stock's volume. A large volume bar without an identifiable catalyst deserves caution: it confirms participation on the day, but it does not explain it, and single-bar spikes can fade. Within the same five-session window, Oct 26 printed 2.17× volume on a +0.17% move; the other sessions ran 0.72–0.80× average.
③ MACD

TWE_macd-90d-2026-11-01.svgThe MACD line is 0.1332 against a signal of 0.1197, a histogram of +0.0135, after a golden cross on Oct 30. Through October the two lines converged as the post-AGM pullback flattened momentum, and the line briefly dipped under its signal in late October before crossing back on the breakout bar. Both lines are above zero, so this is a re-cross within an existing uptrend rather than a turn from negative territory. The current MACD reading is well below the August peak, and the histogram is thin — the cross depends on a single day's move.
④ RSI

TWE_rsi-90d-2026-11-01.svgRSI(14) is 74.0 on both frames, inside the overbought zone above 70. A bearish RSI divergence is flagged: on Oct 16 price closed at $6.05 with RSI at 76.55, and on Oct 30 price closed higher at $6.17 with RSI lower at 73.99 (76.51 and 73.97 on the two-year frame). A higher price high on a lower RSI high says the latest push carried less momentum than the mid-October one. A divergence is a possibility of a pause or reversal, not a confirmation — it needs price to turn down and lose a nearby level before it means anything — but it sits directly against the one-bar breakout.
⑤ Mansfield Relative Strength

TWE_rs-90d-2026-11-01.svgMansfield RS vs the S&P/ASX 200 is +22.30%, above zero (outperforming) with a rising slope. A week earlier it was 16.61 and a month earlier 13.30, so it gained 5.69 points on the week and 9.01 points on the month — positive and accelerating on both horizons. The two-year panel shows how far this has come: RS spent all of 2025 and early 2026 below zero, bottoming near −50 around March–April 2026, crossed above zero in August and has climbed since. This is the strongest feature of the chart, and the selection's RS rank of 94 reflects it.
⑥ ATR & ADX

TWE_atr_adx-90d-2026-11-01.svgATR(14) is $0.141, or 2.3% of price, which places the 1×ATR reference at $6.03 and the 2×ATR technical invalidation level at $5.89, 4.6% below the close. ATR peaked during the August results period and has eased since, sitting near the low end of its two-year range before ticking up on the Oct 30 bar. ADX is 23.1 (22.9 on the two-year frame), in the 20–25 emerging-trend zone. ADX measures trend strength, not direction: it says a trend is forming but not yet strong. A move above 25 would show the advance gaining persistence; the low ATR means the invalidation level sits close enough that ordinary noise can reach it.
⑦ OBV

TWE_obv-90d-2026-11-01.svgOBV is tagged accumulation on the 90-day frame (above its MA20 and rising) and early accumulation on the two-year frame (above its MA20 but flat). No OBV divergence is flagged on either frame. On the 90-day panel, OBV rose through the August results period, faded through September, and rebuilt from early October, with the Oct 30 bar adding a large step. On the two-year panel, OBV fell heavily through the 2025–26 decline and has moved sideways since April, so the long-term volume flow has stabilised rather than reversed.
The OBV-to-MA20 gap is +9.55% on the two-year frame; the 90-day figure of +160.19% overstates strength because the 90-day MA20 sits close to zero and one heavy bar moves it sharply. These percentages measure distance from the moving average, not divergence.
Bull Case vs Bear Case
Bull Case
- Close above the Oct 16 high ($6.05) at $6.17 — the highest close since late October 2025
- Mansfield RS +22.30% and accelerating (+5.69 on the week, +9.01 on the month)
- SMA5 > SMA20 > SMA60 since Sep 25; close above SMA60 since early May
- MACD golden cross on Oct 30 above the zero line
- Price above both anchored VWAPs ($4.81 and $5.61)
- OBV above MA20 on both frames; ADX 23.1 in the emerging-trend zone
Bear Case
- The breakout and the MACD cross both rest on a single bar (Oct 30)
- 3.47× volume with no company-specific catalyst identified
- Bearish RSI divergence: higher price high, lower RSI high (Oct 16 → Oct 30)
- RSI 74.0 in the overbought zone; close just above the upper Bollinger Band
- The $6.37–$6.88 unfilled gap from October 2025 sits 3.2% overhead
- Close-set invalidation level (4.6% away) after a one-day jump
Scenarios
| Scenario | Probability | Path | Trigger / Invalidation |
|---|---|---|---|
| Breakout extends toward the October 2025 gap | 30% | Price holds above $6.05 and works toward the $6.37–$6.88 unfilled gap | Trigger: further closes above $6.20 with volume staying above average and ADX rising through 25. Invalidation: a close back below $6.05 |
| Pullback into the breakout area | 45% | The one-bar jump and RSI divergence lead to a retest of $5.89–$6.05 (2×ATR, Fibonacci 23.6% and the Oct 16 high) | Trigger: a close back below $6.05. The structure holds while closes stay above the $5.89 2×ATR level |
| Breakout fails back into the range | 25% | The unexplained spike fades and price returns toward SMA20 / Fibonacci 38.2% ($5.80) and the $5.72 50% retracement | Trigger: a daily close below $5.89 (2×ATR technical invalidation) |
Key Levels & Volatility References
| Level | Role | Distance | Basis |
|---|---|---|---|
| $6.37 | Resistance | +3.2% | Lower edge of the $6.37–$6.88 unfilled gap (Oct 13, 2025) |
| $6.20 | Resistance | +0.5% | 52-week high (Oct 30 intraday high) |
| $6.17 | Current | — | Oct 30, 2026 close; just above the $6.15 upper Bollinger Band |
| $6.05 | Support | −1.9% | Oct 16 closing high — the level the Oct 30 bar cleared (Fibonacci 0% of the Oct 1 – Oct 16 swing) |
| $6.03 | Support | −2.3% | 1×ATR reference |
| $5.89 | Invalidation | −4.6% | 2×ATR technical invalidation level; Fibonacci 23.6% ($5.89) alongside |
| $5.80 | Support | −6.0% | SMA20 / Bollinger mid line with the Fibonacci 38.2% retracement |
What to Watch
- Follow-through after Oct 30. A one-bar breakout needs the next sessions to hold above the $6.05 Oct 16 high; a quick close back below it would mark the move as a spike rather than a breakout.
- Volume on the next sessions. The 3.47× bar has no identified catalyst. Volume that stays above average on further gains would show sustained demand; a collapse back to 0.7–0.8× would leave Oct 30 standing alone.
- RSI divergence. RSI made a lower high (73.99 vs 76.55) while price made a higher high. A turn lower in price would give the divergence weight; a new RSI high above 76.55 would cancel it.
- Mansfield RS. At +22.30% and accelerating, a flattening or turn lower would be the first sign of the outperformance fading.
- The $5.89 level. A daily close below the 2×ATR technical invalidation level would undo the breakout structure.