Treasury Wine Estates
This analysis is based on closing-price data as of October 9, 2026. Whether you're researching Treasury Wine Estates (TWE) on the ASX or learning how to read stock charts, here are objective support, resistance and technical invalidation levels built from the RSI, MACD and ATR indicators.
Treasury Wine Estates closed at $5.62 on October 9, 68.3% above its $3.34 52-week low but still 19.6% below the $6.99 52-week high. The two-year chart is a long decline from around $12 in late 2024 into a low in the first half of 2026, followed by a recovery that has put price back above all three moving averages in full SMA5 > SMA20 > SMA60 order since September 25. Relative strength against the S&P/ASX 200 turned positive in August and has widened to +13.5%, but trend strength is only emerging (ADX 20.4) and the latest sessions traded on ordinary volume, so this reads as a recovery structure inside a larger downtrend rather than a confirmed reversal of it.
Snapshot as of October 9, 2026
| Item | Value | Reading |
|---|---|---|
| Close | $5.62 | −19.6% from 52w high · +68.3% from 52w low |
| 52-week range | $3.34 – $6.99 | Close in the upper-middle of the range; the $6.99 high (Oct 10, 2025 intraday) sits at the far edge of the 52-week window |
| SMA 5 / 20 / 60 | $5.58 / $5.40 / $5.35 | Close > SMA5 > SMA20 > SMA60 (full ordering since Sep 25). Close is 0.7% over SMA5, 4.0% over SMA20 and 5.0% over SMA60 |
| Bollinger (20) | $5.73 / $5.40 / $5.07 | Band width 12.11%; the close is 1.9% under the upper band |
| aVWAP (2y anchor Dec 17, 2025) | $4.75 | Price 18.3% above the long-horizon anchored average |
| aVWAP (90d anchor Aug 10, 2026) | $5.51 | Price 1.9% above the average anchored near the start of the August advance |
| RSI(14) | 60.9 | Above 50 with room below 70; bullish RSI divergence flagged (Sep 2 vs Oct 1) |
| Mansfield RS (vs the S&P/ASX 200) | +13.5% | Outperforming, slope rising; +0.25 points on the week and +11.92 points on the month |
| MACD (12,26,9) | 0.064 / 0.039 / +0.025 | Golden cross on Sep 24; both lines just above zero |
| ADX(14) | 20.4 | Trend emerging (20–25 band); 20.6 on the 90-day frame |
| ATR(14) | $0.139 (2.5%) | A contained daily range; 2×ATR spans 4.9% of the share price |
| OBV (2y / 90d) | early accumulation / early accumulation | Above MA20 but flat on both frames. Bearish OBV divergence flagged on the 90-day frame (Sep 22 vs Oct 9); none on the two-year frame |
| Volume vs 20d avg | 0.81× | 2,439,528 shares against a 3,023,684 average; with the ASX universe median at 0.74× that day, about 1.09× market-adjusted (ordinary) |
| 1×ATR / 2×ATR technical invalidation | $5.48 / $5.34 | Volatility-based structural reference levels below the close |
① Price & Moving Averages
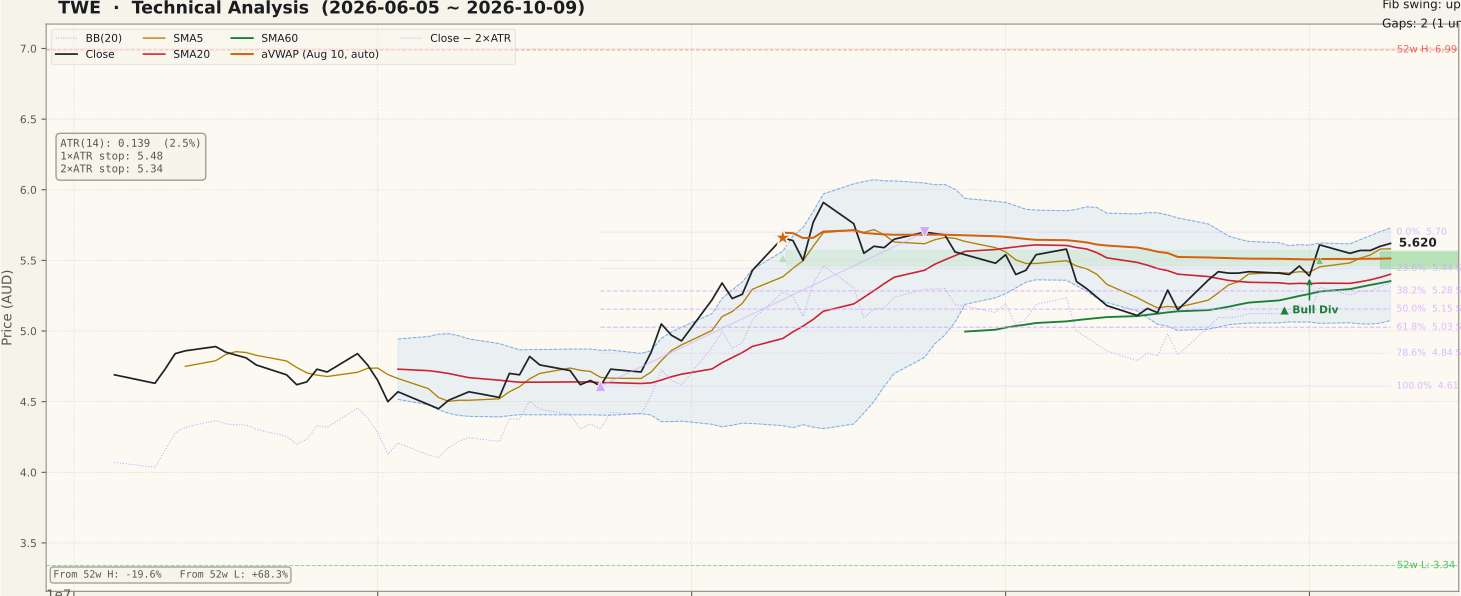
TWE_price-90d-2026-10-11.svgThe two-year frame is dominated by the decline from about $12 to the $3.34 low, and the unfilled gaps left behind on the way down still sit overhead: $6.37–$6.88 (Oct 13, 2025) and $10.30–$10.54 (Mar 5, 2025). The recovery has been built in steps rather than a smooth climb — the chart shows a +16.5% session on Apr 22 and a +13.1% gap on Jun 4 (that gap, $4.20–$4.38, is still unfilled below), then an advance through the August results period to a two-year-frame swing high of $5.91 on Aug 14. Those are all well outside the last five sessions and are noted here as history only.
On the 90-day frame, price pulled back from that August peak into the $5.10–$5.20 area in mid-September, then turned up: close moved above SMA20 and SMA60 on Sep 22, and the full SMA5 > SMA20 > SMA60 ordering completed on Sep 25. SMA20 has been above SMA60 since May 7, so the medium-term structure predates this leg. The Oct 2 session opened above the prior day's high and left a small unfilled gap at $5.44–$5.56, which is now the nearest structural support. Upside reference points are the 90-day swing high at $5.70 (Aug 24), the upper Bollinger Band at $5.73 and the two-year-frame swing high at $5.91.
② Volume

TWE_volume-90d-2026-10-11.svgThe heaviest bars on the 90-day chart cluster in August, around the advance to the swing high, and volume has been quieter since. The Oct 9 session traded 0.81× its 20-day average. Market-wide volume was light all week — the ASX universe median ratio ran 0.45–0.81× from Oct 5 to Oct 9 — so relative to the market the latest session is about 1.09×, which is ordinary participation rather than a surge or a drought.
The Oct 2 gap session was the most active of the recent stretch at about 1.34× average (roughly 2.09× after adjusting for the quiet market). No public catalyst was identified for that move. The practical reading is that the latest 20-day-high break on Oct 9 came without a volume expansion of its own, so it has not yet been confirmed by participation.
③ MACD

TWE_macd-90d-2026-10-11.svgMACD crossed above its signal line on Sep 24 and now reads 0.064 against a 0.039 signal, with a +0.025 histogram. The cross happened close to the zero line after the September pullback had pushed MACD slightly negative, which is the shape of a momentum reset rather than an extended trend. The histogram has been positive but modest — far smaller than the August expansion — so momentum is improving without yet accelerating.
④ RSI

TWE_rsi-90d-2026-10-11.svgRSI sits at 60.9 — positive territory, well short of the 70 line it pushed through in August. A bullish RSI divergence is flagged: price made a marginally lower low ($5.40 on Sep 2, then $5.39 on Oct 1) while RSI made a higher low (44.74, then 51.36 on the 90-day frame; 44.89 and 51.40 on the two-year frame). The price difference between the two lows is a single cent, so this is a mild version of the pattern. Price has since moved up from the second low, which is the follow-through a divergence needs, but a bottoming signal is not, by itself, bullish confirmation.
⑤ Mansfield Relative Strength

TWE_rs-90d-2026-10-11.svgAgainst the S&P/ASX 200, Mansfield RS is +13.5% and rising. A week ago it was +13.30, so the weekly change is a marginal +0.25 points; a month ago it was +1.62, so the monthly change is +11.92 points — positive and accelerating on both measures, though the weekly pace has flattened. On the two-year frame the line spent most of 2025 and early 2026 deeply negative before crossing zero in August, which makes this the first sustained stretch of outperformance on the chart. That is a meaningful change in character, but it is still young.
⑥ ATR & ADX

TWE_atr_adx-90d-2026-10-11.svgATR(14) is $0.139, or 2.5% of price, and has been easing since the August expansion — daily ranges are compressing. That puts the 1×ATR reference at $5.48 and the 2×ATR technical invalidation level at $5.34, 4.9% below the close and just under SMA60 ($5.35). ADX is 20.4 (20.6 on the 90-day frame), in the 20–25 "emerging" band after falling from the August peak. ADX measures strength rather than direction; at this level the current advance is forming a trend, not yet sustaining one.
⑦ OBV

TWE_obv-90d-2026-10-11.svgOBV is in "early accumulation" on both frames — above its 20-day average but flat. On the two-year frame OBV is only 2.24% over its MA20 and still near the bottom of a long slide that ran through early 2026, so the longer volume record has not recovered alongside price. On the 90-day frame the MA20-gap figure (126.91%) is inflated because the average sits near zero, and is not a measure of strength here.
More relevant is the bearish OBV divergence flagged on the 90-day frame: price rose from $5.42 on Sep 22 to $5.62 on Oct 9, while OBV fell from 1,806,019 to 1,130,891. The RSI and OBV divergences point in opposite directions — momentum is improving while net volume flow has not kept pace with the price gains. Neither is a confirmed signal on its own.
Bull Case vs Bear Case
Bull Case
- Full Close > SMA5 > SMA20 > SMA60 ordering since Sep 25; SMA20 above SMA60 since May 7
- Mansfield RS +13.5% vs the S&P/ASX 200, +11.92 points on the month — the first sustained outperformance on the two-year chart
- MACD golden cross on Sep 24 near the zero line, histogram positive
- Bullish RSI divergence (Sep 2 vs Oct 1) followed by a move higher; RSI 60.9 with room below 70
- Price above both anchored VWAPs — $4.75 (Dec 17, 2025) and $5.51 (Aug 10, 2026)
- 20-day-high breaks on Oct 2 and Oct 9, with an unfilled $5.44–$5.56 gap below as nearby structure
Bear Case
- Still 19.6% below the 52-week high inside a two-year decline; unfilled gap at $6.37–$6.88 overhead
- Bearish OBV divergence on the 90-day frame (Sep 22 vs Oct 9): price higher, OBV lower
- Two-year OBV remains near the bottom of its range — the long volume record has not recovered
- Oct 9 volume 0.81× average (about 1.09× market-adjusted) — no participation surge on the break
- ADX 20.4 — trend emerging, not established
- Swing highs at $5.70 and $5.91 sit directly overhead; the RSI divergence's two price lows differ by one cent
Scenarios
| Scenario | Probability | Path | Trigger / Invalidation |
|---|---|---|---|
| Recovery extends to the August highs | 35% | Price clears the $5.70 90-day swing high and the upper band near $5.73, then works toward the $5.91 two-year-frame swing high | Trigger: daily closes above $5.70 with volume at or above its 20-day average and OBV turning up. Invalidation: a close back inside the $5.44–$5.56 gap |
| Consolidation above the moving averages | 45% | Price ranges between the $5.44–$5.56 gap and $5.70 while SMA20 rises to meet it and ADX stays near 20 | Trigger: closes back below SMA5 ($5.58). The structure stays intact while closes remain above the $5.34 2×ATR level |
| Recovery fails back into the September range | 20% | Price fills the Oct 2 gap and slips through SMA20 ($5.40) and SMA60 ($5.35) toward the mid-September lows near $5.10–$5.20 | Trigger: a daily close below $5.34 (2×ATR technical invalidation). The 50% retracement of the 90-day swing ($5.15) sits further below |
Key Levels & Volatility References
| Level | Role | Distance | Basis |
|---|---|---|---|
| $5.91 | Resistance | +5.2% | Two-year-frame Fibonacci swing high (Aug 14, 2026) |
| $5.70 | Resistance | +1.4% | 90-day Fibonacci swing high (Aug 24, 2026); upper Bollinger Band ($5.73) just above |
| $5.62 | Current | — | Oct 9, 2026 close |
| $5.56 | Support | −1.1% | Top of the unfilled Oct 2 gap ($5.44–$5.56); SMA5 ($5.58) just above |
| $5.51 | Support | −1.9% | 90-day anchored VWAP (Aug 10, 2026 anchor) |
| $5.40 | Support | −3.9% | SMA20 / Bollinger mid line, with the gap bottom ($5.44) and 90-day 23.6% retracement ($5.44) just above |
| $5.34 | Invalidation | −4.9% | 2×ATR technical invalidation level, just under SMA60 ($5.35) |
What to Watch
- Volume on a move through $5.70. The Oct 9 break ran at ordinary volume. A close above the 90-day swing high with volume at or above the 20-day average would show participation that the recent sessions have lacked.
- OBV versus price. The 90-day bearish OBV divergence is unresolved. OBV turning up to a new high alongside price would remove it; further price gains with OBV slipping would deepen it.
- The Oct 2 gap at $5.44–$5.56. Closes that stay above the gap keep the October structure intact; a fill would put SMA20 at $5.40 in play.
- ADX through 25. At 20.4 the trend is emerging. A rise through 25 would show the recovery gaining persistence.
- The $5.34 level. A daily close below the 2×ATR technical invalidation level, just under SMA60, would undo the moving-average structure that defines this setup.