Treasury Wine Estates
This analysis is based on closing-price data as of October 16, 2026. Whether you're researching Treasury Wine Estates (TWE) on the ASX or learning how to read stock charts, here are objective support, resistance and technical invalidation levels built from the RSI, MACD and ATR indicators.
Treasury Wine Estates is still recovering inside a two-year decline that took the stock from about $12 in late 2024 to a $3.34 low in 2026, but the short-term structure has strengthened: the close of $6.05 sits above a fully ordered SMA5 > SMA20 > SMA60 stack and is the stock's first close above $6 in this recovery, with Mansfield RS at +21.1% versus the S&P/ASX 200. This week's move is a close above the prior 20-day high on two consecutive days (Oct 15 and Oct 16), on volume of 2.32x its 20-day average. The lens for this page is whether a breakout from a stretched starting point — RSI 76.5 and a close above the upper Bollinger band — stays above its newly cleared ground below the unfilled October 2025 gap at $6.37–$6.88.
Snapshot as of Oct 16, 2026 close
| Item | Value | Read |
|---|---|---|
| Close | $6.05 | Above SMA5, SMA20 and SMA60; above the upper Bollinger band |
| 52-week high / low | $6.58 / $3.34 | −8.1% from the high · +81.1% from the low |
| SMA5 / SMA20 / SMA60 | $5.80 / $5.56 / $5.45 | Bullish order since Sep 25 |
| Bollinger (20) upper / mid / lower | $5.93 / $5.56 / $5.19 | Width 13.21%; close is outside the upper band |
| aVWAP 90d (anchor Aug 10, 2026) | $5.54 | Price above — short-term anchor holders in profit |
| aVWAP 2y (anchor Dec 17, 2025) | $4.77 | Price well above the long-term anchor |
| RSI (14) | 76.5 | Overbought zone; bullish RSI divergence (Sep 2 / Oct 1) |
| Mansfield RS vs the S&P/ASX 200 | +21.1% | Outperforming, rising; +7.60 pts on the week |
| MACD / signal / histogram | 0.129 / 0.079 / +0.050 | Golden cross Sep 24, above zero |
| ADX (14) | 22.0 (90d) · 21.9 (2y) | Emerging trend, not yet strong |
| ATR (14) | $0.148 (2.45%) | Moderate daily range |
| OBV 2y / 90d | Early accumulation, flat (+8.46% vs MA20) / Accumulation, rising (+118.99% vs MA20) | 90d stronger than 2y |
| Volume vs 20-day average | 2.32x (6,057,151 vs 2,611,732) | Second straight above-average session |
| 1×ATR / 2×ATR technical invalidation | $5.90 / $5.75 | 2×ATR is 4.9% below the close |
① Price & Moving Averages
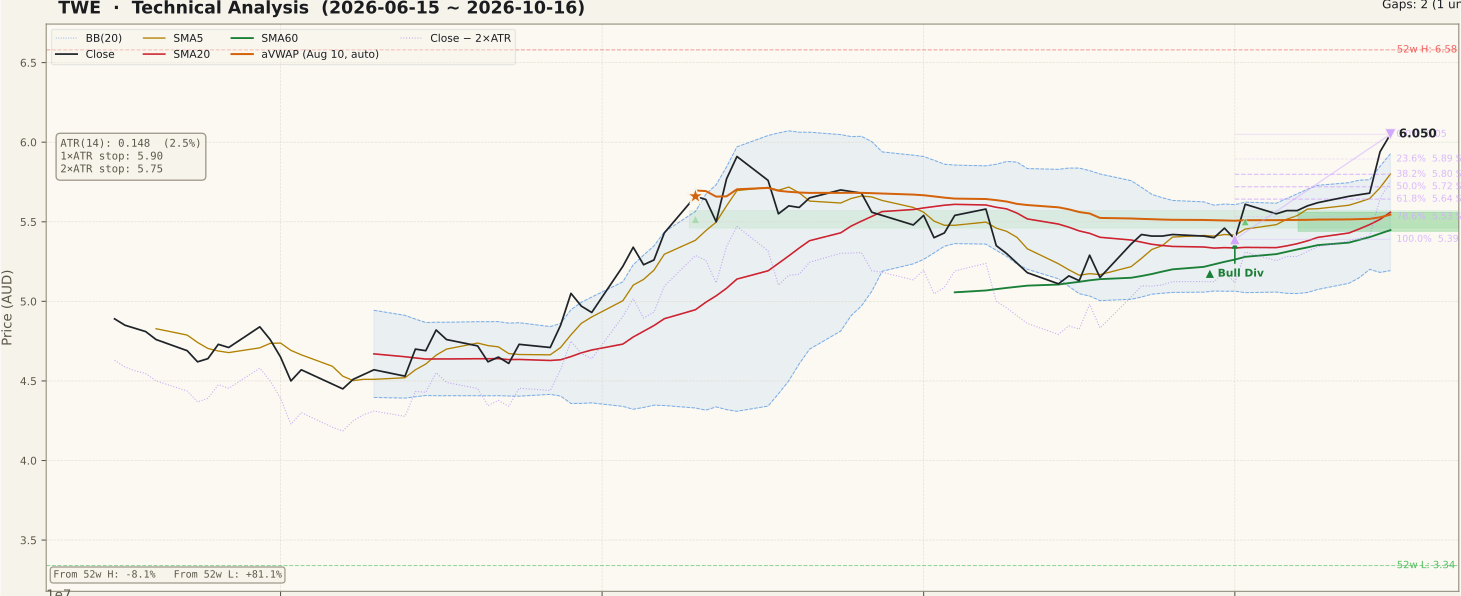
On the two-year chart the dominant trend is still the long decline: the stock fell from about $12 through unfilled resistance gaps at $10.30–$10.54 (March 2025) and $6.37–$6.88 (October 2025) to the $3.34 low, before a stepped recovery through 2026. The 90-day chart shows that recovery's latest leg: an August advance to the $5.91 swing high (Aug 14), a September pullback toward $5.10–$5.20, a turn higher with a small gap on Oct 2 ($5.44–$5.56, still unfilled) and, this week, two closes through the prior 20-day high to $6.05. Moving averages are in full bullish order — SMA5 $5.80, SMA20 $5.56, SMA60 $5.45 — and price is above both the 90-day aVWAP ($5.54) and the 2-year aVWAP ($4.77). The caution is extension: the close is 8.8% above the SMA20 and above the upper Bollinger band ($5.93), and the next overhead reference is the October 2025 gap that begins at $6.37, with the 52-week high at $6.58 inside it.
② Volume

The basis-day volume of 6,057,151 shares is 2.32x the 20-day average of 2,611,732 (this ratio includes the current session in the average). Market-wide participation was ordinary that day — the median volume ratio across our ASX universe was 0.89x — so on a market-adjusted basis Friday's turnover was roughly 2.6x, the clearer volume confirmation of the two breakout days. Thursday's AGM session ran at about 2.0x against a busier market (median 1.28x), about 1.6x adjusted. Before that the three sessions of Oct 12–14 were quiet (0.43x–0.81x), so the breakout came out of a low-volume drift rather than a run of heavy-volume advances. For context, the largest spike in the window, Sep 18 (−2.65% on about 3.6x), fell on the S&P/ASX quarterly index-rebalance trading day, and the heavier bars of August came during the results period; both are history here, not part of this week's signal.
③ MACD

MACD crossed above its signal line on Sep 24, close to the zero line, after a September dip below zero. It now reads 0.129 against a signal of 0.079, with a histogram of +0.050 that has widened over the last few sessions. A golden cross near zero is the more durable kind — momentum is turning from a neutral base rather than from an extended reading — and the line is still well below its August peak, so MACD does not show the same stretch that RSI does. A shrinking histogram from here would be the first sign the impulse is fading.
④ RSI

RSI(14) is 76.5, above the 70 overbought line after a two-day jump. The data also records a bullish RSI divergence: price made a marginally lower low on Oct 1 ($5.39, RSI 51.33) than on Sep 2 ($5.40, RSI 44.66) while RSI made a higher low — and the price has since followed through upward. Overbought readings in a fresh trend can persist, so 76.5 is not, by itself, a turning signal; but it does mean the stock enters the overhead gap zone with little momentum cushion, and a pause or pullback toward the $5.72–$5.89 retracement area would be a normal way for RSI to reset.
⑤ Mansfield Relative Strength vs the S&P/ASX 200

Mansfield RS versus the S&P/ASX 200 is +21.1% and rising. A week ago it was +13.5% and a month ago +2.1%, so the reading has gained 7.60 points on the week and 19.09 points on the month — positive and accelerating on both horizons. On the two-year chart this is notable: RS spent from early 2025 to mid-2026 below zero, at times near −45%, and only crossed back above zero in August. Relative strength is the strongest leg of this setup and is the clearest evidence that the move is stock-specific outperformance rather than a market-wide lift.
⑥ ATR & ADX

ATR(14) is $0.148, or 2.45% of price, having ticked up with this week's range after drifting lower through September. That puts the 1×ATR reference at $5.90 and the 2×ATR technical invalidation level at $5.75, 4.9% below the close. ADX is 22.0 on the 90-day series (21.9 on the 2-year series), in the 20–25 "emerging" band: the trend is forming but not yet strong. Breakouts with ADX still in the low 20s are more prone to stall and range than those already backed by a strong trend reading, so a rising ADX over the coming sessions would strengthen the trend reading.
⑦ On-Balance Volume (OBV)

The two timeframes disagree in degree. On the 90-day view OBV is in accumulation — above its 20-day average and rising, 118.99% above that average (an MA20 spread, not a divergence measure; it is inflated because the average sits near zero). On the two-year view OBV is only in early accumulation: above its MA20 by 8.46% but flat, and still deeply below where it stood before the 2025–26 decline, which means the long-run volume balance has not recovered the way price has. No OBV divergence is recorded on either timeframe. The 90-day picture supports this week's breakout; the 2-year picture is a reminder that the recovery is young.
Bull Case vs Bear Case
Bull Case
- Close > SMA5 > SMA20 > SMA60 since Sep 25 — the trend structure preceded this week's breakout.
- Two consecutive closes above the prior 20-day high (Oct 15, Oct 16), the second on about 2.6x market-adjusted volume.
- Mansfield RS +21.1% vs the S&P/ASX 200, +7.60 pts on the week and +19.09 on the month.
- MACD golden cross Sep 24 near zero, histogram widening to +0.050.
- Price above both aVWAPs ($5.54 short-term, $4.77 long-term).
- 90-day OBV in accumulation and rising; bullish RSI divergence (Sep 2 / Oct 1) has resolved upward.
Bear Case
- RSI 76.5 is overbought and the close is above the upper Bollinger band ($5.93).
- Unfilled October 2025 gap at $6.37–$6.88 sits overhead, with the 52-week high of $6.58 inside it.
- ADX 22.0 is only emerging — the trend is not yet strong.
- The defining breakout day coincided with the AGM; the move that day may partly reflect the event rather than the chart alone.
- Two-year context is still a long decline from about $12; two-year OBV is flat and far below its 2025 levels.
- Close is 8.8% above the SMA20, leaving room for a mean-reversion pullback.
Scenarios
| Scenario | Probability | Path | Trigger / Invalidation |
|---|---|---|---|
| Breakout extends into the gap | 35% | Momentum carries price into the $6.37–$6.88 gap zone and tests the $6.58 52-week high. | Trigger: daily closes holding above $6.05 with volume at or above average and ADX rising. Weakens on a close back below $5.89. |
| Pause and retest | 45% | Overbought RSI resets through a pullback or sideways drift into the $5.72–$5.91 area (90-day 50%–23.6% retracement and the August swing high), with the moving-average order intact. | Holds if the retest stays above the $5.75 2×ATR level and the SMA20 keeps rising. |
| Breakout fails | 20% | Price slips back into the prior range and toward the SMA20 / Oct 2 gap zone ($5.44–$5.56) and the SMA60 ($5.45). | Trigger: daily close below $5.75 (2×ATR technical invalidation). |
Key Levels & Volatility References
| Price | Role | Basis |
|---|---|---|
| $6.58 | Resistance | 52-week high (inside the October 2025 gap) |
| $6.37 | Resistance | Lower edge of the unfilled Oct 13, 2025 gap ($6.37–$6.88) |
| $6.05 | Current | Oct 16, 2026 close |
| $5.89 | Support | 90-day 23.6% retracement; just below the $5.91 Aug 14 swing high and near the $5.90 1×ATR reference |
| $5.75 | Invalidation | 2×ATR technical invalidation level (4.9% below close) |
| $5.56 | Support | SMA20 and top of the unfilled Oct 2, 2026 gap ($5.44–$5.56) |
| $5.45 | Support | SMA60; near the bottom of the Oct 2 gap |
What to Watch
- Whether daily closes hold above the $5.89–$5.91 area — the old August ceiling should now act as a floor if the breakout is genuine.
- Volume on any pullback: lighter volume on down days would fit a healthy pause; heavy-volume down days back into the old range would not.
- ADX moving above 25, which would mark the trend as strong rather than emerging.
- Price behaviour on reaching $6.37 — the lower edge of the October 2025 gap — and the $6.58 52-week high.
- Mansfield RS staying above +13.5% (last week's reading); a reversal in RS would undercut the strongest leg of the setup.