Yancoal Australia
This analysis is based on closing-price data as of October 30, 2026. Whether you're researching Yancoal Australia (YAL) on the ASX or learning how to read stock charts, here are objective support, resistance and technical invalidation levels built from the RSI, MACD and ATR indicators.
Yancoal Australia closed at $6.12 on October 30, unchanged on the day, after a one-session pullback from the Oct 27 close of $6.25 that found its floor above the 90-day anchored VWAP ($6.01) and recovered the next session. On Oct 29 the short, medium and longer moving averages lined up again (SMA5 > SMA20 > SMA60) — a re-formation, not a first: the same ordering formed in March, April and late August 2026 and broke each time, most recently on Sep 18. The two-year picture is still a range: after the March–April 2026 spike to a $9.06 high, the stock has closed between $5.46 and $6.49 since late July, sits 32.5% below that high and just under its two-year anchored VWAP ($6.25), with ADX near 20 and Mansfield RS negative but improving.
Snapshot as of October 30, 2026
| Item | Value | Reading |
|---|---|---|
| Close | $6.12 | −32.5% from 52w high · +28.6% from 52w low |
| 52-week range | $4.76 – $9.06 | Close in the lower-middle of the range; the high is from the March–April 2026 spike |
| SMA 5 / 20 / 60 | $6.13 / $5.98 / $5.97 | Aligned SMA5 > SMA20 > SMA60 since Oct 29 (re-formed; previously broke Sep 18). SMA20 leads SMA60 by under two cents, and the close sits fractionally below SMA5 |
| Bollinger (20) | $6.29 / $5.98 / $5.68 | Band width 10.13%; close in the upper half of the band, below the upper band |
| aVWAP (2y anchor Aug 20, 2025) | $6.25 | Price just below the long-term anchored average — overhead supply on the two-year frame |
| aVWAP (90d anchor Aug 20, 2026) | $6.01 | Price above the short-term anchored average |
| RSI(14) | 54.2 | Neutral, above 50; a bearish RSI divergence is flagged on both frames (shallow — see ④) |
| Mansfield RS (vs the S&P/ASX 200) | −1.54% | Underperforming but rising: +0.17 points on the week and +3.36 on the month (negative, improving) |
| MACD (12,26,9) | 0.0576 / 0.0397 / +0.0179 | Golden cross on Oct 9 (90d frame; Oct 8 on the 2y frame), both lines above zero |
| ADX(14) | 20.0 | Emerging on the 90-day frame (19.5, ranging, on two years) — trend strength right at the threshold |
| ATR(14) | $0.237 (3.9%) | 2×ATR spans about 7.7% of the share price |
| OBV (2y / 90d) | early accumulation / accumulation | Above MA20 on both frames (flat on 2y, rising on 90d); bullish OBV divergence on the 90-day frame |
| Volume vs 20d avg | 0.739× | 2,240,343 shares against a 3,030,165 average, on a day when market-wide volume was in its normal range |
| 1×ATR / 2×ATR technical invalidation | $5.88 / $5.65 | Volatility-based structural reference levels below the close |
① Price & Moving Averages
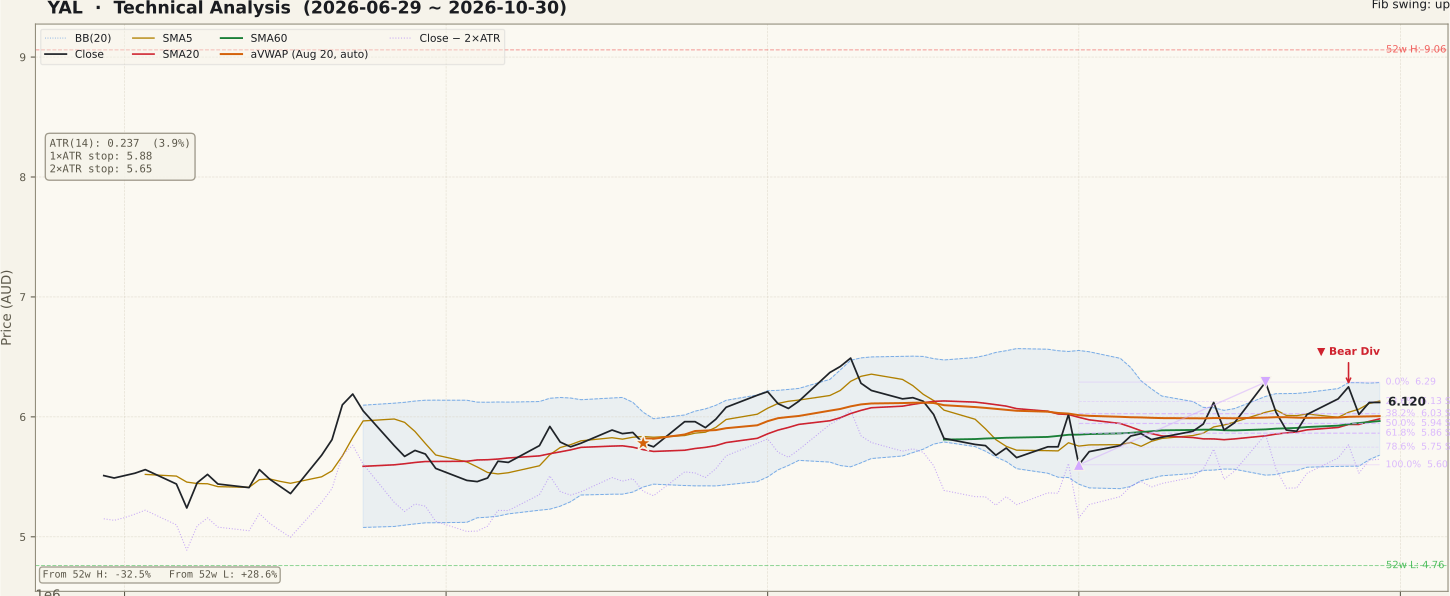
YAL_price-90d-2026-11-01.svgOn the two-year chart, Yancoal spent most of 2025 between roughly $4.60 and $6.70, spiked in March–April 2026 to a $9.06 high, and gave the move back through May–July. Since late July closes have stayed between $5.46 (Aug 4) and $6.49 (Sep 9), and SMA20 and SMA60 have flattened inside that band. The 90-day chart shows the October swing: a $5.60 close on Oct 1, recovery above SMA20 from Oct 12, a $6.29 close on Oct 19, a pullback that briefly lost SMA60 on Oct 21–22, then a second push to $6.25 on Oct 27. The Oct 28 decline (−3.68%) closed at $6.02, right on the 38.2% retracement of the Oct 1 – Oct 19 swing ($6.03) and above the 90-day anchored VWAP ($6.01), and price was back at $6.12 by Oct 29. The two-year anchored VWAP ($6.25), the Oct 27 close and the Oct 19 high ($6.29) form a tight overhead band; one unfilled gap sits much higher at $7.89–$8.11 (Apr 8, 2026). Note that the 23.6% retracement ($6.13) and the two-year 78.6% retracement ($6.16) are tagged as support in the data but sit fractionally above the close, so they are treated here as at-the-price reference lines rather than support.
② Volume

YAL_volume-90d-2026-11-01.svgThe Oct 30 session traded 0.739× its 20-day average, and Oct 29 was similarly light. The Oct 23–27 advance came on modestly above-average volume, while the Oct 28 decline traded below average — a mild positive, since the pullback did not draw heavy supply. The larger participation spike of the month was Oct 19 (+5.71% on about 1.7× average volume), which fell in the window of the company's September-quarter production report but stayed well below the event-scale readings (8% moves on 3× volume) that mark a single-bar news reaction. No bar in the last 60 sessions moved more than 8% or traded more than 3× average. Market-wide volume ran in a normal 0.65–1.30× band through Oct 12–30 (0.92× on Oct 30), so these readings are not distorted by a broad-market event. The flip side of the light finish is that the latest bars show little conviction either way.
③ MACD

YAL_macd-90d-2026-11-01.svgMACD crossed above its signal line on Oct 9 on the 90-day frame (Oct 8 on two years — a small warm-up difference between the calculations) from below zero, and the cross has now held for three weeks through two pullbacks. Both lines are positive (MACD 0.0576, signal 0.0397) and the histogram sits at +0.0179. These values are still close to zero: they describe momentum that has turned from mildly negative to mildly positive, not a strong impulse.
④ RSI

YAL_rsi-90d-2026-11-01.svgRSI(14) is 54.2 — neutral, above the 50 midline and far from overbought. The data flags a bearish RSI divergence on both frames: at the Oct 27 push to $6.25, RSI reached 59.0, below the RSI readings of the mid-October advance. The divergence is shallow — the Oct 27 close was itself just below the Oct 19 close of $6.29, and the RSI gap is small — so it reads as a caution about fading momentum near the overhead band rather than a reversal signal. A divergence is only a possibility until price confirms it by losing nearby support.
⑤ Mansfield Relative Strength

YAL_rs-90d-2026-11-01.svgMansfield RS vs the S&P/ASX 200 is −1.54%: the stock still lags the index, but the line is rising. A week ago it was −1.71 and a month ago −4.90, so the change is +0.17 points on the week and +3.36 on the month — negative territory, improving toward zero. Most of the improvement came in early-to-mid October; the past week added little. Until RS holds above zero, the relative picture is "less weak" rather than outright strong.
⑥ ATR & ADX

YAL_atr_adx-90d-2026-11-01.svgATR(14) is $0.237, or 3.9% of the share price, slightly off its mid-October expansion as the latest bars narrowed. ADX is 20.0 on the 90-day frame (emerging) and 19.5 on two years (ranging) — right at the threshold between a range and a forming trend. A rising ADX from here would show the October swing gaining persistence; a reading that slips back under 20 would keep the four-month range as the dominant structure. The 2×ATR technical invalidation level at $5.65 sits about 7.7% below the close.
⑦ OBV

YAL_obv-90d-2026-11-01.svgOn the 90-day frame OBV is in accumulation — above its MA20 and rising. The distance to the MA20 is reported as +269.17%, but that figure is inflated because the 90-day OBV MA20 sits near zero (negative), so it says little about magnitude; on the two-year frame the state is early accumulation with a flat slope and a +28.83% distance. These percentages measure distance from the moving average, not divergence. Separately, the data flags a bullish OBV divergence on the 90-day frame: price made a lower low from $6.07 on Sep 3 to $5.88 on Oct 22, while OBV made a higher low (−7,709,837 to −6,843,204). Volume flow held up better than price into the October lows — a possible sign of support underneath, not a confirmed turn. No OBV divergence is flagged on the two-year frame.
Bull Case vs Bear Case
Bull Case
- SMA5 > SMA20 > SMA60 re-formed on Oct 29, with the close above SMA20 since Oct 12 and above SMA60 since Oct 23
- The Oct 28 pullback closed at $6.02, above the 90-day anchored VWAP ($6.01), on below-average volume
- Bullish OBV divergence on the 90-day frame (Sep 3 vs Oct 22); OBV above MA20 on both frames
- MACD golden cross (Oct 9) intact for three weeks, both lines above zero
- Mansfield RS improving: +3.36 points on the month
- ADX at 20.0 on the 90-day frame — at the edge of a forming trend, with RSI neutral at 54.2
Bear Case
- The moving-average alignment has formed and failed three times this year (March, April, Aug 31 – Sep 18), and SMA20 leads SMA60 by under two cents
- Price is just below the two-year anchored VWAP ($6.25) and has twice failed to close above $6.29 in October
- Bearish RSI divergence flagged on both frames at the Oct 27 push
- Mansfield RS still negative (−1.54%) and added only +0.17 points on the week
- Last two sessions on light volume (0.739× on Oct 30) — little conviction behind the recovery
- 32.5% below the 52-week high inside a four-month range with ADX 19.5 on the two-year frame
Scenarios
| Scenario | Probability | Path | Trigger / Invalidation |
|---|---|---|---|
| Range top gives way | 35% | The re-formed moving-average alignment holds, price works through the $6.25 two-year aVWAP and the $6.29 Oct 19 high toward the upper part of the range near $6.49 | Trigger: daily closes above $6.29 on above-average volume, with Mansfield RS moving above zero. Invalidation: a close back below SMA20 ($5.98) |
| Range continues between $5.88 and $6.29 | 40% | Price oscillates above the flat SMA20 / SMA60 pair, failing again at the $6.25–$6.29 band as the RSI divergence suggests, with ADX hovering near 20 | Trigger: closes stay between the Oct 22 low ($5.88) and the Oct 19 high ($6.29) |
| Alignment fails again | 25% | Price slips back under SMA20 / SMA60, the alignment breaks as it did on Sep 18, and the $5.88 swing low and the $5.65 level come into play | Trigger: a daily close below $5.88. Invalidation of the swing structure: a close below $5.65 |
Key Levels & Volatility References
| Level | Role | Distance | Basis |
|---|---|---|---|
| $6.29 | Resistance | +2.8% | Oct 19 close — October closing high and the 0% anchor of the Oct 1 – Oct 19 swing; upper Bollinger Band ($6.29) at the same level |
| $6.25 | Resistance | +2.1% | Two-year aVWAP (anchor Aug 20, 2025) and the Oct 27 close |
| $6.12 | Current | — | Oct 30, 2026 close; SMA5 ($6.13), the 90-day 23.6% retracement ($6.13) and the two-year 78.6% retracement ($6.16) sit at the price |
| $6.01 | Support | −1.9% | 90-day aVWAP (anchor Aug 20, 2026), with the 38.2% retracement ($6.03) and the Oct 28 close ($6.02) just above |
| $5.98 | Support | −2.2% | SMA20, with SMA60 ($5.97) and the 50% retracement ($5.94) clustered |
| $5.88 | Support | −3.9% | Oct 22 close (October pullback low), 1×ATR level ($5.88) and the 61.8% retracement ($5.86) |
| $5.65 | Invalidation | −7.7% | 2×ATR technical invalidation level; the Oct 1 swing low ($5.60) sits just below |
What to Watch
- The $6.25–$6.29 band. The two-year anchored VWAP, the Oct 27 close and the Oct 19 high sit together overhead; closes above it on above-average volume would mark the first break of the October range top.
- The moving-average alignment. SMA20 leads SMA60 by under two cents; a close back below the $5.97–$5.98 pair would repeat the Sep 18 failure.
- The 90-day anchored VWAP at $6.01. It absorbed the Oct 28 pullback; closes below it would shift the short-term frame back toward the $5.88 low.
- Mansfield RS crossing zero. At −1.54% the line is close; a sustained move above zero would mark outperformance versus the S&P/ASX 200.
- The $5.65 level. A daily close below the 2×ATR technical invalidation level would undo the October swing structure.