ST Barbara
This analysis is based on closing-price data as of October 30, 2026. Whether you're researching ST Barbara (SBM) on the ASX or learning how to read stock charts, here are objective support, resistance and technical invalidation levels built from the RSI, MACD and ATR indicators.
ST Barbara closed the week at $0.825, 11.3% below its 52-week high of $0.93 (September 18) and more than double its 52-week low of $0.405. On the two-year chart, the stock spent July and August turning a mid-year low into a sharp advance, then gave back part of it through early October without losing the rising SMA60, which now sits at $0.763. The last two weeks read as a pullback being rebuilt: the SMA5 > SMA20 > SMA60 stack re-formed on October 21, MACD crossed back above its signal line on October 28, and Mansfield relative strength versus the S&P/ASX 200 is a firm +27.6%. Against that, the RSI carries a bearish divergence into the October 29 high, ADX at 14.9 says there is no trend in force, and Friday's −2.9% session came on volume of only 0.72× the 20-day average — so this is a constructive structure inside a range, not a confirmed resumption.
Snapshot as of October 30, 2026
| Item | Value | Reading |
|---|---|---|
| Close | $0.825 | −11.3% from 52w high · +103.7% from 52w low |
| 52-week range | $0.405 – $0.93 | Upper part of the range; the $0.93 high printed on September 18 |
| SMA 5 / 20 / 60 | $0.825 / $0.799 / $0.763 | Aligned again since Oct 21; close sitting on SMA5 and above SMA20 and SMA60 |
| Bollinger (20) | $0.859 / $0.799 / $0.738 | Band width 15.27%; price in the upper half of the channel |
| aVWAP (2y anchor Dec 24, 2024) | $0.540 | Price well above — the long-horizon average holder is comfortably in profit |
| aVWAP (90d anchor Sep 10, 2026) | $0.821 | Price only fractionally above — the short-horizon average is roughly break-even |
| RSI(14) | 54.1 | Neutral, just above 50; bearish divergence flagged into the Oct 29 high |
| Mansfield RS (vs the S&P/ASX 200) | +27.6% | Outperforming, rising; +6.6 vs a week ago (21.0), −0.8 vs a month ago (28.5) |
| MACD (12,26,9) | 0.0126 / 0.0103 / +0.0023 | Golden cross Oct 28, 2026; both lines above zero, histogram small |
| ADX(14) | 14.9 | Below 20 — ranging (14.4 on the two-year frame) |
| ATR(14) | $0.043 (5.2%) | Wide daily range relative to price — typical of a sub-dollar gold producer |
| OBV (2y / 90d) | accumulation / accumulation | Above MA20 and rising on both frames; MA20 gap +23.87% (2y) and +28.14% (90d) |
| Volume vs 20d avg | 0.72× | 7,907,845 shares against a 10,986,395 average on a down session |
| 1×ATR / 2×ATR technical invalidation | $0.782 / $0.74 | Volatility-based structural reference levels below the close |
① Price & Moving Averages
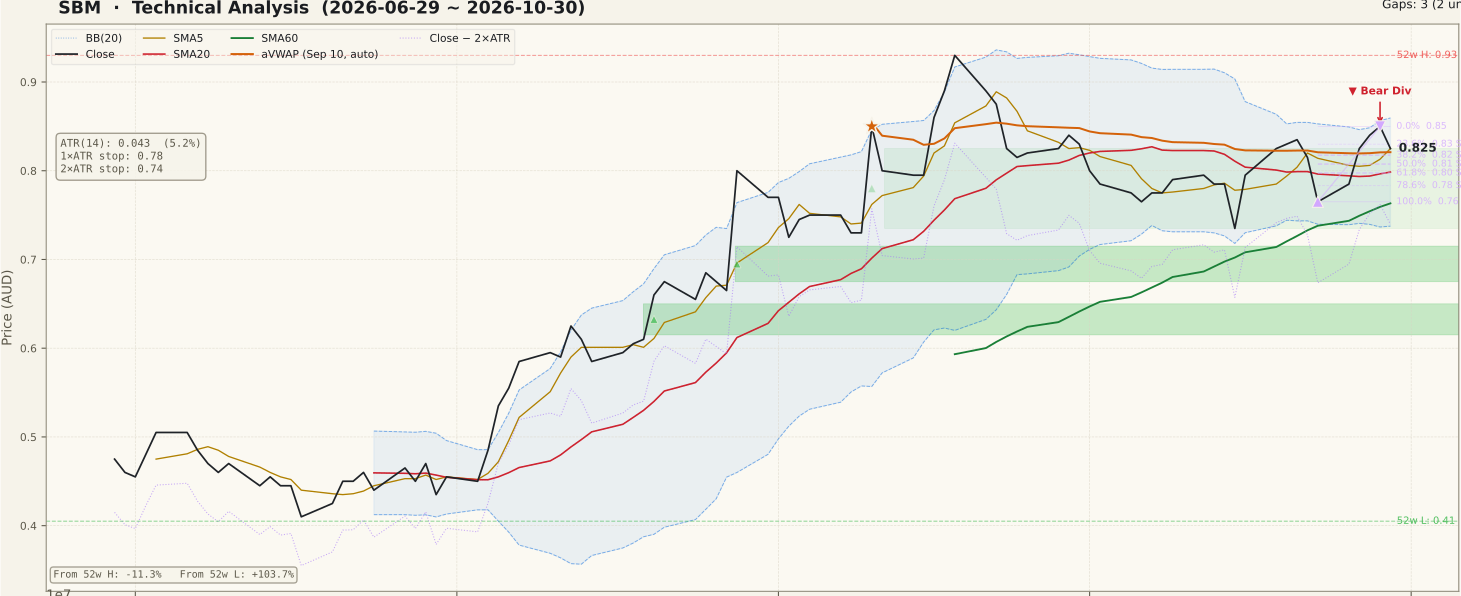
SBM_price-90d-2026-11-01.svgThe 90-day window has three chapters. From late July through mid-September price climbed in steps from the mid-$0.40s to the $0.93 high on September 18, with two large up-sessions along the way — August 28 (+20.3%) and September 10 (+16.4%) — that left two unfilled gaps beneath the current structure at $0.615–$0.65 (August 20) and $0.675–$0.715 (August 28). The second chapter was a pullback into early October; the price data records a A$0.05 per-share distribution going ex on September 23, and because the chart plots unadjusted closes, part of that day's drop is mechanical rather than a change in demand. The third chapter is the current one: a base in the $0.765–$0.79 area, with the October 6 and October 23 closes both at $0.765, and a lift back to $0.825.
The moving averages now line up again — SMA20 $0.799 above SMA60 $0.763, with SMA5 at $0.825 equal to the close. That stack first formed on August 18, broke on October 2 during the pullback, and re-formed on October 21. The close has been above SMA60 continuously since early August, which is the main structural argument for reading this as a pullback inside an advance rather than a reversal. The Bollinger Bands sit at $0.738–$0.859 around a $0.799 mid. The two-year Fibonacci swing (September 9 low $0.73 to September 18 high $0.93) places its 50% level at $0.830, 38.2% at $0.854 and 23.6% at $0.883 — all above the close, so although the up-swing convention labels them supports, price is currently testing them from below. The short 90-day swing (October 23 low $0.765 to October 29 high $0.85) has the close between its 23.6% ($0.830) and 38.2% ($0.818) levels. The 90-day aVWAP anchored on September 10 sits at $0.821, almost exactly at the close.
② Volume

SBM_volume-90d-2026-11-01.svgFriday traded 7,907,845 shares against a 20-day average of 10,986,395, a Vol/Avg of 0.72×. The −2.9% decline therefore came on below-average participation, which reads as a pause rather than a distribution day. The flip side is that the October 27 advance (+5.1%) — which coincided with the company's scheduled quarterly report — also came on below-average volume, so neither direction has been confirmed by turnover this week. For context, the wider ASX universe this site screens was itself trading at roughly normal volume through mid-to-late October, so the light readings are specific to this stock's recent sessions rather than a market-wide lull.
The tallest bars in the window belong to late August and September 10, when the stock moved on volume several times its running average. Those spikes are well outside the current week and still inflate the background, but the 20-day average has been easing as they roll off. The mid-October cluster (October 15 −6.4%, October 16 +8.2%, October 23 −6.1%) traded above average but well short of the late-summer spikes. Daily turnover in the A$8–10m range is adequate for an ASX small-cap, but at a sub-dollar price each half-cent tick is about 0.6% of value, which widens the effective spread and makes intraday swings look larger than they are.
③ MACD

SBM_macd-90d-2026-11-01.svgMACD sits at 0.0126 against a signal line of 0.0103, giving a histogram of +0.0023, after a golden cross on October 28. Both lines remain above zero, so the broader momentum regime from the August–September advance never flipped negative; what the panel shows is a long, orderly decay from the September peak followed by a flattening through October. The cross is small and came after an earlier short-lived cross in mid-October that reversed within days, so it is better read as momentum stabilising than as a fresh impulse. A histogram that widens over the next several sessions strengthens the reading; another quick re-cross below the signal line returns the panel to neutral.
④ RSI

SBM_rsi-90d-2026-11-01.svgRSI(14) reads 54.1 — neutral, just above the 50 line. The tool flags a bearish divergence: price made a marginally higher closing peak on October 29 ($0.85, RSI 58.88) than on September 29 ($0.84, RSI 65.27), while RSI made a lower peak. That says the recent push carried less momentum than the late-September bounce. The divergence is mild in price terms (one cent) and RSI has stayed in the 40s and 50s throughout the pullback without approaching oversold, so it describes fading thrust rather than an imminent turn. A divergence is a possibility, not a verdict; it would gain weight only if price slipped back below the $0.765 base it has twice tested.
⑤ Mansfield Relative Strength

SBM_rs-90d-2026-11-01.svgMansfield RS vs the S&P/ASX 200 stands at +27.6% with a rising slope — clearly in outperformance territory, and on the same side of zero since August. Week over week it improved by 6.6 points (from 21.0), so in the positive zone that is acceleration. Month over month it is 0.8 points lower (from 28.5), which in the positive zone means a slight slowing: relative strength has held most of its September level through the pullback but has not exceeded it. On the two-year panel the reading sits well below the peaks of early 2026, so the outperformance is real but not extreme by this stock's own history.
⑥ ATR & ADX

SBM_atr_adx-90d-2026-11-01.svgATR(14) is $0.043, or 5.2% of price — a wide daily range that comes off its September peak but remains well above the July readings. That width is why the volatility references sit where they do: 1×ATR at $0.782 and 2×ATR at $0.74, the latter about 10% below the close. ADX(14) reads 14.9 (14.4 on the two-year frame), below 20 and still drifting lower after the September trend faded. A low ADX alongside a re-formed moving-average stack is a common pullback signature: the trend structure is intact on the averages, but no directional force is currently being applied. A rising ADX from here would be the first sign that a new leg has started in one direction or the other.
⑦ OBV

SBM_obv-90d-2026-11-01.svgOBV is in accumulation on both timeframes — above its 20-day moving average and rising — with the gap to that average at +28.14% on the 90-day frame and +23.87% on the two-year frame (that figure measures distance from the MA20, not a divergence). No OBV divergence is flagged on either frame. On the two-year panel OBV pushed to a new high in September and has stayed close to it through the pullback, which says volume on down days has been lighter than on up days. That is the most constructive of the volume-based readings on the page, though at 0.72× average on Friday the latest contribution was small.
Bull Case
- Moving-average stack re-formed on Oct 21: SMA5 $0.825 > SMA20 $0.799 > SMA60 $0.763, with the close above SMA60 continuously since early August.
- Mansfield RS +27.6% vs the S&P/ASX 200 and rising, up 6.6 points on the week.
- MACD golden cross on Oct 28 with both lines above zero (0.0126 vs 0.0103).
- OBV in accumulation and rising on both frames (MA20 gap +28.14% on 90d, +23.87% on 2y), no OBV divergence.
- The $0.765 base held twice (Oct 6 and Oct 23 closes) above the rising SMA60.
- Friday's −2.9% session came on 0.72× average volume — a light pullback rather than heavy distribution.
Bear Case
- Bearish RSI divergence: $0.84 on Sep 29 at RSI 65.27 versus $0.85 on Oct 29 at RSI 58.88.
- ADX 14.9 — no trend in force; the moving-average stack is not yet backed by directional strength.
- The Oct 27 advance also came on below-average volume, so the rebound lacks turnover confirmation.
- Overhead retracement levels of the September swing ($0.830, $0.854, $0.883) all sit above the close.
- Mansfield RS is 0.8 points below a month ago — outperformance is holding rather than expanding.
- ATR at 5.2% of price places the 2×ATR invalidation level about 10% below the close, a wide band.
Scenarios
| Scenario | Probability | Path | Trigger / Invalidation |
|---|---|---|---|
| Range continues between the base and the October high | 45% | Price oscillates between the $0.765 base and the $0.85 high while ADX stays below 20 and the RSI divergence remains unresolved. | Persists while closes stay between $0.765 and $0.86; ends on a daily close outside either edge. |
| Pullback resolves higher | 30% | A close above the $0.85–$0.86 zone (Oct 29 high, upper Bollinger Band) opens the 23.6% retracement at $0.883 and then the $0.93 52-week high. | Trigger: daily close above $0.86 on volume above the 20-day average, with ADX turning up. Invalidated by a fall back below $0.82. |
| Base gives way | 25% | A close below the $0.765 base and the SMA60 ($0.763) confirms the RSI divergence and brings the $0.74 invalidation level and the unfilled $0.675–$0.715 gap into view. | Trigger: daily close below $0.763. A close below $0.74 (2×ATR) invalidates the pullback structure. |
Key Levels & Volatility References
| Price | Role | Basis |
|---|---|---|
| $0.93 | Resistance | 52-week high (Sep 18) — 0% of the two-year Fibonacci swing |
| $0.85 | Resistance | Oct 29 high (0% of the 90-day swing); 2y 38.2% retracement $0.854 and upper Bollinger Band $0.859 just above |
| $0.825 | Current | Oct 30 close; SMA5 $0.825 |
| $0.82 | Support | 90-day aVWAP $0.821 (anchor Sep 10); 90-day 38.2% retracement $0.818 |
| $0.80 | Support | SMA20 / Bollinger mid $0.799; 90-day 61.8% $0.797; 2y 61.8% $0.806 |
| $0.765 | Support | Oct 6 and Oct 23 closes (100% of the 90-day swing); SMA60 $0.763 |
| $0.74 | Invalidation | 2×ATR technical invalidation level; lower Bollinger Band $0.738 |
What to Watch
- Whether a close above $0.86 arrives with volume above the 20-day average — the confirmation the October rebound has so far lacked.
- The $0.765 base and the SMA60 at $0.763: two tests have held; a close below both would turn the RSI divergence from a caution into a signal.
- ADX lifting back above 20 — the first evidence that a new directional leg has begun.
- Mansfield RS versus its September level (28.5): moving above it would show outperformance expanding again rather than merely holding.
- The MACD histogram after the Oct 28 cross — widening adds weight, a quick re-cross below the signal line returns momentum to neutral.