Credit Corp Group
This analysis is based on closing-price data as of October 30, 2026. Whether you're researching Credit Corp Group (CCP) on the ASX or learning how to read stock charts, here are objective support, resistance and technical invalidation levels built from the RSI, MACD and ATR indicators.
Credit Corp Group closed at $15.01 on October 30, above its prior 20-session closing high ($14.99, Oct 28) and at the highest close in the 52-week window. The two-year chart is a deep round trip — a slide from about $18 to a $9.50 low in March 2026 — followed by a seven-month recovery that has kept the close above SMA60 since May 7 and lifted relative strength versus the S&P/ASX 200 to +15.52%. The short-term picture is constructive but still measured: the 52-week high of $15.34 was printed intraday on Oct 28 and rejected the same day, volume on the latest close was only 1.11× its 20-day average, and ADX at 13.2 says the advance is a slow grind rather than an established trend.
Snapshot as of October 30, 2026
| Item | Value | Reading |
|---|---|---|
| Close | $15.01 | −2.2% from 52w high · +58.0% from 52w low; highest close in the 52-week window |
| 52-week range | $9.50 – $15.34 | The low dates from March 2026; the high is the Oct 28 intraday print |
| SMA 5 / 20 / 60 | $14.79 / $14.47 / $14.06 | Close > SMA5 > SMA20 > SMA60; the SMA stack has held since Oct 22 |
| Bollinger (20) | $15.00 / $14.47 / $13.93 | Band width 7.42%; the close is level with the upper band |
| aVWAP (2y anchor Feb 3, 2026) | $12.35 | Price well above the long-term anchored average |
| aVWAP (90d anchor Aug 4, 2026) | $13.82 | Price above the short-term anchored average |
| RSI(14) | 63.4 | Above 50, below 70; no RSI divergence flagged |
| Mansfield RS (vs the S&P/ASX 200) | +15.52% | Outperforming, rising; +0.33 on the week, +3.51 on the month (positive, accelerating) |
| MACD (12,26,9) | 0.2077 / 0.1563 / +0.0514 | Golden cross on Oct 23, above zero (two-year frame 0.2081 / 0.1570 / +0.0511) |
| ADX(14) | 13.2 | Ranging (13.0 on the two-year frame) — no established trend strength |
| ATR(14) | $0.366 (2.4%) | Low-to-moderate volatility |
| OBV (2y / 90d) | early accumulation / accumulation | Above MA20 on both frames (flat on 2y, rising on 90d); no OBV divergence flagged |
| Volume vs 20d avg | 1.11× | 268,797 shares against a 241,950 average — modestly above average |
| 1×ATR / 2×ATR technical invalidation | $14.64 / $14.28 | Volatility-based structural reference levels below the close |
① Price & Moving Averages
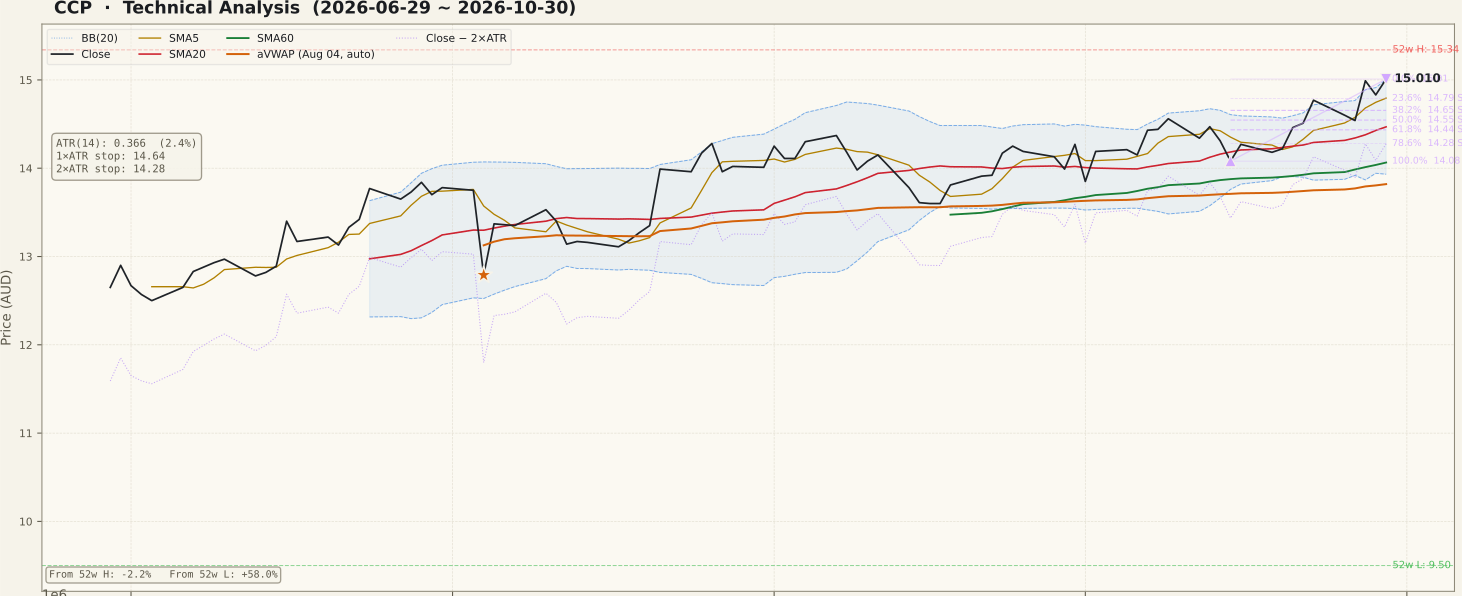
CCP_price-90d-2026-11-01.svgThe two-year frame shows two large swings. Price fell from about $18 in late 2024, rallied into August 2025, and then gave that back; a −16.7% session on Feb 3, 2026 anchors the two-year aVWAP ($12.35), and the decline ended at the $9.50 52-week low in March. Since then the chart has recovered steadily — the close has stayed above SMA60 continuously since May 7 — and the two-year aVWAP now sits well below price. Neither frame has an unfilled gap. The two-year Fibonacci set is drawn on the May 28 – Jun 22 swing ($10.98 to $13.10); price has since moved well above every level in that set, including the $13.10 swing high the chart labels as resistance, so it carries little reference value at the current price.
On the 90-day frame, price climbed through July to $13.84, fell −7.0% on Aug 4 on about 7× average volume (the bar anchoring the 90-day aVWAP at $13.82), recovered, and dipped again in mid-September around the ex-dividend date. October then built a stair-step: closes above the prior 20-session high on Oct 7–9, Oct 23, Oct 28 and Oct 30. The Oct 28 session reached $15.34 intraday — the new 52-week high — but closed at $14.99, leaving a long upper shadow; Oct 29 eased to $14.83 before Oct 30 closed at $15.01, the highest close of the run.
Condition timing: the SMA5 > SMA20 > SMA60 stack has re-formed several times since June and most recently on Oct 22, holding since. The close dipped under SMA5 for one session on Oct 27 and moved back above it on Oct 28; it has been above SMA20 since Oct 21. The close is level with the upper Bollinger Band ($15.00), and the band has widened to 7.42%. The 90-day Fibonacci swing runs from $14.08 (Oct 15) to $15.01 (Oct 30): 23.6% at $14.79, 38.2% at $14.65, 50% at $14.55 and 61.8% at $14.44 — a tight ladder of nearby supports that overlaps SMA5, the 1×ATR reference and SMA20.
② Volume

CCP_volume-90d-2026-11-01.svgThe Aug 4 decline and its Aug 5 rebound remain the tallest bars on the 90-day panel; nothing since has come close. The 20-day average is now 241,950 shares, and at roughly A$3–4 million of turnover a day the stock is liquid enough for the chart to be meaningful, though single bars can still move it.
The Oct 30 close traded 268,797 shares, 1.11× the 20-day average (the average includes the day itself). The heaviest bar of the latest week was Oct 28 at about 1.7× average — the session that printed the $15.34 high and then closed well off it. Across the screened ASX universe the median volume ratio ran 0.65–1.30× from Oct 12 to Oct 30 (0.92× on Oct 30), a normal backdrop, so CCP's participation was modestly above the market rather than unusual. This is better confirmation than the 0.875× Oct 23 bar, but still not a strong demand surge.
③ MACD

CCP_macd-90d-2026-11-01.svgThe MACD line is 0.2077 against a signal of 0.1563, a histogram of +0.0514, following a golden cross on Oct 23. Both lines are above zero, so the cross is a re-acceleration inside an existing uptrend rather than a turn from negative territory. The histogram has widened through the week, consistent with momentum building gradually. The two-year frame reads almost the same (0.2081 / 0.1570 / +0.0511).
④ RSI

CCP_rsi-90d-2026-11-01.svgRSI(14) is 63.4 on both frames — above the 50 midline and below the 70 overbought line. It has held a 45–70 corridor through most of the 90-day window and turned up again this month. No RSI divergence is flagged on either frame. The reading describes firm, not stretched, momentum: there is room before overbought, but on its own it is not a sign of an accelerating thrust.
⑤ Mansfield Relative Strength

CCP_rs-90d-2026-11-01.svgMansfield RS vs the S&P/ASX 200 is +15.52%, above zero (outperforming) with a rising slope. A week earlier it was 15.19 and a month earlier 12.01, so it gained 0.33 points on the week and 3.51 points on the month — positive and accelerating on both horizons, though the weekly gain is small after the previous week's jump. On the two-year panel RS spent most of 2025 and early 2026 below zero, crossed above it in late August 2026 and has climbed since. Outperformance against the benchmark is the most consistent feature of this chart; the screen's RS rank of 92 reflects it.
⑥ ATR & ADX

CCP_atr_adx-90d-2026-11-01.svgATR(14) is $0.366, or 2.4% of price, which puts the 1×ATR reference at $14.64 and the 2×ATR technical invalidation level at $14.28, 4.9% below the close. ATR has ticked up from its October lows as the daily ranges widened (the Oct 28 range alone was large). ADX is 13.2 (13.0 on the two-year frame), still in the ranging zone below 20. ADX measures strength, not direction: the price has risen, but not with enough persistence to register as a trend. A move through 20 would be the first sign of one forming.
⑦ OBV

CCP_obv-90d-2026-11-01.svgOBV is tagged accumulation on the 90-day frame (above its MA20 and rising) and early accumulation on the two-year frame (above its MA20 but flat). No OBV divergence is flagged on either frame. On the two-year panel, OBV built most of its gain during mid-2026 and has held it, so the recovery has been supported by net positive volume flow over the longer view.
The OBV-to-MA20 gap is +3.29% on the two-year frame and +53.3% on the 90-day frame. The 90-day figure looks large partly because that frame's OBV base is small; it measures distance from the moving average, not divergence.
Bull Case vs Bear Case
Bull Case
- Close of $15.01 above the prior 20-session closing high ($14.99) — the highest close in the 52-week window
- Mansfield RS +15.52% and accelerating (+0.33 on the week, +3.51 on the month)
- Close > SMA5 > SMA20 > SMA60; close above SMA60 since May 7
- MACD golden cross on Oct 23 above the zero line, histogram widening
- Price above both anchored VWAPs ($12.35 and $13.82)
- OBV above MA20 on both frames; accumulation on the 90-day frame
Bear Case
- The $15.34 52-week high printed intraday on Oct 28 was rejected the same session (close $14.99)
- ADX 13.2 — ranging, no measurable trend strength
- Latest close on only 1.11× average volume; no strong demand surge
- Close level with the upper Bollinger Band after a stair-step run
- The SMA stack has formed and broken repeatedly since June
- The 2×ATR invalidation level sits 4.9% below, within ordinary two-week noise
Scenarios
| Scenario | Probability | Path | Trigger / Invalidation |
|---|---|---|---|
| Range extension through the 52-week high | 35% | Price clears the $15.34 Oct 28 high and holds above it, extending the October stair-step | Trigger: a daily close above $15.34 on above-average volume, with ADX rising toward 20. Invalidation: a close back below $14.79 |
| Consolidation below the high | 45% | Price works sideways between roughly $14.47 (SMA20) and $15.34, retesting the $14.79–$14.55 Fibonacci and SMA5 zone | Trigger: closes back below $14.99 without a break of $14.47. The structure holds while closes stay above $14.28 |
| Breakout fails back into the range | 20% | The Oct 28 rejection marks a short-term top and price returns toward the $14.08 Oct 15 low and SMA60 ($14.06) | Trigger: a daily close below $14.28 (2×ATR technical invalidation) |
Key Levels & Volatility References
| Level | Role | Distance | Basis |
|---|---|---|---|
| $15.34 | Resistance | +2.2% | 52-week high (Oct 28 intraday print, rejected the same session) |
| $15.01 | Current | — | Oct 30, 2026 close; level with the $15.00 upper Bollinger Band |
| $14.79 | Support | −1.5% | SMA5 and the 90-day Fibonacci 23.6% retracement |
| $14.64 | Support | −2.4% | 1×ATR reference, with the Fibonacci 38.2% retracement ($14.65) alongside |
| $14.47 | Support | −3.6% | SMA20 / Bollinger mid line; Fibonacci 61.8% ($14.44) just below |
| $14.28 | Invalidation | −4.9% | 2×ATR technical invalidation level; Fibonacci 78.6% ($14.28) at the same price |
| $14.08 | Support | −6.2% | Oct 15 swing low (90-day Fibonacci 100%); SMA60 ($14.06) just below |
What to Watch
- The $15.34 high. A daily close above the Oct 28 intraday high would show the rejection has been absorbed; another failure there would make it a firmer ceiling.
- Volume on further gains. Recent closes ran at 0.9–1.7× average. Clearly above-average volume on further advances is the confirmation that is still thin.
- ADX rising through 20. At 13.2 the chart has no measurable trend strength; a rising ADX would show the advance gaining persistence.
- Mansfield RS. The weekly gain slowed to +0.33; a flattening or turn lower would be the first sign of the outperformance fading.
- The $14.28 level. A daily close below the 2×ATR technical invalidation level would undo the October breakout structure.