South32
This analysis is based on closing-price data as of August 14, 2026. Whether you're researching South32 (S32) on the ASX or learning how to read stock charts, here are objective support, resistance and technical invalidation levels built from the RSI, MACD and ATR indicators.
South32 closed the week at $4.76, only 8.3% under a 52-week high of $5.19 and 88.9% above the $2.52 low that anchors the two-year chart. The larger structure is a genuine uptrend: after basing through the middle of 2025, price built a rising staircase from late 2025 into 2026, spent the March–July stretch consolidating, then advanced from the $3.90 swing low of July 17 to a $5.14 closing high on August 11. What the last three sessions produced is a shallow give-back from that high — the close has slipped under the SMA5 at $4.98 but remains above the SMA20 ($4.68), the SMA60 ($4.42) and both anchored VWAPs, with Mansfield relative strength at +18.1% versus the S&P/ASX 200 and ADX at 30.6. The reasonable lens, then, is a pullback inside an established trend rather than a topping process — with the honest caveat that the give-back arrived on 1.32× average volume and that relative strength has cooled from +23.3% a week ago.
Snapshot as of August 14, 2026
| Item | Value | Reading |
|---|---|---|
| Close | $4.76 | −8.3% from 52w high · +88.9% from 52w low |
| 52-week range | $2.52 – $5.19 | Upper end of the range; the high was set in the week just ended |
| SMA 5 / 20 / 60 | $4.98 / $4.68 / $4.42 | Rising and correctly stacked; close above the 20- and 60-day, below the 5-day |
| Bollinger (20) | $5.21 / $4.68 / $4.16 | Band width 22.4% — expanded by the advance; price back on the mid-line |
| aVWAP (2y anchor Apr 7, 2025) | $3.55 | Price 34% above — the long-horizon average cost base is well below |
| aVWAP (90d anchor Jul 1, 2026) | $4.39 | Price above — positioning since the July 1 volume event is onside |
| RSI(14) | 55.4 | Back to mid-range after tagging the overbought band earlier in August; no divergence flagged |
| Mansfield RS (vs the S&P/ASX 200) | +18.1% | Outperforming; +13.7 above the +4.4 reading of a month ago, but −5.1 week-over-week |
| MACD (12,26,9) | 0.1873 / 0.1750 / +0.0124 | Golden cross of Jul 14, 2026 intact; both lines above zero, histogram still positive but narrowing |
| ADX(14) | 30.6 | Above 25 — an established trend (31.0 on the 90-day frame) |
| ATR(14) | $0.158 (3.3%) | An ordinary daily range for a large ASX resources name |
| OBV (2y / 90d) | accumulation / accumulation | Both frames above their MA20 and rising; divergence +3.8% and +12.2% |
| Volume vs 20d avg | 1.32× | 24,599,077 shares against an 18,661,661 average — the give-back drew above-average turnover |
| Unfilled gap | $4.08 – $4.17 | Support gap of Jul 21, 2026, still open beneath the structure |
| 1×ATR / 2×ATR technical invalidation | $4.60 / $4.44 | Volatility-based structural reference levels below the close |
① Price & Moving Averages
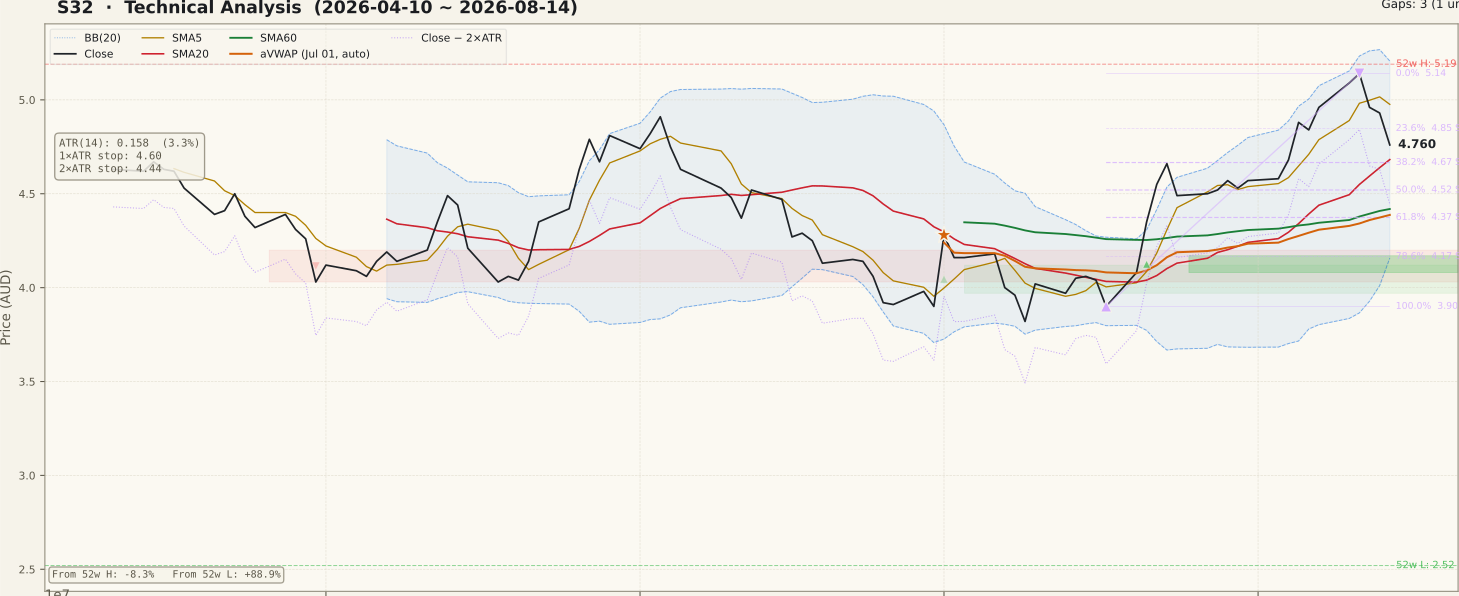
S32_price-90d-2026-08-16.svgThe two-year frame shows three distinct regimes: a $3.0–$3.8 range through late 2024, a sharp decline in April 2025 into the $2.52 low that the chart tool selected as its long-horizon VWAP anchor, and a trend advance from late 2025 that has carried price to the current $5.19 high. The 90-day window isolates the most recent leg. Price drifted down to the $3.90 low of July 17, 2026, then climbed in a near-continuous run to a $5.14 close on August 11 before easing to $4.76. That $3.90-to-$5.14 move is the swing the retracement grid is measured from, and the current close sits between its 23.6% ($4.85) and 38.2% ($4.67) levels — a shallow give-back by any standard.
The moving-average stack is intact and rising: SMA5 $4.98 above SMA20 $4.68 above SMA60 $4.42. The close has slipped beneath the 5-day line, which is what the first days of any pullback look like, but it remains comfortably above the 20- and 60-day lines. Bollinger Bands now span $4.16 to $5.21 around a $4.68 mid, with band width at 22.4% — wide, because a vertical advance widens bands mechanically. Price has returned almost exactly to that mid-line, which is also where the SMA20 sits, making $4.68 the single most watchable price on the chart. Both anchored VWAPs are below: the two-year line at $3.55 and the 90-day line at $4.39, the latter anchored to the July 1, 2026 session — the day South32 announced a binding agreement to divest its aluminium value chain to Alcoa, and the heaviest-turnover session of the 90-day window. That event sits roughly six weeks behind the current close and is stated here as chart context only. Below the structure, an unfilled support gap from July 21 at $4.08–$4.17 lines up with the 78.6% retracement ($4.17) and the lower Bollinger Band ($4.16), giving the base of this swing an unusually dense confluence.
② Volume

S32_volume-90d-2026-08-16.svgFriday traded 24,599,077 shares against a 20-day average of 18,661,661 — a Vol/Avg ratio of 1.32×. This is the one reading on the page that argues against complacency. A pullback on light turnover is routine profit-taking; a pullback on a third more volume than average means real supply met the market on the way down. It is not, by itself, distribution — a single session cannot establish that — but it is the kind of detail a beginner skips and a careful reader files away.
The wider 90-day panel is dominated by two clusters. The first is the pair of outsized bars around July 1, the largest on the window and several multiples of the running average, which is the fingerprint of a news event rather than ordinary two-way trade. The second is the run of elevated green bars through the August advance, where up-days consistently carried more turnover than down-days — the pattern that a genuine markup phase produces. South32 is a large, liquid ASX name, so volume and OBV signals here carry more weight than they would in a thin small-cap where a single parcel can distort the series.
③ MACD

S32_macd-90d-2026-08-16.svgMACD registered a golden cross on July 14, 2026 — two sessions before the $3.90 swing low — and that cross is still in force a month later. The line sits at 0.1873 against a signal of 0.1750, with a histogram of +0.0124. Both lines are well above zero, which places this in the mature rather than the early part of a momentum cycle; the textbook "high-conviction" cross is the one that fires far below zero, and this is not that.
The detail to note on the 90-day panel is the histogram's shape. It expanded steadily through the late-July and early-August advance, peaked, and has been shrinking through the last few bars even though it remains green. A narrowing positive histogram is the earliest and least reliable warning that momentum is decelerating — it precedes a dead cross when one comes, but it also resolves upward more often than not while price stays above its 20-day line. A histogram that turns negative while price is beneath $4.68 would be the version of this signal worth taking seriously.
④ RSI

S32_rsi-90d-2026-08-16.svgRSI(14) reads 55.4 — mid-range, above the 50 pivot, and a long way from either extreme. The 90-day panel shows the oscillator pushing into the overbought band during the August advance and then rolling back to the current level as price eased; no divergence was detected on either timeframe, so the peak-to-peak comparison that would flag exhaustion is simply not present here.
Two readings deserve care. First, a move out of overbought territory is not the same as a bearish signal: in strong trends the RSI habitually cycles between roughly 40 and 80, and the 50 line — not 30 — is the level that tends to define a trend's floor. Second, the reset itself is constructive in one narrow sense, because it removes the stretched condition that made the advance vulnerable, without price having given up much ground. The unhelpful conclusion would be to read 55.4 as either strength or weakness on its own; it is a neutral number whose meaning comes entirely from the price structure around it, which currently rests on the $4.68 shelf.
⑤ Mansfield Relative Strength

S32_rs-90d-2026-08-16.svgMansfield RS versus the S&P/ASX 200 stands at +18.1%, firmly in outperform territory, and the JSON slope tag reads rising. The two horizons tell different stories, and both are true. Against a month ago the reading was +4.4%, so the monthly change is +13.7 points — acceleration in the proper sense of the word, since the reading is positive and moving further from zero. Against a week ago it was +23.3%, so the weekly change is −5.1 points: still positive territory, but decelerating. In plain terms, South32 has outrun the index substantially over the month while giving a little of that lead back in the last five sessions.
The two-year panel supplies the context that matters most. Relative strength was negative for most of 2025 — the stock was a straightforward index laggard through that period — crossed zero around October 2025 and has held above it ever since, reaching its highest readings of the two years in early 2026. A stock trading above zero on this measure is one that capital has been rotating toward, which is exactly the condition that gives a pullback a reasonable chance of being bought. The counterweight is that a +18.1% reading is already a large lead; leads of that size are more often consolidated than extended, and the week-over-week slippage is the first evidence of that process.
⑥ ATR & ADX

S32_atr_adx-90d-2026-08-16.svgATR(14) is $0.158, or 3.3% of price. That figure sizes the structural reference levels on this page: 1×ATR below the close sits at $4.60 and the 2×ATR technical invalidation level at $4.44. It is worth stating what that arithmetic implies — a 2×ATR excursion is a 6.6% move, which for this stock is two ordinary sessions. A level that far below the close is therefore a structural reference, not a tight one, and the $4.44 line lands in the same pocket as the SMA60 ($4.42) and the 61.8% retracement ($4.37), so the volatility-derived line and the structural lines agree.
ADX(14) at 30.6 on the two-year frame and 31.0 on the 90-day frame is above the 25 threshold that marks an established trend. The standard caution applies: ADX measures the strength of a directional move, not its direction — a high reading during a decline signals a strong decline. Here the direction is unambiguous from the moving-average stack, so a reading above 30 supports the uptrend reading. The ATR line itself has been elevated since the July 1 volume event and has ticked up again in the last few sessions, which is consistent with a wider daily range during the give-back and is a reason to treat single-session breaks of any level on this page with scepticism.
⑦ OBV

S32_obv-90d-2026-08-16.svgBoth timeframes agree, which is not always the case. On the two-year window OBV sits at 324,521,729 against a 20-day average of 312,644,195 — above the average, rising, with a +3.8% divergence reading and an accumulation state. On the 90-day window the state is the same: above its MA20, rising, with a wider +12.2% divergence.
The 90-day OBV level is negative in absolute terms (−85,518,871 against a −97,396,405 average), and that is worth explaining rather than glossing over, because it looks alarming at first glance. OBV is a cumulative series that starts at zero at the beginning of whatever window is drawn, so a negative 90-day value simply says that more volume traded on down-days than up-days across the window as a whole — most of it during the June and July decline. What matters for the current structure is the direction and the position relative to the average, and on both counts the line is improving: it has been climbing since late July and crossed back above its MA20 during the August advance. Flow is confirming price here rather than lagging it, which is the opposite of the bearish non-confirmation pattern.
Bull Case
- Rising, correctly stacked moving averages: SMA5 $4.98 > SMA20 $4.68 > SMA60 $4.42, close above the 20- and 60-day lines.
- Mansfield RS +18.1% vs the S&P/ASX 200, up 13.7 points from +4.4% a month ago — a clear index outperformer.
- ADX 30.6 (31.0 on the 90-day frame) confirms an established trend rather than a range.
- OBV in accumulation on both timeframes — above MA20, rising, with +3.8% and +12.2% divergence readings.
- Price above both anchored VWAPs ($3.55 two-year, $4.39 ninety-day), so every anchored cohort is on the right side of its average.
- The give-back has only reached the 23.6%–38.2% retracement band of the $3.90–$5.14 swing, with the SMA20 and Bollinger mid both at $4.68 beneath it.
Bear Case
- Friday's decline came on 1.32× the 20-day average volume — supply, not a quiet fade.
- Mansfield RS has slipped 5.1 points from +23.3% a week ago; the relative lead is being consolidated.
- Close is beneath the SMA5 at $4.98 after three sessions of give-back from the $5.14 August 11 high.
- MACD histogram (+0.0124) has been narrowing, with both lines already well above zero — a late-cycle configuration.
- Bollinger width at 22.4% is stretched after a vertical advance; wide bands frequently precede a broader consolidation.
- Below $4.68 there is little structure until $4.52 (50%) and the $4.42/$4.37 SMA60 and 61.8% pocket, with an unfilled $4.08–$4.17 gap beneath that.
Scenarios
| Scenario | Probability | Path | Trigger / Invalidation |
|---|---|---|---|
| Shallow pullback, trend resumes | ~40% | The $4.68 shelf — SMA20, Bollinger mid and the 38.2% retracement at $4.67 — absorbs the give-back, the RSI reset completes near 50, and price works back toward $4.85 and then the $5.14–$5.19 highs. | Trigger: a daily close back above $4.85 (23.6% retracement) on above-average volume. Invalidated by a daily close below $4.67. |
| Deeper retracement into the 50–61.8% band | ~40% | The $4.68 shelf gives way and price works down through the 50% retracement at $4.52 toward the confluence of the SMA60 ($4.42) and the 61.8% retracement ($4.37), where the trend structure of the July–August advance is properly tested. | Trigger: a daily close below $4.67 with volume above the 20-day average. Invalidated by a reclaim of $4.85. |
| Trend structure breaks | ~20% | The $4.44 volatility line and the $4.42 SMA60 both fail, the moving-average stack unwinds, and price retraces toward the 78.6% level at $4.17 and the unfilled $4.08–$4.17 gap of July 21. | Trigger: a daily close below the 2×ATR technical invalidation level at $4.44 — that ends the swing structure described above. |
Key Levels & Volatility References
| Level | Role | Basis |
|---|---|---|
| $5.19 | Resistance | 52-week high, set in the week just ended; the upper Bollinger Band sits fractionally above at $5.21 |
| $5.14 | Resistance | Closing swing high of Aug 11, 2026 — the 0% anchor of the current up-swing |
| $4.98 | Resistance | SMA5 — the first line lost during the give-back |
| $4.85 | Resistance | 23.6% retracement of the $3.90–$5.14 up-swing; a pullback support in the retracement grid that price has already slipped beneath, so it is overhead now |
| $4.76 | Current close | Aug 14, 2026 close; between the 23.6% and 38.2% retracements |
| $4.68 | Support | SMA20 and Bollinger mid, with the 38.2% retracement at $4.67 immediately beneath — the first shelf |
| $4.44 | Invalidation | 2×ATR technical invalidation level below the close (6.6%), in the same pocket as the SMA60 ($4.42) and the 61.8% retracement ($4.37) |
What to Watch
- The $4.68 shelf where the SMA20, the Bollinger mid-line and the 38.2% retracement ($4.67) converge — the pullback stays shallow above it and becomes a proper retracement beneath it.
- Volume on down-days: Friday's 1.32× reading is one session. A repeat of above-average turnover on further weakness would change the character of this give-back; a fade to below-average volume would mark it as ordinary.
- Mansfield RS versus the S&P/ASX 200 — whether the reading stabilises above the +4.4% level of a month ago, or keeps slipping from +23.3% toward zero.
- The MACD histogram: continued narrowing into a negative reading, particularly with price beneath $4.68, would confirm the momentum deceleration the panel is currently only hinting at.
- Whether ADX stays above 25 through the pullback. A trend that keeps its ADX reading during a give-back is consolidating; one that drops toward 20 is losing its directional character.