Pantoro Gold
This analysis is based on closing-price data as of November 13, 2026. Whether you're researching Pantoro Gold (PNR) on the ASX or learning how to read stock charts, here are objective support, resistance and technical invalidation levels built from the RSI, MACD and ATR indicators.
On the two-year chart Pantoro Gold is still recovering from a long decline: a sharp break in March 2026 (an unfilled gap from 10 March sits at $4.52–$4.80) gave way to a slide into the July–August lows, and the stock has been rebuilding since, now trading 46.5% below its 52-week high of $5.98. The current short-term structure — SMA5 above SMA20 above SMA60, price above both longer averages and a fresh MACD golden cross — was most recently re-established on 5 November 2026, a day when the whole ASX gold sector rallied (PNR closed +18.5% that session alongside double-digit gains across gold peers). No company-specific catalyst was identified, so this is best read as a sector-driven structure in a stock that is still lagging the S&P/ASX 200 (Mansfield RS −12.7%, though improving). The question for the coming sessions is whether price can consolidate above the 5 November gap rather than give it back.
Snapshot as of Nov 13, 2026 close
| Item | Value | Note |
|---|---|---|
| Close | $3.20 | Slightly below SMA5 after a −4.2% session on 12 Nov |
| 52-week high / low | $5.98 / $1.72 | −46.5% from high · +86.6% from low |
| SMA5 / SMA20 / SMA60 | $3.25 / $2.96 / $2.86 | Bullish order 5 > 20 > 60 (re-established 5 Nov) |
| Bollinger (20) | $3.41 / $2.96 / $2.51 | Upper / mid / lower · width 30.22% |
| aVWAP (90d) | $2.84 | Anchored 31 Aug 2026 — price above |
| aVWAP (2y) | $2.83 | Anchored 10 Mar 2026 — price above |
| RSI (14) | 57.5 | Neutral-positive; no RSI divergence flagged |
| Mansfield RS vs the S&P/ASX 200 | −12.7% | Underperforming but rising (+4.20 pts week · +7.93 pts month) |
| MACD (12,26,9) | 0.105 / 0.071 | Golden cross 5 Nov · histogram +0.035 |
| ADX (14) | 18.4 (2y) / 19.0 (90d) | Ranging — no established trend strength |
| ATR (14) | $0.178 (5.55%) | Wide daily range for the price level |
| OBV | 2y: early accumulation · 90d: early accumulation | Above MA20, flat; bearish OBV divergence flagged (both) |
| Volume vs 20-day average | 1.00x | 2,881,166 vs MA20 2,869,086 |
| 1× / 2×ATR technical invalidation | $3.02 / $2.85 | −5.6% / −11.1% from close |
① Price & Moving Averages
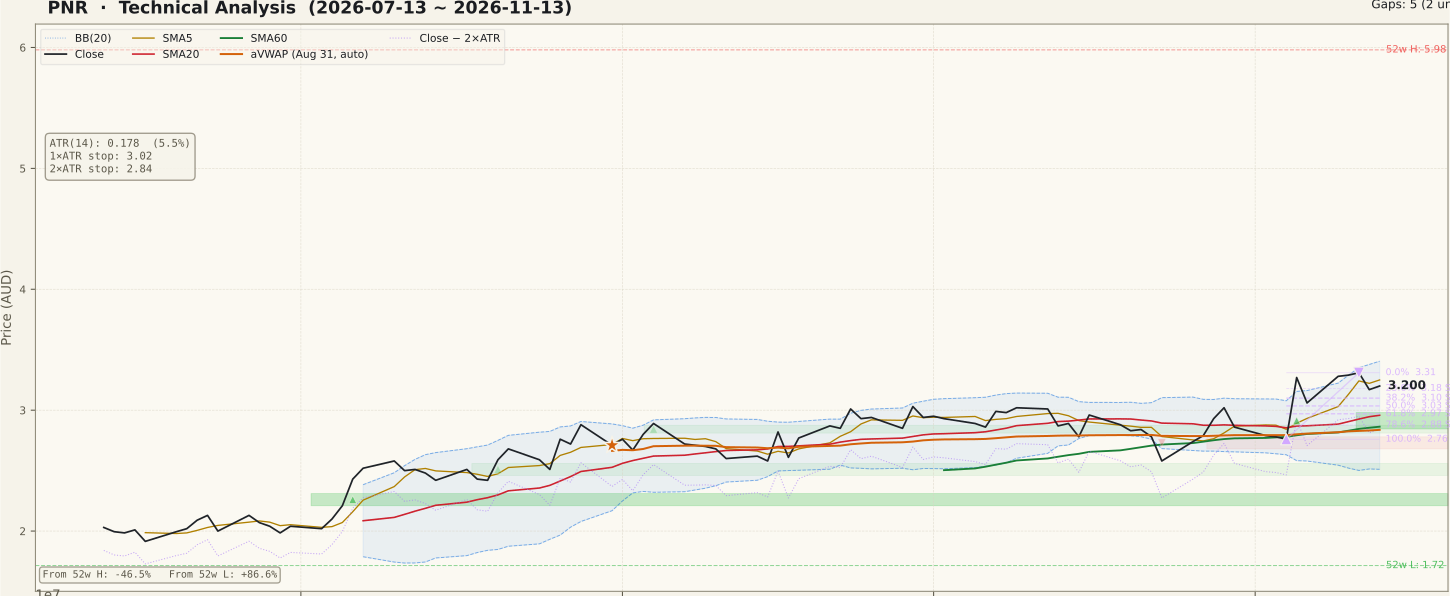
The averages are stacked bullishly (SMA5 $3.25 > SMA20 $2.96 > SMA60 $2.86), but this ordering has come and gone several times over the past year — the current instance dates from the 5 November gold-sector rally, which lifted PNR from $2.76 to $3.27 in one session and left an unfilled gap at $2.85–$2.98. Since then price has oscillated: −6.4% on 6 Nov, +7.2% on 9 Nov (again a sector-wide move), a swing high of $3.31 on 11 Nov and −4.2% on 12 Nov. The close of $3.20 now sits just under SMA5 — a shallow pullback inside the new structure rather than a break of it. Both anchored VWAPs ($2.84 for the 90-day anchor of 31 Aug, $2.83 for the two-year anchor of 10 Mar) sit below price, meaning holders from those anchors are on average above water. The upper Bollinger Band ($3.41) and the 2-year Fibonacci 0% anchor ($3.41) together form the next overhead reference.
② Volume

The latest session traded 2,881,166 shares against a 20-day average of 2,869,086 — a ratio of 1.00x, so participation is simply average. On the 90-day chart the 5 November rally bar is not marked as a volume spike (the panel flags sessions at 2× average or more), which fits a move that came from sector-wide rotation into gold rather than a stock-specific event drawing outsized volume. The broader ASX tape was also unremarkable over this period. The takeaway is that the structure has not yet been confirmed by expanding volume; a push through $3.31 on clearly above-average volume would carry more weight than one on ordinary turnover.
③ MACD

MACD (0.105) is above its signal line (0.071) following a golden cross on 5 November — again the sector-rally session. The cross came from just above the zero line after a late-October dip, so it is a resumption signal rather than an early, deeply-negative turn. The histogram (+0.035) has been positive since the cross, though the chart shows its bars shrinking over the last couple of sessions as price eased from $3.31. That fading is typical of a pause; a renewed dead cross would indicate the November impulse has run out.
④ RSI

RSI(14) reads 57.5 — above the 50 midline but well short of overbought. The 5 November jump briefly lifted it into the mid-60s on the chart before it settled back, so momentum is positive without being stretched. No RSI divergence is flagged in the data. In a stock whose ADX is below 20, RSI holding above 50 on pullbacks is the more useful tell than any single reading.
⑤ Mansfield Relative Strength

Against the S&P/ASX 200, Mansfield RS is −12.7% — still in negative territory, meaning PNR continues to underperform the index on this measure. The direction, however, is clearly improving: a week ago the reading was −16.9 and a month ago −20.6, so it has risen 4.20 points over the week and 7.93 points over the month (the "negative-improving" quadrant on both horizons). On the 90-day chart the line has climbed steadily from deep negative levels in July. This is the main caution in the setup: a sector-driven rally has narrowed the gap to the market, but relative strength has not yet crossed zero.
⑥ ATR & ADX

ATR(14) is $0.178, or 5.55% of price, and the chart shows it stepping up after the 5 November session — daily swings of this size are normal for PNR at present. That places the 1×ATR reference at $3.02 and the 2×ATR technical invalidation level at $2.85 (−11.1%), which sits right at the bottom of the 5 November gap. ADX is 18.4 on the two-year series and 19.0 on the 90-day — below 20, i.e. a ranging regime with no established trend strength. A rising ADX through 20–25 would be needed to describe the November move as a trend rather than a range shift.
⑦ OBV

OBV is tagged "early accumulation" on both timeframes: it sits above its 20-day average (2y gap to MA20 11.65%, 90d 45.47% — a measure of distance from the average, not a divergence) but the slope is flat. More important is the bearish OBV divergence flagged on both series: price made a higher swing high on 11 November ($3.31) than on 29 September ($3.03), while OBV at the later high was lower than at the earlier one. In other words, the November price high was not matched by cumulative volume. Divergence is a possibility of exhaustion, not a confirmed top — but together with negative RS it argues against reading the November move as broad-based demand for this particular stock.
Bull vs Bear
Bull Case
- SMA5 > SMA20 > SMA60 with price above SMA20 and SMA60.
- MACD golden cross on 5 Nov from near zero; histogram still positive.
- Mansfield RS rising: +4.20 pts in a week, +7.93 pts in a month.
- Price above both anchored VWAPs ($2.84 · $2.83).
- RSI 57.5 — positive momentum with room before overbought.
- Unfilled 5 Nov gap ($2.85–$2.98) offers a nearby structural floor.
Bear Case
- Structure was formed by a sector-wide gold rally, not a company catalyst.
- Mansfield RS still negative (−12.7%) versus the S&P/ASX 200.
- Bearish OBV divergence flagged on both 2y and 90d series.
- ADX below 20 — no established trend strength.
- Volume only average (1.00x); no volume confirmation of the move.
- Two-year context still a recovery from a deep decline (−46.5% from the 52-week high).
Scenarios
| Scenario | Probability | Path | Trigger / Invalidation |
|---|---|---|---|
| Consolidation above the gap | 45% | Price ranges roughly $2.98–$3.31 while SMA20 catches up; RS keeps grinding higher. | Trigger: closes holding above $3.10 (38.2% retracement). Invalidation: close back inside the 5 Nov gap below $2.98. |
| Extension higher | 30% | Close above the $3.31 swing high, then a test of the $3.41 Bollinger upper band / 2-year Fibonacci anchor. | Trigger: close above $3.31 on above-average volume, with RS moving toward zero. Invalidation: rejection back below $3.18. |
| Gap fill / failure | 25% | Gold-sector momentum fades; price retraces into the $2.85–$2.98 gap and the SMA20/SMA60 cluster. | Trigger: close below $3.02 (1×ATR). Invalidation of the structure: close below $2.85 (2×ATR). |
Key Levels & Volatility References
| Price | Role | Basis |
|---|---|---|
| $3.41 | Resistance | Bollinger upper band ($3.41) · 2-year Fibonacci 0% anchor (swing low of 16 Mar 2026) |
| $3.31 | Resistance | 90-day swing high, 11 Nov 2026 (Fibonacci 0%) |
| $3.20 | Current | Close, 13 Nov 2026 |
| $3.18 | Support | 23.6% retracement of the 4–11 Nov upswing |
| $3.02 | Support / 1×ATR | 1×ATR reference · near the 50% retracement ($3.03) |
| $2.96 | Support | SMA20 · Bollinger mid · 61.8% retracement ($2.97) · inside the 5 Nov gap |
| $2.85 | Invalidation | 2×ATR technical invalidation level · bottom of the 5 Nov gap ($2.85–$2.98) · near SMA60 ($2.86) |
What to Watch
- Whether the 5 November gap ($2.85–$2.98) stays unfilled — a close back inside it would undo most of the sector-rally structure.
- A close above $3.31 on clearly above-average volume, which would begin to address the bearish OBV divergence.
- Mansfield RS versus the S&P/ASX 200 crossing zero — the step that would separate PNR from a purely sector-driven move.
- Gold-sector peers: because the structure formed on a sector-wide day, a reversal across the group is the most likely source of weakness.
- ADX rising through 20–25 to confirm trend strength.