Pantoro Gold
$2.93 −55.67% from the 52-week high of $6.61 · +70.85% from the 52-week low of $1.72
This analysis is based on closing-price data as of October 2, 2026. Whether you're researching Pantoro Gold (PNR) on the ASX or learning how to read stock charts, here are objective support, resistance and technical invalidation levels built from the RSI, MACD and ATR indicators.
The two-year panel is a full cycle: a climb from around $1.50 at the start of 2025 to a peak above $6.50 in October 2025, a broad $4.50–$5.90 range through the summer, a sharp break in March 2026 that left an unfilled gap between $4.52 and $4.80, and a slide into a July low near $1.90. Since then the price has recovered to $2.93, and the moving averages have re-formed in rising order — SMA5 above SMA20 above SMA60 since September 21 — while the close drifts sideways just under the late-September highs. The lens for this week is a shallow pause inside a young recovery: the trend structure is constructive, but both RSI and OBV report a bearish divergence, and relative strength against the S&P/ASX 200 is still well below zero.
Snapshot as of October 2, 2026 close
| Metric | Value | Reading |
|---|---|---|
| Close | $2.93 | 3.30% below the September 29 close of $3.03; the last five sessions netted a small decline after a +6.32% day on September 29 |
| 52-week high / low | $6.61 / $1.72 | 55.67% under the high (October 2025 peak); 70.85% above the low |
| SMA5 / SMA20 / SMA60 | $2.94 / $2.81 / $2.50 | Rising order since September 21; close a hair under SMA5 (−0.34%), above SMA20 (+4.44%) and SMA60 (+17.02%) |
| Bollinger upper / mid / lower | $3.10 / $2.81 / $2.52 | Close in the upper half of the band; width 20.66% |
| aVWAP (2y, anchor Mar 10, 2026) | $2.82 | Close 3.98% above — back above the average price paid since the March break |
| aVWAP (90d, anchor Jul 9, 2026) | $2.48 | Close 17.93% above |
| RSI(14) | 56.34 (90d) / 56.31 (2y) | Mid-range; bearish divergence reported on both frames |
| Mansfield RS vs the S&P/ASX 200 | −22.89% | Underperform, slope rising; improving from −23.71 a week ago and −30.69 a month ago |
| MACD / signal / histogram | 0.0969 / 0.0943 / +0.0026 | Golden cross dated September 22, 2026, above zero; histogram thin |
| ADX(14) | 25.57 (90d) / 25.23 (2y) | Just over the 25 line — a trend of moderate strength |
| ATR(14) | $0.1629 (5.56%) | About 16 cents of average daily range — wide for a $2.93 stock |
| OBV state | 90d accumulation, rising · 2y accumulation, rising | Above MA20 on both frames (+14.92% / +18.02%), but a bearish OBV divergence is reported on both |
| Volume vs 20-day average | 1,493,972 vs 3,473,367 (0.43×) | Light; roughly 0.67× after allowing for a quiet market (approximate) |
| Fibonacci swing (90d) | $2.58 (Sep 15) → $3.01 (Sep 23) | Up-swing; retracement levels below the price act as support |
| 1× / 2× ATR technical invalidation | $2.77 / $2.60 | Exact values $2.767 and $2.604; 2× sits 11.13% below the last close |
① Price & Moving Averages
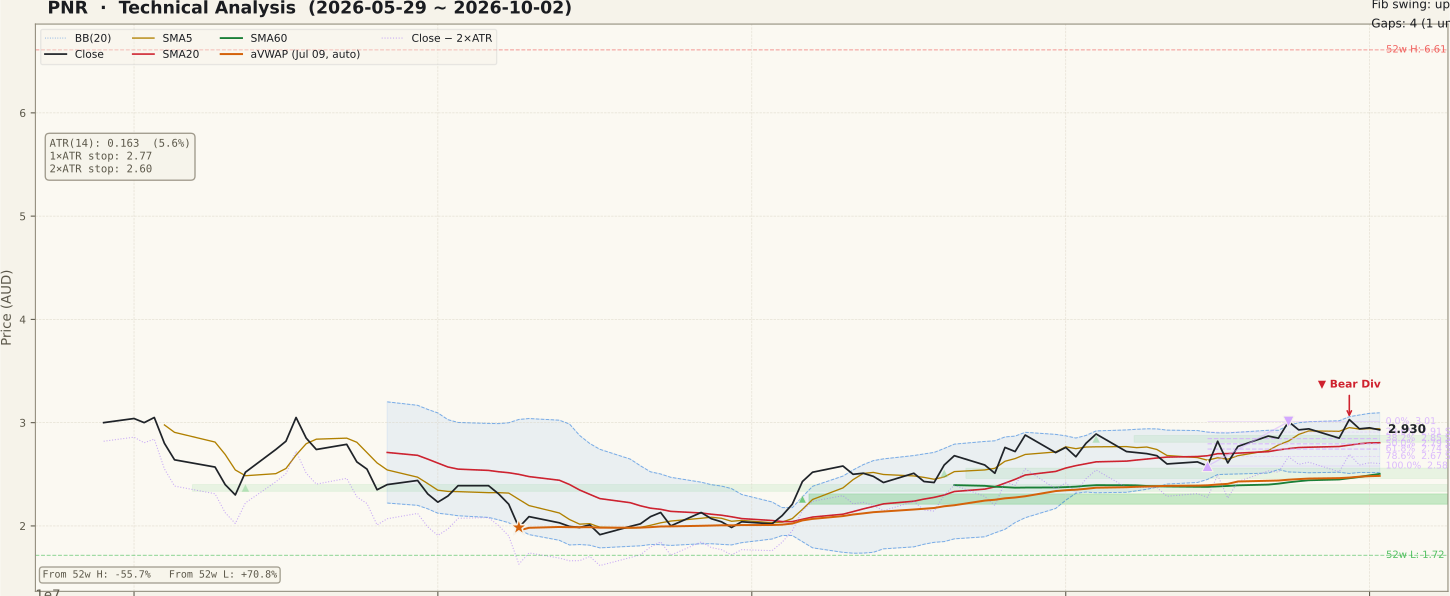
PNR_price-90d-2026-10-04.svgThe averages are stacked in rising order — SMA5 $2.94 above SMA20 $2.81 above SMA60 $2.50 — and the conditions arrived one at a time rather than on a single day: the close held above SMA60 from mid-August, SMA20 crossed above SMA60 in late August, the close regained SMA20 on September 18, and SMA5 moved above SMA20 on September 21 to complete the arrangement. A structure assembled over six weeks is more informative than one created by a single session.
The close of $2.93 sits one cent under SMA5, 4.44% above SMA20 and 17.02% above SMA60. The last week has been a sideways shuffle between roughly $2.85 and $3.03 rather than a decline, which is why this reads as a pause: the price has not yet tested the SMA20 shelf, which coincides with the Bollinger middle band at $2.81 and the 50% retracement of the September swing at $2.80.
That swing runs from the September 15 low of $2.58 to the September 23 high of $3.01, a 16.67% advance. The 23.6% retracement at $2.91 lies just under the close and the 38.2% level at $2.85 below it. On the two-year frame, the March 2026 down-swing from $5.89 to $3.41 still frames everything overhead: the price has fallen through even the low end of that swing, so its retracement levels from $3.41 upward, and the unfilled March 10 gap at $4.52–$4.80, sit well above the current chart.
② Volume

PNR_volume-90d-2026-10-04.svgThe basis-date session traded 1,493,972 shares against a 20-day average of 3,473,367, a ratio of 0.43×. The market was quiet as well: the median volume ratio across the screening universe was 0.64× that day and between 0.64× and 0.94× through the week. Allowing for that, PNR's reading is roughly 0.67× — still light, but less extreme than the raw figure suggests (the adjustment is approximate because the two ratios use slightly different averaging windows).
The tallest bar on the right of the panel is September 18, the S&P/ASX September quarterly rebalance trading day, when turnover was lifted across the whole market (universe median 2.23×). PNR rose 6.13% that session on about 3.2× its prior 20-day average volume, which works out to roughly 1.4× after the market-wide lift — elevated, but not an outlier once the day is put in context.
That session is inside the current 20-day window, so it inflates the average against which every later bar is measured. The light ratios of the past week partly reflect that heavy denominator; the cleaner comparison comes after September 18 drops out of the window in mid-October. Within the last five sessions, the +6.32% move on September 29 came on below-average volume and coincided with a rise across ASX gold producers (Ramelius Resources gained 3.5% that day).
③ MACD

PNR_macd-90d-2026-10-04.svgMACD reads 0.0969 against a signal line of 0.0943, a histogram of +0.0026, and the last recorded crossover is a golden cross dated September 22, 2026. The two-year frame agrees closely (0.0966 / 0.0939 / +0.0027). Both lines are above zero, where the MACD line has been since August 10.
The panel shows the context of that cross. The lines climbed steeply from deep negative territory in July to a peak in early September, the MACD line slipped briefly beneath the signal line as the price dipped mid-month, and then crossed back up on September 22. Since then the histogram has stayed positive but very thin, and both lines are running roughly flat below their early-September peak.
Read together, that is momentum that has recovered and is holding, not momentum that is accelerating. A histogram this close to zero can flip on one or two sessions, so the cross is a weak signal on its own; what matters is whether the lines turn up again or roll over toward zero.
④ RSI

PNR_rsi-90d-2026-10-04.svgRSI(14) reads 56.34 on the 90-day frame and 56.31 on the two-year frame, in the neutral-to-firm middle of the range. The JSON reports a bearish divergence on both frames with two peaks: on August 28 the close was $2.88 with RSI at 66.84 (66.58 on the two-year frame), and on September 29 the close was $3.03 with RSI at 62.53 (62.47). A higher price high on a lower oscillator high is the classic shape of a fading advance.
A divergence is a possibility, not a confirmed top. The price has eased 3.30% from that second peak, but the averages remain in rising order and the close is above SMA20. Confirmation would look like a close back beneath the SMA20 shelf; a new closing high above $3.03 accompanied by RSI above 62.53 would weaken the divergence reading.
RSI has not reached the 70 overbought line during this recovery — the August and September peaks both stopped in the 60s — and it has stayed at or above 50 since mid-August. That is a steady rather than stretched profile.
⑤ Mansfield Relative Strength

PNR_rs-90d-2026-10-04.svgMansfield RS versus the S&P/ASX 200 reads −22.89% and the state is underperform. The prior figures are absolute readings: a week ago RS stood at −23.71, a weekly change of +0.82; a month ago it stood at −30.69, a monthly change of +7.80. Both changes are positive while the reading is below zero, so the line is improving toward zero on both horizons — the slope tag "rising" agrees.
The two-year panel puts the number in context. RS was above zero for most of 2025 and peaked above +100 around the October 2025 high, then fell below zero at the March 2026 break and reached roughly −55 in August. The recovery since has cut that deficit by more than half, but the stock is still lagging the index over the Mansfield window.
This is the most important caution on the page. A rising-order average stack inside negative relative strength is a recovery that has not yet become leadership; a common misreading is to treat an improving negative RS as if it were outperformance.
⑥ ATR & ADX

PNR_atr_adx-90d-2026-10-04.svgATR(14) is $0.1629, or 5.56% of the last close (two-year frame $0.1630, 5.563%). That sets the scale for every level here: the SMA20 shelf is less than one ATR below the close, and the 2× ATR technical invalidation level at $2.60 is 11.13% away. ATR has stayed in a similar band since August, well below the extremes of late 2025 and March 2026 on the two-year panel.
ADX(14) reads 25.57 on the 90-day frame and 25.23 on the two-year frame, just over the 25 threshold after a long decline through the middle of the year. ADX measures strength rather than direction; a reading crossing up through 25 alongside rising averages says the recovery has started to carry some directional persistence, though only marginally.
⑦ OBV

PNR_obv-90d-2026-10-04.svgBoth frames carry the same tag. On the 90-day frame OBV is −30,898,228 against an MA20 of −36,317,856, tagged accumulation, above its average with a rising slope (+14.92% from the average). On the two-year frame OBV is −24,652,812 against an MA20 of −30,072,440, also accumulation and rising (+18.02%). That percentage measures how far cumulative flow sits from its own average; it is not a divergence.
The divergence field is separate, and it reads bearish on both frames. On the 90-day frame OBV stood at −7,324,526 at the August 28 price peak of $2.88 and at −27,991,967 at the September 29 peak of $3.03 (two-year frame −1,079,110 and −21,746,551). The price made a higher high while cumulative volume made a much lower one — the heavy down-volume of early-to-mid September has not been recovered.
So the short-term tag and the divergence point in different directions, and both should be stated: OBV has turned up off its September trough and sits above its average, but the volume behind the late-September price high is weaker than the volume behind the August one. RSI and OBV agree on the divergence, which gives it more weight than either alone.
Bull Case vs Bear Case
Bull Case
- SMA5 > SMA20 > SMA60 in rising order since September 21, assembled step by step from mid-August; close above SMA20 (+4.44%) and SMA60 (+17.02%).
- MACD golden cross on September 22 with both lines above zero (MACD positive since August 10).
- Mansfield RS improving on both horizons — up 0.82 on the week and 7.80 on the month, deficit more than halved from the August trough.
- The past week's drift came on light volume (0.43×, about 0.67× market-adjusted) — no sign of heavy distribution.
- Close above both anchored VWAPs: 3.98% over the two-year anchor ($2.82) and 17.93% over the 90-day anchor ($2.48).
- ADX has crossed back above 25 (25.57), and OBV sits above its MA20 on both frames with a rising slope.
Bear Case
- Bearish RSI divergence on both frames: August 28 $2.88 / 66.84 versus September 29 $3.03 / 62.53.
- Bearish OBV divergence on both frames: the September 29 high came with OBV of −27,991,967 against −7,324,526 at the August 28 high.
- Mansfield RS still −22.89% versus the S&P/ASX 200 — underperforming the index despite the improvement.
- MACD histogram only +0.0026; the September 22 cross could be undone in a session or two.
- The stock remains 55.67% below its 52-week high, with an unfilled gap at $4.52–$4.80 and the March down-swing retracements overhead.
- ATR of 5.56% makes the levels loose; the 2× ATR invalidation level is 11.13% away, and gold producers can move with the metal price regardless of the chart.
Scenarios
| Scenario | Probability | Path | Trigger / Invalidation |
|---|---|---|---|
| Sideways pause above the SMA20 shelf | 40% | The price keeps oscillating between the $2.81 SMA20 and middle-band shelf and the $3.01–$3.03 September highs while SMA20 catches up from below. The averages stay in rising order and the divergences remain unresolved. | Trigger: closes holding above $2.81 with SMA20 still rising. Invalidated by a close beneath $2.77 (1× ATR). |
| The divergences play out | 35% | The RSI and OBV divergences lead: the close loses the $2.81 shelf and the 50% retracement at $2.80, the MACD lines roll toward zero, and the price moves toward the 1× ATR level at $2.77 and then the September 15 swing low area at $2.58, near the lower Bollinger rail at $2.52. | Trigger: a daily close beneath $2.81. Technical invalidation of the structure at the 2× ATR level of $2.60. |
| Break above the September highs | 25% | The close clears the $3.03 September 29 peak and the $3.10 upper Bollinger rail. For this path to be well supported, RSI would need to exceed 62.53 and OBV to recover its earlier levels, removing the divergences, with relative strength continuing toward zero. | Trigger: a daily close above $3.03 on at least average volume. Invalidated by a close back beneath $2.91. |
Key Levels & Volatility References
| Level | Role | Basis |
|---|---|---|
| $3.10 | Resistance | Upper Bollinger rail ($3.0953), 5.64% above the close; band width 20.66% |
| $3.01 | Resistance | 0% anchor of the September swing (September 23 high), 2.73% above the close; the September 29 close of $3.03 sits just above it |
| $2.94 | Resistance | SMA5 ($2.940), 0.34% above the close — the nearest overhead average |
| $2.93 | Current | Last close, October 2, 2026 |
| $2.91 | Support | 23.6% retracement of the September swing ($2.9085), 0.73% below the close; the 38.2% level at $2.85 lies beneath |
| $2.81 | Support | SMA20 and the Bollinger middle band ($2.8055), 4.25% below the close; the 50% retracement at $2.80 coincides and the 1× ATR technical invalidation level at $2.77 lies just beneath |
| $2.60 | Invalidation | 2× ATR technical invalidation level ($2.604), 11.13% below the close; the September 15 swing low at $2.58 and the lower Bollinger rail at $2.52 sit just beneath |
What to Watch
- Whether the pause holds above the $2.81 SMA20 and middle-band shelf, where the 50% retracement of the September swing also sits. A close under that shelf would be the first sign the divergences are taking effect.
- Whether a new high above $3.03 comes with RSI above 62.53 and a recovering OBV. A higher price on weaker oscillators again would extend the divergence rather than resolve it.
- Mansfield RS versus the S&P/ASX 200. The line has improved from about −55 to −22.89; continued gains toward zero would turn a recovery into relative leadership, while a stall would leave it a lagging rebound.
- Volume once September 18 leaves the 20-day window in mid-October. Until then the average is inflated and ratios understate participation.
- The sector backdrop. The September 29 move coincided with a broad rise in ASX gold producers; the gold price and company reports can move the stock independently of these panels.