Cochlear
This analysis is based on closing-price data as of November 13, 2026. Whether you're researching Cochlear (COH) on the ASX or learning how to read stock charts, here are objective support, resistance and technical invalidation levels built from the RSI, MACD and ATR indicators.
Cochlear closed at $151.37 on November 13, 46.9% below its $284.88 52-week high and 70.6% above its $88.74 52-week low. The two-year chart is dominated by a steep decline — a −18.9% gap on Feb 13, 2026 and a −40.7% session on Apr 22, 2026 — followed by a slow recovery from the late-April low. Short-term structure has improved: Close > SMA20 > SMA60, SMA5 > SMA20 > SMA60 since Nov 4, MACD above its signal since Oct 20 and ADX at 34.6. The counterweights are a Mansfield RS still below zero at −12.1% versus the S&P/ASX 200, a bearish OBV divergence between Sep 28 and Nov 6, and a +8.65% jump on Nov 5 for which no company-specific catalyst was identified.
Snapshot as of November 13, 2026
| Item | Value | Reading |
|---|---|---|
| Close | $151.37 | −46.9% from 52w high · +70.6% from 52w low; 2.6% below the $155.47 Nov 6 close, the swing high of the current leg |
| 52-week range | $88.74 – $284.88 | Lower half of the range after the February–April 2026 decline |
| SMA 5 / 20 / 60 | $151.89 / $145.14 / $138.87 | SMA5 > SMA20 > SMA60 since Nov 4; the close sits just under SMA5 but above SMA20 and SMA60 |
| Bollinger (20) | $157.83 / $145.14 / $132.44 | Band width 17.49%; close in the upper half, below the upper band |
| aVWAP (2y anchor Apr 22, 2026) | $119.68 | Price 26.5% above the average anchored to the −40.7% session |
| aVWAP (90d anchor Aug 31, 2026) | $137.01 | Price above the average anchored to the Aug 31 heavy-volume session |
| RSI(14) | 61.7 | Above 50, eased from about 70 after Nov 5–6; no RSI divergence flagged |
| Mansfield RS (vs the S&P/ASX 200) | −12.1% | Underperform, slope rising; −1.56 points on the week, +14.28 on the month |
| MACD (12,26,9) | 4.4637 / 3.7539 / +0.7098 | Above signal since the Oct 20 golden cross, above zero (two-year frame 4.4682 / 3.7605 / +0.7077) |
| ADX(14) | 34.6 | Strong-trend reading (34.3 on the two-year frame) |
| ATR(14) | $4.57 (3.0%) | 2×ATR spans about 6.0% of the share price |
| OBV (2y / 90d) | early accumulation / accumulation | Above MA20 on both frames (flat on 2y, rising on 90d); bearish OBV divergence flagged (Sep 28 → Nov 6) |
| Volume vs 20d avg | 0.403× | 172,596 shares against a 428,351 average — a light final session |
| 1×ATR / 2×ATR technical invalidation | $146.80 / $142.24 | Volatility-based structural reference levels below the close (two-year frame $146.80 / $142.23) |
① Price & Moving Averages
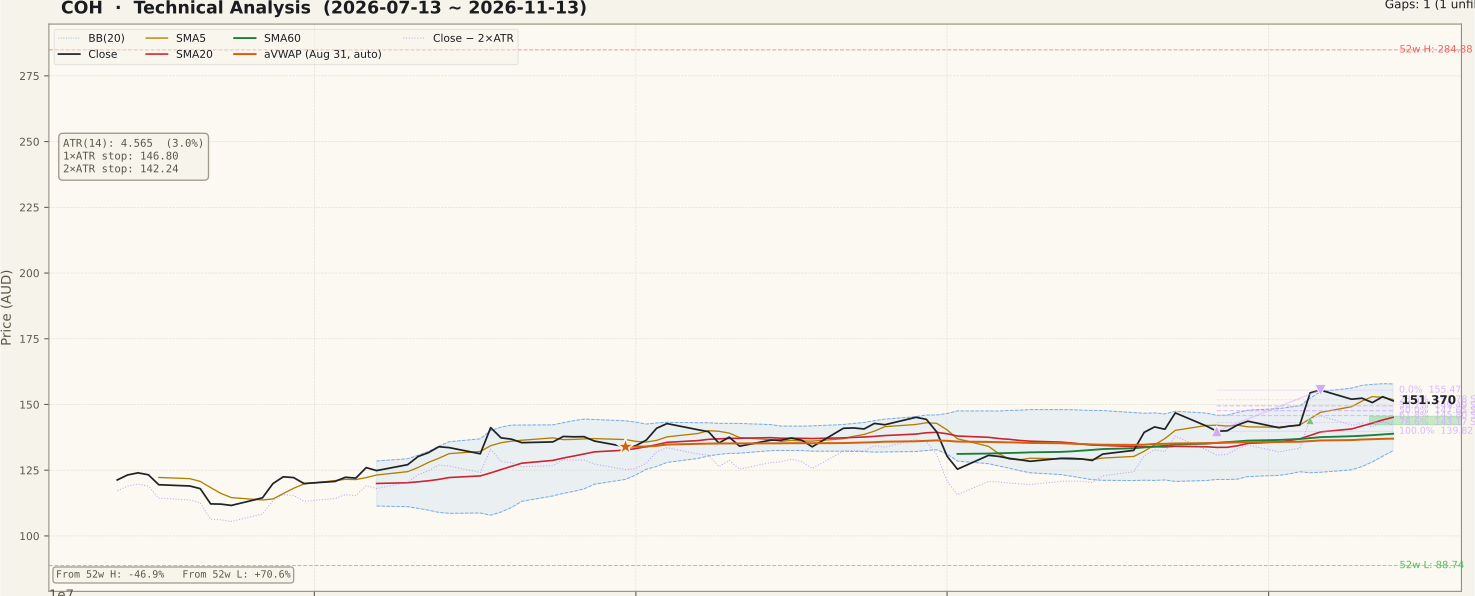
COH_price-90d-2026-11-15.svgThe two-year frame opens near $300 in late 2024 and spends most of 2025 in a wide range between roughly $250 and $320. In 2026 the structure broke: Feb 13 gapped down −18.9% (an unfilled gap from $221.67 to $242.93 remains overhead), and Apr 22 fell −40.7% in a single session, from $167.94 to $99.58, on the heaviest volume of that period. That bar anchors the two-year aVWAP ($119.68) and left a second unfilled gap from $114.95 to $166.51 — price is now trading inside that gap, roughly two-thirds of the way up. The 52-week low of $88.74 came in late April. A class action has been reported against the company; it is mentioned here as background only and is not part of the chart reading.
From the late-April low price has recovered in steps: above $120 by June, around $134 at the end of August and $139.59 at the end of September. A sharp setback followed (Oct 1 −6.63%, Oct 2 −3.80%) to a $125.39 close. Oct 20 then rose +5.17% on about 1.3× average volume, and on that day the close moved back above both SMA20 and SMA60. The SMA5 > SMA20 > SMA60 ordering — this bucket's defining condition — formed on Nov 4 on a +0.26% session with light volume, one session before the Nov 5 jump; it is the fourth time this ordering has formed in the past year (after Jul 3, Aug 3 and Sep 22).
On Nov 5 the shares rose +8.65% to $154.44, gapping above the prior day's high on roughly average volume. Healthcare peers rose about +2.6% to +3.5% and the S&P/ASX 200 about +2.6% that day, so part of the move was market-wide, but Cochlear's gain was larger and no company-specific ASX catalyst was identified. The gap from $142.25 to $145.57 is still unfilled and now sits below price as support. Nov 6 added +0.67% to $155.47, and price has drifted sideways since. The Fibonacci swing in the data runs from $139.82 (Oct 27) to $155.47 (Nov 6): the 38.2% retracement is $149.49, 50% is $147.65 and 61.8% is $145.80. The 23.6% level ($151.78) is labelled support in the data, but the close is just below it, so it currently acts as a minor overhead level. The two-year Fibonacci set (a Jul 24 → Aug 18, 2026 swing) lies entirely below the current price.
② Volume

COH_volume-90d-2026-11-15.svgThe Aug 31 session stands out: about 9.7 million shares (roughly 10.6× the 20-day average) on a −1.60% close. It anchors the 90-day aVWAP and is far larger than any other bar on the panel; no specific cause is identified in the data. Aside from that bar, volume in the 90-day window has mostly run near or below average. The Oct 20 move came on about 1.3×, and Oct 21 traded about 2.6× on a +1.48% close.
The Nov 5 +8.65% session traded about 0.9× its 20-day average — not a high-volume breakout. In the last five sessions (Nov 9–13) daily moves were −2.23%, +0.26%, −1.10%, +1.50% and −1.05%, with volume between about 0.4× and 1.0× average; the final session read 0.403×. The screened ASX universe's median volume ratio ran about 0.59–1.23× from Oct 26 to Nov 13, a normal range, so the light readings reflect quiet trading in this stock rather than a market-wide distortion.
③ MACD

COH_macd-90d-2026-11-15.svgThe MACD line is 4.4637 against a signal of 3.7539, a histogram of +0.7098. The golden cross came on Oct 20 from below zero after the early-October setback, and the line moved above zero shortly afterwards. The Nov 5 jump lifted the line to its highest level of the 90-day window. Over the last several sessions the histogram bars have shortened as the signal line catches up — momentum is still positive but no longer widening. A cross back below the signal line would be the first sign that the late-October advance is losing force.
④ RSI

COH_rsi-90d-2026-11-15.svgRSI(14) is 61.7 on both frames. It fell to the mid-30s in early October, recovered through 50 in late October and touched the 70 line around Nov 5–6 before easing back. No RSI divergence is flagged on either frame. On the two-year panel, RSI spent long stretches below 30 during the February and April 2026 declines; the current reading sits in the healthier upper half of its range, without overbought pressure.
⑤ Mansfield Relative Strength

COH_rs-90d-2026-11-15.svgMansfield RS vs the S&P/ASX 200 is −12.1%, below zero (underperform), with a rising slope. A month ago it was −26.34, so it has improved by 14.28 points — negative-improving on the monthly view. A week ago it was −10.51, so the last week gave back 1.56 points — negative-deteriorating on the weekly view. On the two-year panel RS fell from near zero to about −60 after the April 2026 drop and has climbed steadily since; on the 90-day panel it rose from about −45 in July. The direction is constructive, but the stock has not yet returned to outperforming the index — a deep negative RS is a caution even when other signals look firm.
⑥ ATR & ADX

COH_atr_adx-90d-2026-11-15.svgATR(14) is $4.57, or 3.0% of price, which sets the 1×ATR reference at $146.80 and the 2×ATR technical invalidation level at $142.24, 6.0% below the close. The invalidation level sits almost exactly at the bottom of the unfilled Nov 5 gap ($142.25). ATR rose after the early-October setback and again after the Nov 5 jump, and has eased slightly in the last few sessions. ADX is 34.6 (34.3 on the two-year frame), above the 25 line that marks a strong trend, and has turned higher in November. ADX measures strength, not direction; with the moving averages now ordered upward it describes a firm short-term advance within a much larger two-year decline.
⑦ OBV

COH_obv-90d-2026-11-15.svgOBV is tagged early accumulation on the two-year frame (above MA20, flat) and accumulation on the 90-day frame (above MA20, rising). At the same time a bearish OBV divergence is flagged on both frames: price made a higher high from $145.13 (Sep 28) to $155.47 (Nov 6) while OBV made a lower high, from −11,303,532 to −11,838,860 on the 90-day frame (−10,388,997 to −10,924,325 on the two-year frame). The new price high was not matched by cumulative volume — a reason for caution, not a confirmed top.
Context: OBV adds or subtracts a session's full volume by the sign of the close, so the Aug 31 bar — about 9.7 million shares on a down close — cut OBV by that amount in one step, the cliff visible on both panels. Much of OBV's depressed level traces to that single session. The OBV-to-MA20 gap is +9.55% on the two-year frame and +8.89% on the 90-day frame; these figures measure distance from the moving average, not divergence.
Bull Case vs Bear Case
Bull Case
- SMA5 > SMA20 > SMA60 since Nov 4, formed on a quiet session one day before the Nov 5 jump
- Close above SMA20 and SMA60 since Oct 20, with MACD above its signal since the same day
- ADX 34.6 — a strong-trend reading, turning higher in November
- Mansfield RS up 14.28 points on the month (from −26.34 to −12.1)
- Price above both anchored VWAPs ($137.01 and $119.68), including the one tied to the April drop
- OBV above its MA20 on both frames; unfilled Nov 5 gap ($142.25–$145.57) sits below as support
Bear Case
- Mansfield RS still −12.1% — underperforming the S&P/ASX 200, and down 1.56 points on the week
- Bearish OBV divergence flagged (Sep 28 → Nov 6) — price higher high, OBV lower high
- The Nov 5 +8.65% jump came on roughly average volume with no company-specific catalyst identified
- The ordering has formed four times in a year; the earlier three did not lead to a sustained trend
- Price trades inside the large unfilled April gap ($114.95–$166.51), 46.9% below the 52-week high
- Light final session (0.403×) and a shrinking MACD histogram — momentum is no longer widening
Scenarios
| Scenario | Probability | Path | Trigger / Invalidation |
|---|---|---|---|
| Recovery extends | 30% | Price clears the $155.47 Nov 6 high and works toward the upper Bollinger Band ($157.83), with Mansfield RS continuing toward zero | Trigger: a close above $155.47 on above-average volume, with OBV making a new high. Invalidation: a close back below SMA20 ($145.14) |
| Consolidation below the high | 45% | Price ranges between the Fibonacci 61.8% level ($145.80) and $155.47 while the moving averages catch up and the OBV divergence resolves | Trigger: further closes inside $145.80–$155.47. The structure remains intact while closes stay above the $142.24 2×ATR level |
| Gap fill and deeper pullback | 25% | The divergence plays out: price fills the Nov 5 gap and slips toward SMA60 ($138.87) and the 90d aVWAP ($137.01) | Trigger: a daily close below $142.24 (2×ATR technical invalidation) |
Key Levels & Volatility References
| Level | Role | Distance | Basis |
|---|---|---|---|
| $157.83 | Resistance | +4.3% | Upper Bollinger Band |
| $155.47 | Resistance | +2.7% | Nov 6 close — 0% of the Fibonacci swing; SMA5 ($151.89) and the 23.6% level ($151.78) sit just above the close |
| $151.37 | Current | — | Nov 13, 2026 close |
| $149.49 | Support | −1.2% | Fibonacci 38.2% retracement of the Oct 27 → Nov 6 swing |
| $146.80 | Support | −3.0% | 1×ATR reference; Fibonacci 50% ($147.65) alongside |
| $145.57 | Support | −3.8% | Top of the unfilled Nov 5 gap; Fibonacci 61.8% ($145.80) and SMA20 ($145.14) alongside |
| $142.24 | Invalidation | −6.0% | 2×ATR technical invalidation level; bottom of the Nov 5 gap ($142.25) at the same price |
What to Watch
- The $155.47 high. A close above it on above-average volume would extend the late-October advance; repeated failures there would point to a range.
- The OBV divergence. A new price high with OBV also making a new high would cancel the non-confirmation; a pullback on rising volume would give it weight.
- Mansfield RS and the zero line. The monthly improvement is clear, but the weekly reading slipped; a move toward zero would show the stock catching up with the index.
- The Nov 5 gap ($142.25–$145.57). Holding above it keeps the jump intact; filling it would show the move was not accepted.
- The $142.24 level. A daily close below the 2×ATR technical invalidation level would undo the current structure.