Premier Investments
This analysis is based on closing-price data as of November 13, 2026. Whether you're researching Premier Investments (PMV) on the ASX or learning how to read stock charts, here are objective support, resistance and technical invalidation levels built from the RSI, MACD and ATR indicators.
Over two years Premier Investments has been in a long decline — from above $30 in early 2025 to a 52-week low of $10.58 on the September 24, 2026 results session — and it still sits 20.8% below its 52-week high of $18.24. Since late September, however, the stock has built a clean uptrend: the close ($14.44) is above SMA5, SMA20 and SMA60 in bullish order, Mansfield RS has crossed back above zero against the S&P/ASX 200, and ADX at 49.3 marks a strong trend. The lens this week is momentum quality: price made a higher high on November 11, but both RSI and OBV printed lower highs, and the November 13 session traded on only 0.65x average volume.
Snapshot as of Nov 13, 2026 close
| Item | Value | Read |
|---|---|---|
| Close | $14.44 | Above all three SMAs |
| 52-week high / low | $18.24 / $10.58 | −20.8% from high · +36.5% from low |
| SMA5 / SMA20 / SMA60 | $14.36 / $13.78 / $12.44 | Bullish order (Close > 5 > 20 > 60) |
| Bollinger (20) | $14.74 / $13.78 / $12.82 · width 13.89% | Close in the upper half, $0.30 under the upper band |
| aVWAP 2y (anchor Dec 5, 2025) | $13.17 | Close above — long-horizon holders in profit on average |
| aVWAP 90d (anchor Aug 12, 2026) | $12.34 | Close above |
| RSI(14) | 69.6 | Just below 70 · bearish divergence flagged (2y & 90d) |
| Mansfield RS vs the S&P/ASX 200 | +5.26% | Outperforming · rising · week +1.78 pts · month +10.67 pts |
| MACD (12,26,9) | 0.505 / 0.476 · hist +0.029 | Golden cross since Sep 1, 2026 · histogram thin |
| ADX(14) | 49.3 (2y) / 49.9 (90d) | Strong trend |
| ATR(14) | $0.34 (2.36%) | Moderate volatility |
| OBV 2y / 90d | Early accumulation (+3.2% vs MA20, flat) / Early accumulation (+16.52% vs MA20, flat) | 90d bearish OBV divergence |
| Volume (Nov 13) | 231,751 · 0.65x of 20-day avg 358,062 | Light |
| 1× / 2× ATR technical invalidation | $14.10 / $13.76 | 2×ATR sits 4.7% below the close, right at SMA20 |
① Price & Moving Averages
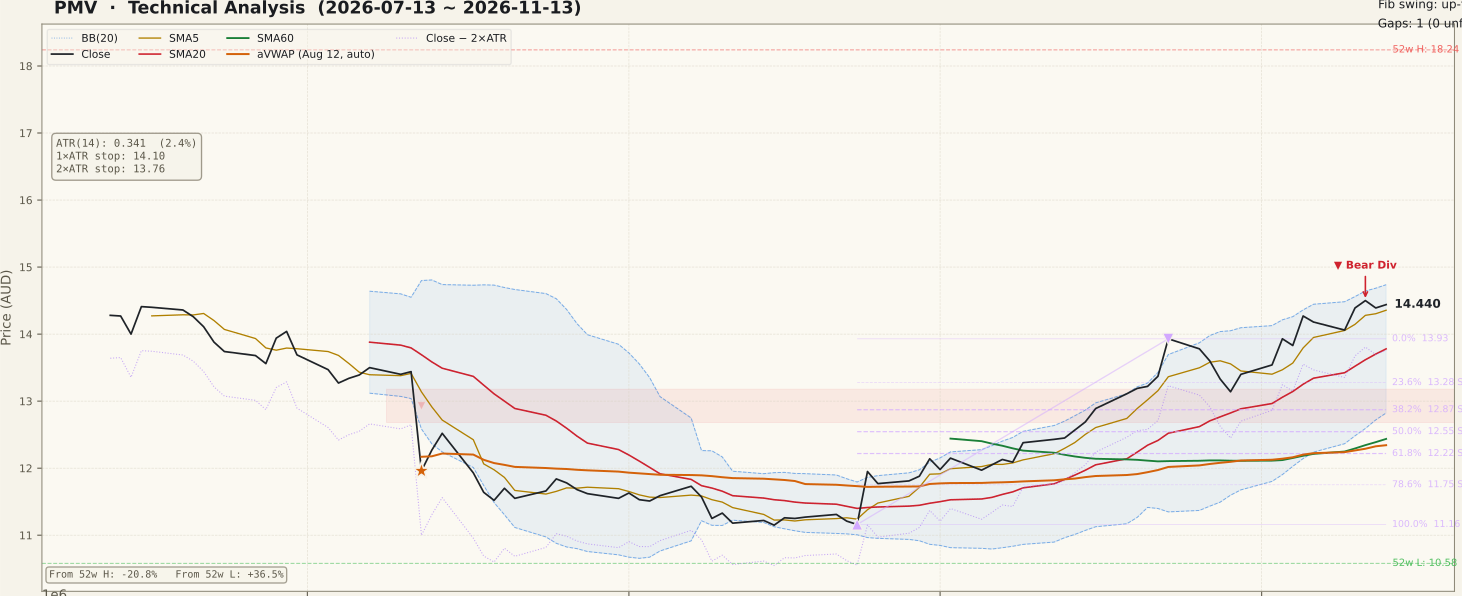
The two-year chart is dominated by decline: two very large January 2025 drops left unfilled gaps at $30.50–$32.91 and $21.52–$28.15, far above today's price. Moves of that size in an ASX company often reflect corporate actions such as capital distributions rather than ordinary trading, so they are context, not near-term resistance — the company's own announcements are the place to confirm what they were. Closer in, an August 12, 2026 session fell 11.0% on heavy volume, and the stock based around $11.15–$11.30 through mid-September. The turn came with the September 24 FY26 results session: an intraday low of $10.58 (the 52-week low) and a close of $11.95, up 7.1% on roughly 3.2x volume — the session that put the close back above SMA20.
What makes this an MA-trend chart is that the defining alignment formed separately and later. The close cleared SMA60 on October 9, and SMA5 > SMA20 > SMA60 stacked on October 19 on an ordinary +1.7% session with below-average volume — about four weeks after the results reaction — and that order has held since. It is the second time in a year this alignment has formed. Price now rides the upper half of the Bollinger Bands ($14.74 upper) and sits above both the 2y aVWAP ($13.17) and the 90d aVWAP ($12.34). The Fibonacci grid in the data is drawn on the September 23 – October 23 leg ($11.16 to $13.93); price has since moved above that leg's high, so every retracement level now sits below the close (23.6% at $13.28, 38.2% at $12.87, 50% at $12.55).
② Volume

The heavy-volume sessions of the last 90 days sit outside the recent window: August 12 (the 11% drop), September 18 (an S&P/ASX index rebalance day, on which price barely moved), September 24 (results) and September 30. Since then, the climb from about $12 to $14.44 has been carried by ordinary volume rather than spikes — a steady character, but not an emphatic one. The basis-date session printed 0.65x the 20-day average, and none of the last five sessions stands out as an outlier. The wider ASX universe was not unusually busy either (median volume ratios across late October to mid-November were in a normal range), so the light print is not a market-wide artefact.
③ MACD

MACD crossed above its signal line on September 1, 2026 from well below zero — an early cross that preceded the results session by more than three weeks. The line has since climbed to 0.505 against a signal of 0.476, comfortably positive. The histogram, though, is only +0.029: the two lines have been running almost parallel since late October, which means momentum is being maintained rather than accelerating. A histogram that turns negative while price holds up would be the first MACD sign of fatigue.
④ RSI

RSI stands at 69.6, just under the 70 line. More important is the bearish divergence flagged on both timeframes: the first price peak was October 23 at $13.93 with RSI at 83.39, and the second price peak on November 11 at $14.50 came with a lower RSI reading of 72.49 on that leg. Price made a higher high while momentum made a lower one. A divergence is a possibility of a pause or pullback, not a confirmed top — in strong trends (ADX near 50 here) such divergences often resolve sideways. It becomes meaningful only if price follows through by losing nearby support.
⑤ Mansfield Relative Strength

Mansfield RS vs the S&P/ASX 200 is +5.26% and rising. A week ago it was +3.48 (a gain of 1.78 points) and a month ago it was −5.41 (a gain of 10.67 points), so the stock has moved from underperforming to outperforming the index within a month and is still accelerating. The two-year view puts that in context: RS spent most of 2025 and 2026 deep below zero (around −20 to −35), so the current reading is a first push into positive territory, not an established leadership position. Holding above zero over the coming weeks would matter more than the size of the reading.
⑥ ATR & ADX

ATR(14) is $0.34, or 2.36% of price — moderate, and below the spike that followed the results session. ADX reads 49.3 on the two-year series and 49.9 on the 90-day series, well above 25, so the trend is strong. ADX measures strength, not direction; here it confirms the persistence of the October–November advance. Very high ADX readings can also precede a cooling phase, so the indicator supports trend persistence without guaranteeing extension. The ATR-based references are $14.10 (1×ATR) and $13.76 (2×ATR), the latter sitting almost exactly on SMA20.
⑦ OBV

OBV is tagged early accumulation on both timeframes (above its MA20 with a flat slope): +3.2% above MA20 on the two-year series and +16.52% on the 90-day series. The two-year OBV line has recovered sharply from its September low but remains far below its early-2025 levels, so long-run volume flow has not repaired the decline. On the 90-day series there is a bearish OBV divergence: OBV peaked at 2,820,728 on October 23 ($13.93) and reached a lower 2,686,335 on November 11 ($14.50). That matches the RSI message — the latest leg higher drew less net volume than the October leg. No OBV divergence is flagged on the two-year series.
Bull Case
- Close > SMA5 > SMA20 > SMA60 in bullish order since October 19, formed weeks after the results reaction on a non-event session
- Mansfield RS +5.26% vs the S&P/ASX 200, up 10.67 points in a month — now outperforming and accelerating
- ADX 49.3–49.9 marks a strong, persistent trend
- MACD golden cross since September 1 with both lines positive
- Close above both the 2y aVWAP ($13.17) and 90d aVWAP ($12.34)
- OBV above its MA20 on both timeframes (early accumulation)
Bear Case
- Bearish RSI divergence on both timeframes (83.39 → 72.49 while price rose $13.93 → $14.50)
- Bearish 90-day OBV divergence (2,820,728 → 2,686,335)
- Basis-date volume only 0.65x average; the advance has not drawn volume spikes since September
- MACD histogram thin at +0.029 — momentum flat rather than building
- Still 20.8% below the 52-week high, inside a two-year downtrend
- RSI at 69.6 and price near the upper Bollinger Band ($14.74) leave little room before stretched readings
Scenarios
| Scenario | Probability | Path | Trigger / Invalidation |
|---|---|---|---|
| Trend continuation | 40% | Price holds above SMA20 and extends through the upper Bollinger Band ($14.74) as the divergences are absorbed | Trigger: closes above $14.74 with volume back above 1x average · Invalidation: close below $13.76 |
| Consolidation / pullback toward the averages | 40% | Divergences resolve by time or a dip toward $13.93 (former Oct 23 high) and SMA20 $13.78, with the bullish MA order intact | Holds while closes stay above SMA20; a close below $13.76 shifts it to the third path |
| Trend failure | 20% | Close below 2×ATR and SMA20 opens a retracement toward Fib 23.6% $13.28, then 38.2% $12.87 | Trigger: daily close below $13.76 · Deeper reference: SMA60 $12.44 / 90d aVWAP $12.34 |
Key Levels & Volatility References
| Price | Role | Basis |
|---|---|---|
| $14.74 | Resistance | Upper Bollinger Band (20) |
| $14.44 | Current | Nov 13 close |
| $14.10 | Reference | 1×ATR technical invalidation |
| $13.93 | Support (former high) | Oct 23 swing high / Fib 0% anchor — now below the close |
| $13.78 | Support | SMA20 / Bollinger mid |
| $13.76 | Invalidation | 2×ATR technical invalidation level (−4.7%) |
| $13.28 | Support | Fib 23.6% of the Sep 23 – Oct 23 leg |
What to Watch
- Whether closes stay above SMA20 ($13.78) and the 2×ATR level ($13.76) — the two sit almost together, which makes that zone the line the trend structure rests on.
- Volume on any push through $14.74: a move on above-average volume would answer the light-volume concern; another sub-1x advance would keep it open.
- RSI and OBV: a new price high with RSI and OBV also making new highs would neutralise the divergences; a drop below the late-October RSI trough would give them weight.
- Mansfield RS holding above zero vs the S&P/ASX 200 — the first positive stretch after a long period deep in negative territory.
- The MACD histogram — a turn below zero while price stalls would be the first momentum crack.