Ansell
This analysis is based on closing-price data as of November 13, 2026. Whether you're researching Ansell (ANN) on the ASX or learning how to read stock charts, here are objective support, resistance and technical invalidation levels built from the RSI, MACD and ATR indicators.
Ansell closed at $46.31 on November 13, 1.9% below the $47.19 52-week high it touched intraday the session before and 84.9% above its $25.05 52-week low of May 18, 2026. Over two years the chart has gone from a long sideways-to-lower stretch, including the −14.3% session of Apr 3, 2025 and a slide to that May 2026 low, into a steep recovery that gapped higher around the FY26 results on Aug 24–25 and has since spent two months consolidating in roughly a $44–$47 band. Within that band the short-term moving averages are back in bullish order and MACD has just crossed up, while Mansfield RS versus the S&P/ASX 200 remains strongly positive at +30.5%. The caveats are an RSI bearish divergence on the new high, a MACD cross that happened far above zero after a long decline in momentum, and very light volume on the latest sessions.
Snapshot as of November 13, 2026
| Item | Value | Reading |
|---|---|---|
| Close | $46.31 | −1.9% from 52w high · +84.9% from 52w low; −1.4% on the day after the $46.95 Nov 12 close (highest close on the chart) |
| 52-week range | $25.05 – $47.19 | At the top of the range; the high is the Nov 12, 2026 intraday print and the low is May 18, 2026 |
| SMA 5 / 20 / 60 | $46.37 / $45.80 / $43.91 | SMA5 > SMA20 > SMA60 re-formed Nov 11; close sits just under SMA5 and 1.1% above SMA20 |
| Bollinger (20) | $47.38 / $45.80 / $44.23 | Band width 6.88% — narrow; close in the upper half, below the upper band |
| aVWAP (2y anchor Apr 3, 2025) | $34.25 | Price far above the long-term average anchored to the Apr 3, 2025 −14.3% session |
| aVWAP (90d anchor Aug 24, 2026) | $43.46 | Price above the average anchored to the Aug 24 results-gap session |
| RSI(14) | 57.9 | Bearish RSI divergence flagged: higher price high on Nov 12, lower RSI peak (64.31 vs 81.51) |
| Mansfield RS (vs the S&P/ASX 200) | +30.5% | Outperform; +0.36 points on the week, −6.80 on the month (slope falling) |
| MACD (12,26,9) | 0.5094 / 0.4985 / +0.0109 | Golden cross on Nov 12, well above zero; histogram just turned positive (90-day frame 0.5088 / 0.4976 / +0.0112) |
| ADX(14) | 33.1 | Strong-trend reading, though well down from its September levels (33.5 on the 90-day frame) |
| ATR(14) | $0.894 (1.9%) | Low volatility for this chart; 2×ATR spans about 3.9% of the share price |
| OBV (2y / 90d) | early accumulation / early accumulation | Above MA20 but flat on both frames (16.42% / 13.92% above MA20); no OBV divergence flagged |
| Volume vs 20d avg | 0.303× | 199,181 shares against a 656,695 average — a very light session |
| 1×ATR / 2×ATR technical invalidation | $45.42 / $44.52 | Volatility-based structural reference levels below the close |
① Price & Moving Averages
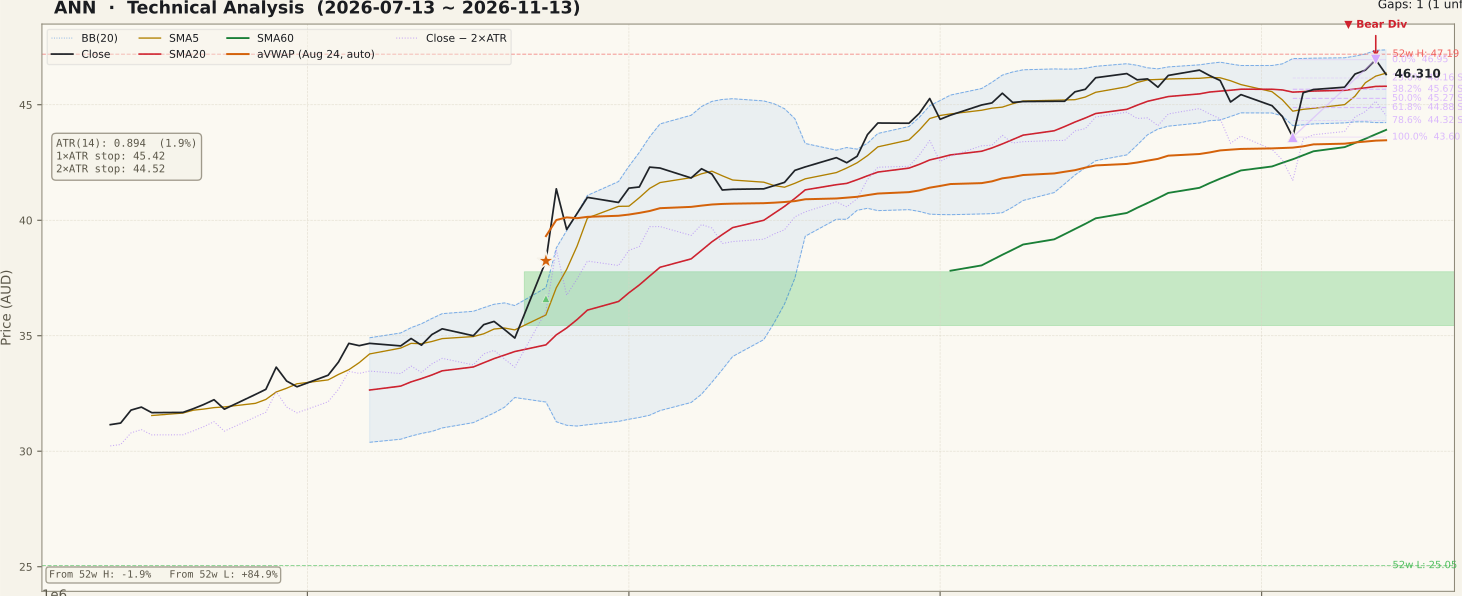
ANN_price-90d-2026-11-15.svgThe two-year frame starts near $33 in late 2024 and spends most of 2025 swinging inside roughly $28–$38. The sharpest single bar is Apr 3, 2025, a −14.3% session on about 3.8× average volume that anchors the two-year aVWAP ($34.25). A second leg down in early 2026 took price to the $25.05 52-week low on May 18, 2026; from there a recovery began that turned into a steep advance in August.
The decisive step came with the FY26 results: Aug 24 closed +9.6% on about 4.0× volume and opened a gap that is still unfilled ($35.44–$37.77, a support zone), and Aug 25 added +8.2%. Since late September price has moved sideways in a narrow band, with closes between $43.60 (Nov 4) and $46.95 (Nov 12). The Nov 4 low was followed by a +4.4% recovery on Nov 5; the close moved back above SMA20 on Nov 6 on a flat session with elevated volume, and the SMA5 > SMA20 > SMA60 ordering re-formed on Nov 11 on a quiet +0.4% session — the second time that ordering has formed in the past year. The close has been above SMA60 continuously since Jun 3.
The company's AGM on Nov 9 reaffirmed FY27 adjusted EPS guidance of US158–170c; that session closed +0.2% on below-average volume, so the chart shows no price reaction to it. The 90-day Fibonacci swing runs from the $43.60 Nov 4 low to the $46.95 Nov 12 high: 23.6% is $46.16, just under the close, and 38.2% is $45.67, close to SMA20. The two-year swing is anchored on the older Aug 21–Sep 3 advance ($34.90 to $42.30), so all of its levels sit well below the current price; its 0% anchor at $42.30 is labelled resistance in that construction but is now an area price has already moved above.
② Volume

ANN_volume-90d-2026-11-15.svgThe tallest bars on the 90-day panel are the results sessions of late August — Aug 24 (about 4.0×), Aug 25 (3.1×) and Aug 26 (4.5×) — which are what lifted price into its current range. Since then volume has mostly stayed near its 20-day average, with a few spikes inside the consolidation.
The most recent bursts were Nov 5 and Nov 6, the rebound from the Nov 4 low (Nov 6 close to 2× the average). The sessions that followed were quieter, including the Nov 12 push to the $47.19 intraday high. The basis-date session traded only 199,181 shares, 0.303× the 20-day average of 656,695, as price slipped 1.4%. Moves toward the top of the range on below-average volume are less convincing than the August advance, which came with heavy participation; equally, the Nov 13 dip on very thin volume carries little information by itself.
③ MACD

ANN_macd-90d-2026-11-15.svgMACD surged with the August results move and peaked above 2 in mid-September, then drifted lower for two months as price went sideways; the histogram was negative for most of October and early November. On Nov 12 MACD (0.5094) crossed back above its signal line (0.4985), and the histogram is now a slim +0.0109. Because the cross happened well above zero after a long decline in momentum, it reads as momentum stabilising inside an existing trend rather than an early-cycle turn. A golden cross with a histogram this small can easily reverse, as the short-lived cross around late September on the 90-day panel shows.
④ RSI

ANN_rsi-90d-2026-11-15.svgRSI(14) spent most of September and October above 70, then cooled to below 40 around the Nov 4 low before recovering to 64.31 on Nov 12 and easing to 57.9 on Nov 13. A bearish RSI divergence is flagged on both frames: the first peak is recorded at $45.50 (Oct 7) with an RSI reading of 81.51, and the second at $46.95 (Nov 12) with RSI at 64.31 — a higher price high on a clearly lower RSI peak. That pattern says the latest high came with less momentum behind it. A divergence is a possibility of a top, not confirmation of one; it needs follow-through, such as closes back below SMA20, before it means anything more.
⑤ Mansfield RS

ANN_rs-90d-2026-11-15.svgMansfield RS versus the S&P/ASX 200 is +30.5%, firmly above zero on both frames (outperform). It was 30.14% a week ago, so the weekly change is +0.36 points — positive and edging up — but it was 37.30% a month ago, so the monthly change is −6.80 points: positive but slowing, which matches the "falling" slope tag. On the two-year panel RS spent much of 2025 and early 2026 below zero, crossed back above it around July 2026 and jumped with the August results. The lead over the index is still large; the past month simply gave some of it back as price moved sideways.
⑥ ATR · ADX

ANN_atr_adx-90d-2026-11-15.svgATR(14) is $0.894, or 1.9% of the share price — well down from the late-August spike after the results gap, with a small bump around the early-November swing. The 1×ATR reference is $45.42 and the 2×ATR technical invalidation level is $44.52, about 3.9% below the close. ADX(14) reads 33.1 (33.5 on the 90-day frame), still a strong-trend value, but it has been falling from far higher levels in September and October. ADX measures strength, not direction: a declining ADX during a sideways band is consistent with the August trend losing force, and a fresh rise would be needed to show a new directional phase.
⑦ OBV

ANN_obv-90d-2026-11-15.svgOBV is above its 20-day average on both frames with a flat slope — state "early accumulation" on the two-year and the 90-day chart. It sits 16.42% above its MA20 on the two-year frame and 13.92% on the 90-day frame; those figures measure the gap to its own average, not a divergence. On the two-year panel OBV has climbed steadily from its mid-2026 trough to the highest level of the window, so the volume balance has backed the advance. No OBV divergence is flagged on either frame, which contrasts with the RSI divergence: the volume flow has not weakened in the way momentum has.
Bull Case vs Bear Case
Bull Case
- SMA5 > SMA20 > SMA60 re-formed Nov 11 on a quiet session, with the close above SMA60 since Jun 3
- Mansfield RS +30.5% versus the S&P/ASX 200, +0.36 points on the week
- MACD golden cross on Nov 12, histogram back above zero
- OBV at the top of its two-year range, above MA20 on both frames, with no OBV divergence
- Price above both aVWAPs ($43.46 and $34.25) and within 1.9% of the 52-week high
- Narrow Bollinger width (6.88%) and 1.9% ATR — a compressed range that has held for two months
Bear Case
- Bearish RSI divergence: higher price high on Nov 12 with RSI 64.31 against a prior 81.51
- The MACD cross came far above zero after two months of fading momentum, with a histogram of only +0.0109
- The push to the $47.19 high came on below-average volume; Nov 13 traded 0.303× average
- Mansfield RS is down 6.80 points on the month (slope falling)
- ADX has been declining from its September levels, consistent with a trend losing force
- Close $46.31 sits just below SMA5 ($46.37) after a −1.4% session
Scenarios
| Scenario | Probability | Path | Trigger / Invalidation |
|---|---|---|---|
| Range continues | 45% | Price keeps oscillating between SMA20 ($45.80) and the $46.95–$47.19 highs while RSI resets and the narrow Bollinger Band stays compressed | Trigger: further closes inside $45.80–$46.95 on average or lighter volume. The structure holds while closes stay above the $44.52 2×ATR level |
| Range resolves upward | 30% | Price clears the $47.19 52-week high and the upper Bollinger Band ($47.38), with MACD widening above its signal and RS turning back up | Trigger: a close above $47.19 on above-average volume. Invalidation: a close back below SMA20 |
| Divergence plays out | 25% | The RSI divergence is followed by a break of SMA20 and the Nov 4 low area ($43.60), with SMA60 ($43.91) and the 90-day aVWAP ($43.46) next in line | Trigger: a daily close below $44.52 (2×ATR technical invalidation) |
Key Levels & Volatility References
| Level | Role | Distance | Basis |
|---|---|---|---|
| $47.19 | Resistance | +1.9% | 52-week high (Nov 12, 2026 intraday); upper Bollinger Band ($47.38) just above |
| $46.95 | Resistance | +1.4% | Nov 12 close — swing high of the 90-day Fibonacci (0% of the swing) |
| $46.31 | Current | — | Nov 13, 2026 close; SMA5 ($46.37) alongside |
| $46.16 | Support | −0.3% | 90-day 23.6% retracement |
| $45.80 | Support | −1.1% | SMA20 / Bollinger mid line; 90-day 38.2% retracement ($45.67) just below |
| $45.42 | Support | −1.9% | 1×ATR reference; 90-day 50% retracement ($45.27) just below |
| $44.52 | Invalidation | −3.9% | 2×ATR technical invalidation level |
What to Watch
- The $47.19 52-week high. A close above it on above-average volume would resolve the two-month band upward; another light-volume approach would keep it a ceiling.
- SMA20 at $45.80. It has been the reference line of the consolidation; closes back below it would be the first follow-through on the RSI divergence.
- The MACD histogram. At +0.0109 the Nov 12 golden cross is marginal — a widening positive histogram would confirm it, a quick re-cross down would cancel it.
- Mansfield RS. After −6.80 points on the month, holding around +30% would show the lead over the S&P/ASX 200 intact.
- The $44.52 level. A daily close below the 2×ATR technical invalidation level would undo the current structure.