Aurizon Holdings
This analysis is based on closing-price data as of November 13, 2026. Whether you're researching Aurizon Holdings (AZJ) on the ASX or learning how to read stock charts, here are objective support, resistance and technical invalidation levels built from the RSI, MACD and ATR indicators.
Aurizon Holdings closed at $3.99 on November 13, 9.7% below its $4.42 52-week high and 18.0% above its $3.38 52-week low. Over two years the chart has climbed from a 2025 base under $3.10 to a mid-2026 peak, then lost about 10% in a single high-volume gap on Aug 17 and spent September basing between roughly $3.65 and $3.75. Since October the stock has ground higher in small steps, and on the basis date it closed above its prior 20-day high — by one cent, on about half its average volume. The lens for this page is a slow, low-volatility breakout: moving averages are stacked and MACD is positive, but price is now pressing into the band left open by the August gap, RSI sits near 70 with a marginal bearish divergence, and Mansfield RS versus the S&P/ASX 200 is still slightly below zero.
Snapshot as of November 13, 2026
| Item | Value | Reading |
|---|---|---|
| Close | $3.99 | −9.7% from 52w high · +18.0% from 52w low; +0.25% on the day, highest close since the Aug 17 gap |
| 52-week range | $3.38 – $4.42 | Middle-upper part of the range; the high is a Jun 11, 2026 intraday print and the low is from Nov 19, 2025 |
| SMA 5 / 20 / 60 | $3.93 / $3.87 / $3.76 | Close > SMA5 > SMA20 > SMA60 (ordering formed Oct 30); close 3.2% above SMA20 |
| Bollinger (20) | $3.99 / $3.87 / $3.74 | Band width 6.38% — narrow; close sits on the upper band |
| aVWAP (2y anchor Feb 16, 2026) | $3.98 | Price only 0.2% above the long-term anchored average — essentially on it |
| aVWAP (90d anchor Aug 17, 2026) | $3.74 | Price 6.6% above the average anchored to the Aug 17 gap-down session |
| RSI(14) | 69.6 | Just under 70; bearish divergence flagged on both frames (Nov 3 vs Nov 13 — a narrow one) |
| Mansfield RS (vs the S&P/ASX 200) | −1.01% | Underperform but rising; +2.67 points on the week, +1.99 on the month |
| MACD (12,26,9) | 0.0482 / 0.0386 / +0.0096 | Above signal since the Sep 3 golden cross; now above zero (two-year frame 0.0482 / 0.0385 / +0.0096) |
| ADX(14) | 23.4 | Trend forming (23.0 on the two-year frame) |
| ATR(14) | $0.061 (1.5%) | Low volatility; 2×ATR spans 3.1% of the share price |
| OBV (2y / 90d) | early accumulation / accumulation | Above MA20 on both frames — flat slope on two years, rising on 90 days; no OBV divergence flagged |
| Volume vs 20d avg | 0.522× | 2,865,789 shares against a 5,495,140 average — the breakout close came on below-average volume |
| 1×ATR / 2×ATR technical invalidation | $3.93 / $3.87 | Volatility-based structural reference levels below the close |
① Price & Moving Averages
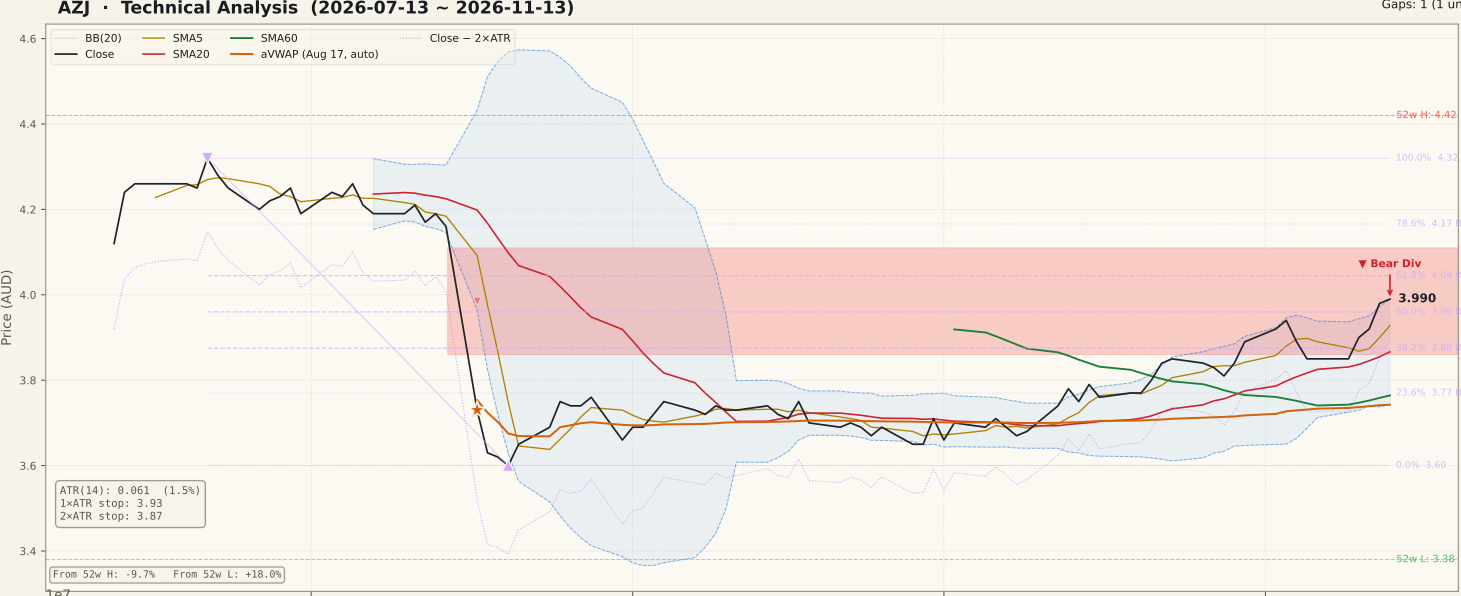
AZJ_price-90d-2026-11-15.svgThe two-year frame opens near $3.40 in late 2024, drifts down to a low-close region around $2.89–$3.00 in April–May 2025, and then turns into a steady climb: about $3.60 by late 2025, a jump to $4.15 by Feb 27, 2026, and a peak in June 2026 (52-week high $4.42 intraday on Jun 11). Price stayed mostly above $4.10 into mid-August. On Aug 17, 2026 the stock gapped down from a $4.16 close to open at $3.86 and closed at $3.73 (−10.3%) on 24.6 million shares, the heaviest session on the 90-day panel. That session is three months before the basis date and anchors the 90-day aVWAP ($3.74).
After a low close of $3.60 on Aug 20, September was a tight base between about $3.65 and $3.75. The recovery came in small increments rather than a single bar: the close moved above SMA20 on Oct 12, above SMA60 on Oct 22, and the SMA5 > SMA20 > SMA60 ordering formed on Oct 30. The Nov 13 close of $3.99 (+0.25%) cleared the prior 20-day high of $3.98 by one cent. None of those condition dates coincided with a large move; the biggest daily gain in the last five sessions was +1.5% (Nov 12).
That grind has now carried price into the band left by the August gap, which runs from $3.86 up to $4.11 and is still open at its upper edge. The close also sits right on the 2-year aVWAP ($3.98, anchored Feb 16, 2026) and on the upper Bollinger Band ($3.99). On the 90-day Fibonacci (the Jul 22 $4.32 high to the Aug 20 $3.60 low), price has moved through the 50% retracement ($3.96); the 61.8% level ($4.04) and 78.6% level ($4.17) are next above. The two-year Fibonacci measures the February 2026 advance ($3.59 → $4.15) and puts its 23.6% level at $4.02, just above the close, and its 38.2% level at $3.94.
② Volume

AZJ_volume-90d-2026-11-15.svgThe tallest bars on the 90-day panel cluster in the second half of August — Aug 17 (24.6 million shares), Aug 25 (23.5 million) and Aug 31 (18.7 million) — when the gap-down was being absorbed. Since then volume has settled into a much quieter pattern.
The advance of the past week came on shrinking turnover: daily volume fell from 6.43 million on Nov 9 to 2.87 million on Nov 13, and the basis-date breakout printed at 0.522× the 20-day average. The screened ASX universe's median volume ratio ranged 0.59–1.23× between Oct 26 and Nov 13, so the market as a whole was not unusually quiet. A breakout on below-average volume is the classic case where confirmation is missing: it shows a lack of supply rather than demonstrated demand. Aurizon has an on-market share repurchase in progress (up to A$250m, running to August 2027 — for example, 314,515 shares were repurchased on Nov 11), which is part of the background turnover but is not a discrete event in the window.
③ MACD

AZJ_macd-90d-2026-11-15.svgMACD crossed above its signal line on Sep 3 from well below zero, after the August decline, and has stayed above it since — more than two months. It moved above zero during October and now reads 0.0482 against a signal of 0.0386, a histogram of +0.0096. The histogram is positive but small, consistent with the measured pace of the advance. A golden cross that started deep below zero and has persisted this long is a sign of a recovery that has matured into an uptrend; a histogram turning negative would be the first sign of that momentum fading.
④ RSI

AZJ_rsi-90d-2026-11-15.svgRSI(14) is 69.6, just under the 70 line. A bearish RSI divergence is flagged on both frames: on Nov 3 the close was $3.94 with RSI at 70.27, and on Nov 13 the close was a higher $3.99 with RSI at a slightly lower 69.64 (two-year frame 70.18 and 69.60). The gap between the two RSI readings is well under one point, so this is a narrow divergence — it says momentum has not kept pace with the latest higher close, not that a top is in place. A divergence is a possibility of reversal, not a confirmation; it would only gain weight if price failed back below the early-November closes.
⑤ Mansfield RS

AZJ_rs-90d-2026-11-15.svgMansfield RS versus the S&P/ASX 200 is −1.01%, the same on both frames: still marginally underperforming the index. It was −3.68% a week ago and −3.00% a month ago, so the weekly change is +2.67 points and the monthly change +1.99 — negative but improving, climbing toward the zero line. The panel shows RS fell below zero with the August gap and has been recovering since. A common misreading is to treat a rising RS line as outperformance: until RS crosses above zero, AZJ has only been losing ground to the index more slowly. A move above zero would be the first sign of genuine relative leadership.
⑥ ATR · ADX

AZJ_atr_adx-90d-2026-11-15.svgATR(14) is $0.061, or 1.5% of the share price — a low-volatility profile well below the levels seen around the August gap. The 1×ATR reference is $3.93 and the 2×ATR technical invalidation level is $3.87, 3.1% below the close. That level lines up with SMA20 ($3.87), the two-year 50% retracement ($3.87) and the lower edge of the August gap band ($3.86), so several references converge in the same place. ADX(14) is 23.4, in the 20–25 range where a trend is forming but not yet strong. With ATR this low, normal daily noise is small, which is part of why a one-cent margin over the 20-day high was enough to register a breakout.
⑦ OBV

AZJ_obv-90d-2026-11-15.svgOBV is above its 20-day average on both frames. The two-year state is "early accumulation" with a flat slope, 18.98% above MA20; the 90-day state is "accumulation" with a rising slope. The 90-day figure of 87.94% above MA20 is inflated because that frame's OBV and its average sit near zero (the line is still slightly negative after the heavy-volume August decline), so it should be read as direction rather than size — and in any case that figure measures distance to its own average, not a divergence. No OBV divergence is flagged on either frame. The picture is of volume balance recovering steadily, but on the two-year frame it has not yet built a clear upward slope.
Bull Case vs Bear Case
Bull Case
- Close > SMA5 > SMA20 > SMA60, with the ordering formed on Oct 30 after a gradual, non-event recovery
- MACD above signal since Sep 3 and now above zero
- Highest close since the Aug 17 gap, and above the prior 20-day high
- Mansfield RS +2.67 points on the week and +1.99 on the month, approaching zero
- OBV above MA20 on both frames; 90-day OBV rising
- Low ATR (1.5%) keeps the 2×ATR technical invalidation level close, at $3.87
Bear Case
- The breakout margin is one cent and came on 0.522× average volume — no volume confirmation
- Price is inside the open Aug 17 gap band; its upper edge at $4.11 is overhead
- Bearish RSI divergence on both frames with RSI at 69.6 (narrow, but present)
- Mansfield RS is still below zero (−1.01%) — not yet outperforming the S&P/ASX 200
- Close on the upper Bollinger Band and the 2y aVWAP ($3.98), with the band only 6.38% wide
- ADX 23.4 — the trend is still forming rather than established
Scenarios
| Scenario | Probability | Path | Trigger / Invalidation |
|---|---|---|---|
| Consolidation inside the gap | 40% | Price stalls between the SMA20 cluster ($3.87) and the $4.04 Fibonacci level while RSI cools from near 70 | Trigger: closes holding $3.87–$4.04 on ordinary volume. The structure holds while closes stay above $3.87 (2×ATR) |
| Breakout extends | 35% | Price clears $4.04, works toward the $4.11 gap top and the $4.15 February swing high, with RS crossing above zero | Trigger: a close above $4.04 on above-average volume. Invalidation: a close back below SMA5 ($3.93) |
| Breakout fails | 25% | The low-volume breakout reverses, the RSI divergence plays out, and price falls back through the $3.87 cluster toward SMA60 ($3.76) | Trigger: a daily close below $3.87 (2×ATR technical invalidation) |
Key Levels & Volatility References
| Level | Role | Distance | Basis |
|---|---|---|---|
| $4.11 | Resistance | +3.0% | Upper edge of the open Aug 17, 2026 gap ($3.86–$4.11); $4.15 two-year swing high (Feb 27) just above |
| $4.04 | Resistance | +1.4% | 90-day 61.8% retracement of the Jul 22–Aug 20 decline; two-year 23.6% level ($4.02) alongside |
| $3.99 | Current | — | Nov 13, 2026 close; upper Bollinger Band ($3.99) alongside |
| $3.98 | Support | −0.2% | 2-year anchored VWAP (anchor Feb 16, 2026); prior 20-day high ($3.98) alongside |
| $3.94 | Support | −1.4% | Two-year 38.2% retracement; 1×ATR reference ($3.93) and SMA5 ($3.93) alongside |
| $3.87 | Invalidation | −3.1% | 2×ATR technical invalidation level; SMA20 / Bollinger mid ($3.87), two-year 50% retracement ($3.87) and gap lower edge ($3.86) alongside |
| $3.76 | Support | −5.7% | SMA60; 90-day 23.6% retracement ($3.77) and 90-day aVWAP ($3.74) nearby |
What to Watch
- Volume on the next up day. The breakout printed at 0.522× average; a close above $4.04 with volume above its 20-day average would supply the confirmation that is missing so far.
- The $4.11 gap top. Filling the August gap would remove the nearest overhead reference; stalling below it would keep price inside the gap band.
- Mansfield RS crossing zero. At −1.01% and improving, a move above zero would turn a slowing underperformance into actual outperformance of the S&P/ASX 200.
- RSI near 70. A higher high in RSI alongside price would cancel the narrow divergence; a drop under 60 with price slipping would give it weight.
- The $3.87 level. A daily close below the 2×ATR technical invalidation level, where SMA20 and the gap's lower edge also sit, would undo the current structure.