Brightstar Resources
This analysis is based on closing-price data as of November 13, 2026. Whether you're researching Brightstar Resources (BTR) on the ASX or learning how to read stock charts, here are objective support, resistance and technical invalidation levels built from the RSI, MACD and ATR indicators.
Brightstar Resources closed at $0.655 on November 13, 11.5% below the $0.740 52-week high it set two sessions earlier and well above its $0.275 52-week low from June. After a long 2025–2026 decline to that June low, the gold explorer re-rated from August, and the current short-term structure was built in a single week: the move back above SMA60 came on Nov 5, a day when the whole ASX gold sector rallied, and the close above SMA20 came on Nov 9, when BTR gained +10.6% — roughly twice the move in its gold peers — with no company-specific catalyst identified. The two down sessions that followed (−7.4% and −4.4%) are the pullback this page examines; RS versus the S&P/ASX 200 is still strongly positive (+35.6%), but both RSI and OBV show bearish divergence at the new high.
Snapshot as of November 13, 2026
| Item | Value | Reading |
|---|---|---|
| Close | $0.655 | −4.4% on the day after −7.4% on Nov 12; −11.5% from the 52w high · +138.2% from the 52w low |
| 52-week range | $0.275 – $0.740 | The high is the Nov 11, 2026 close (also that day's intraday high); the low is the Jun 25, 2026 intraday low |
| SMA 5 / 20 / 60 | $0.695 / $0.636 / $0.608 | SMA5 > SMA20 > SMA60 since Nov 10; close now below SMA5 but 3.1% above SMA20 |
| Bollinger (20) | $0.763 / $0.636 / $0.508 | Band width 40.13% — very wide; close just above the mid line |
| aVWAP (2y anchor Feb 2, 2026) | $0.475 | Price well above the long-term average anchored to the Feb 2, 2026 −21.4% bar |
| aVWAP (90d anchor Aug 25, 2026) | $0.601 | Price above the short-term average anchored to the Aug 25 +12.4% bar |
| RSI(14) | 52.5 | Back near the midline; bearish divergence (Sep 30 $0.700 / RSI 77.1 → Nov 11 $0.740 / RSI 64.8) |
| Mansfield RS (vs the S&P/ASX 200) | +35.6% | Outperform; +6.16 points on the week, −16.68 on the month (slope flagged "falling") |
| MACD (12,26,9) | 0.0159 / 0.0078 / +0.0081 | Golden cross on Nov 10, just above zero |
| ADX(14) | 22.3 | Trend forming (22.7 on the 90-day frame) |
| ATR(14) | $0.050 (7.7%) | High volatility; 2×ATR spans 15.3% of the share price |
| OBV (2y / 90d) | distribution / distribution | Below a falling MA20 on both frames (−26.7% / −9.96% vs MA20); bearish OBV divergence on both |
| Volume vs 20d avg | 0.766× | 6,426,009 shares against an 8,385,985 average |
| 1×ATR / 2×ATR technical invalidation | $0.605 / $0.555 | Volatility-based structural reference levels below the close |
① Price & Moving Averages
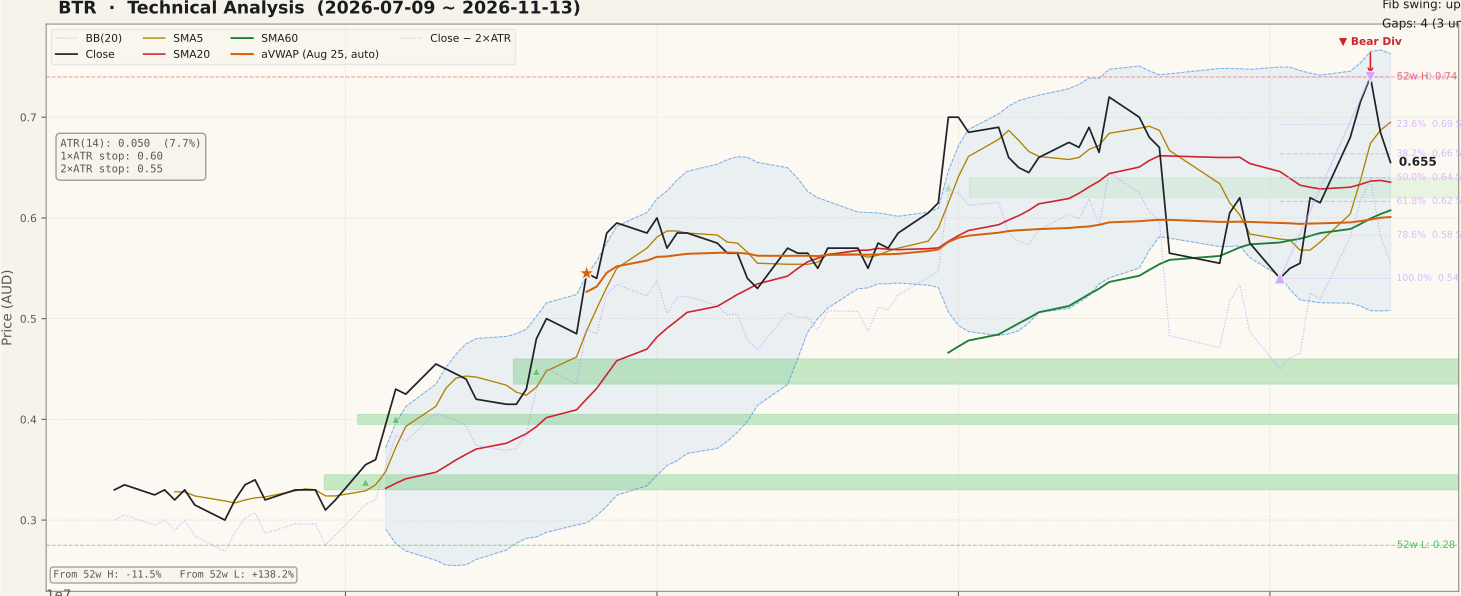
BTR_price-90d-2026-11-15.svgThe two-year frame opens at $0.5625 in November 2024 and spends most of 2025 in a sideways-to-lower range between roughly $0.37 and $0.73 on a closing basis. A rebound to $0.630 in January 2026 failed on Feb 2, 2026, when the shares fell −21.4% on about 3.0× average volume — the bar that anchors the two-year aVWAP ($0.475). The decline continued into mid-year and reached the $0.275 52-week low on Jun 25. From August the chart re-rated in a series of large up bars: Aug 3 (+10.9% on about 6.7× volume, leaving an unfilled gap at $0.330–$0.345), Aug 6 (gap at $0.395–$0.405), Aug 20 (gap at $0.435–$0.460) and Aug 25 (+12.4%, 3.7×, the 90-day aVWAP anchor). A Sep 30 jump of +13.8% took the close to $0.700.
October then gave back much of that. After a $0.720 close on Oct 16, the shares fell −15.7% on Oct 22 to $0.565, and the chart has no bars for Oct 23 and Oct 26 — on the ASX that pattern is consistent with a trading halt, which is customary around capital raisings, but the price data alone does not confirm the reason. In this period the company placed 164 million shares at A$0.50 (about A$82m), and Genesis Minerals lodged a substantial-holder notice on Nov 3. No takeover proposal has been reported. The swing low close was $0.540 on Nov 2.
The current structure was formed during a sector-wide move. On Nov 5 the ASX gold sector rallied broadly — fifteen gold peers rose between +8.4% and +18.3% while the S&P/ASX 200 gained +2.6% — and BTR's +11.7% to $0.620 took the close back above SMA60. On Nov 9 BTR rose +10.6% to $0.680 on roughly average volume, about twice its peers' move that day, with no catalyst identified; that close cleared SMA20. On Nov 10 (+5.2%, $0.715) SMA5 moved above SMA20 for the SMA5 > SMA20 > SMA60 ordering, the same day MACD crossed up — an ordering that has formed and broken several times over the past year. Price reached $0.740 on Nov 11, then pulled back to $0.655. The Fibonacci swing runs from $0.540 (Nov 2) to $0.740 (Nov 11): the close sits between the 38.2% level ($0.664) and the 50% level ($0.640), with SMA20 ($0.636) just below.
② Volume

BTR_volume-90d-2026-11-15.svgThe heaviest sessions on the 90-day panel are the August re-rating bars (Aug 25 at 36,553,993 shares and Aug 3 at about 6.7× average), Sep 18 (an S&P/ASX index rebalance day, when volume was heavy market-wide) and the late-September run to $0.700 (Sep 28 and Sep 30). The Oct 22 drop and the Oct 27 session after the gap in the data were also above average. The November advance did not come with a volume surge: the Nov 9 and Nov 10 up days traded close to the 20-day average, and the largest November volume was on Nov 6, a near-flat day.
The pullback sessions were also unremarkable in volume terms — 9,829,327 shares on Nov 12 and 6,426,009 on Nov 13, the latter 0.766× the 20-day average of 8,385,985. Across the screened ASX universe the median volume ratio ranged from 0.59× to 1.23× between Oct 26 and Nov 13, so these readings are ordinary rather than a sign of heavy distribution. The flip side is that the advance itself lacked the heavy participation that usually confirms a breakout, and part of it was a sector-wide move rather than demand specific to BTR.
③ MACD

BTR_macd-90d-2026-11-15.svgMACD crossed above its signal line on Nov 10 and now reads 0.0159 against a signal of 0.0078, a histogram of +0.0081. The cross came around the zero line after MACD dipped into negative territory in early November, following the late-October decline, so it is an early-stage turn rather than a mature trend. The two pullback sessions have not undone the cross, though the histogram narrowed on Nov 13; a further slide in price would bring the lines back together quickly given how close they are to zero.
④ RSI

BTR_rsi-90d-2026-11-15.svgRSI(14) is 52.5, back at the midline after the two down days. A bearish divergence is flagged on both frames: price made a higher high, from $0.700 on Sep 30 to $0.740 on Nov 11, while RSI made a lower high, from 77.1 to 64.8 (77.3 and 64.8 on the 90-day frame). The November rally therefore carried less momentum than the September one, even at a higher price. A divergence is a possibility of a top, not a confirmation; it would gain weight if RSI slipped below the mid-40s while price lost SMA20, and would fade if price pushed back through $0.740 with RSI clearing its September reading.
⑤ Mansfield RS

BTR_rs-90d-2026-11-15.svgMansfield RS versus the S&P/ASX 200 is +35.6% (outperform), identical on both frames. It was 29.475% a week ago, so the weekly change is +6.16 points — positive and accelerating — but it was 52.317% a month ago, so the monthly change is −16.68 points: still far above zero, yet well off its October level, and the indicator's slope is flagged "falling". Part of the latest weekly gain reflects the gold sector's broad outperformance on Nov 5 rather than anything specific to BTR, which is worth keeping in mind when reading the RS line as a stock-level signal.
⑥ ATR · ADX

BTR_atr_adx-90d-2026-11-15.svgATR(14) is $0.050, or 7.7% of the share price — high volatility, typical of a sub-dollar resource stock. That puts the 1×ATR reference at $0.605 and the 2×ATR technical invalidation level at $0.555, 15.3% below the close; the wide band is a direct consequence of daily swings of 5–15% in recent weeks. ADX(14) reads 22.3 (22.7 on the 90-day frame), in the 20–25 "trend forming" zone. ADX measures strength rather than direction, and at this level it describes a trend that is not yet established.
⑦ OBV

BTR_obv-90d-2026-11-15.svgOBV is in "distribution" on both frames — below a falling 20-day average, by 26.7% on the two-year frame and 9.96% on the 90-day frame (those figures measure the gap to OBV's own average, not a divergence). A bearish OBV divergence is also flagged on both frames: at the Nov 11 price high OBV stood at 42,605,282 on the two-year count, well below the 74,809,238 peak recorded around the late-September high (102,999,779 versus 135,203,735 on the 90-day count). In other words, the heavy-volume down days of late October removed more volume than the November rally put back. That agrees with the RSI divergence and is the main volume-based caution on this chart.
Bull Case vs Bear Case
Bull Case
- SMA5 > SMA20 > SMA60 since Nov 10, with the close still 3.1% above SMA20 ($0.636)
- Mansfield RS +35.6% versus the S&P/ASX 200, +6.16 points on the week
- MACD golden cross on Nov 10, just above zero
- The pullback came on ordinary volume (Nov 13 at 0.766×) in a market with a normal 0.59–1.23× median ratio
- Price above both aVWAPs ($0.601 short-term and $0.475 long-term)
- Close sits between the 38.2% ($0.664) and 50% ($0.640) retracements of the Nov 2–11 swing
Bear Case
- The SMA60 reclaim came on a sector-wide gold rally day (Nov 5), and the SMA20 reclaim on an unexplained +10.6% day (Nov 9)
- Bearish RSI divergence: $0.700 / 77.1 on Sep 30 vs $0.740 / 64.8 on Nov 11
- OBV in distribution on both frames, with bearish OBV divergence
- Two consecutive down days (−7.4%, −4.4%) straight after the new high; close below SMA5 ($0.695)
- Mansfield RS −16.68 points on the month, slope flagged falling
- ATR 7.7% and ADX 22.3 — a volatile stock without an established trend
Scenarios
| Scenario | Probability | Path | Trigger / Invalidation |
|---|---|---|---|
| Pullback settles near SMA20 | 40% | Price steadies in the $0.636–$0.664 zone (SMA20, 50% and 38.2% retracements) as RSI and MACD reset, then ranges below the $0.740 high | Trigger: closes holding above SMA20 on ordinary volume. The structure stays intact while closes remain above $0.555 (2×ATR) |
| Deeper retracement | 35% | The divergences play out and price slips to the 61.8% retracement ($0.616), SMA60 ($0.608) and the 90-day aVWAP ($0.601) | Trigger: a close below SMA20 ($0.636). A close below $0.555 would move this into invalidation |
| Advance resumes | 25% | Price reclaims SMA5 and the 23.6% level ($0.693) and retests the $0.740 high, with the upper Bollinger Band at $0.763 above | Trigger: a close above $0.740 on above-average volume, ideally with RSI above its September reading. Invalidation: a close back below SMA20 |
Key Levels & Volatility References
| Level | Role | Distance | Basis |
|---|---|---|---|
| $0.740 | Resistance | +13.0% | Nov 11 close — 52-week high and swing high (0% of the swing) |
| $0.693 | Resistance | +5.8% | 23.6% retracement (now above price); SMA5 ($0.695) alongside |
| $0.664 | Resistance | +1.3% | 38.2% retracement of the Nov 2–11 swing (now above price) |
| $0.655 | Current | — | Nov 13, 2026 close |
| $0.640 | Support | −2.3% | 50% retracement; SMA20 / Bollinger mid ($0.636) alongside |
| $0.616 | Support | −5.9% | 61.8% retracement; SMA60 ($0.608), 1×ATR ($0.605) and 90-day aVWAP ($0.601) cluster below |
| $0.555 | Invalidation | −15.3% | 2×ATR technical invalidation level; $0.540 Nov 2 swing low close just beneath |
What to Watch
- SMA20 at $0.636. The pullback's reference line; with the 50% retracement ($0.640) beside it, closes holding here keep the structure intact.
- The gold sector. Part of this structure came from a sector-wide rally on Nov 5; whether BTR keeps its relative strength if the sector cools is the key test of how much of the move is stock-specific.
- The divergences. RSI and OBV both peaked lower at the $0.740 high; RSI slipping into the mid-40s with price below SMA20 would give that warning more weight.
- Volume on the next up day. The November advance came on roughly average volume; a move back above $0.740 would carry more weight on above-average participation.
- The $0.555 level. A daily close below the 2×ATR technical invalidation level would undo the current structure.