ORA Banda Mining
This analysis is based on closing-price data as of August 28, 2026. Whether you're researching ORA Banda Mining (OBM) on the ASX or learning how to read stock charts, here are objective support, resistance and technical invalidation levels built from the RSI, MACD and ATR indicators.
ORA Banda Mining closed Friday at $1.59, 7.6% under the $1.72 52-week high of January 21 and 74.7% above the $0.91 low of early September 2025. The two-year panel frames what the last fortnight is actually doing: after the January peak the gold producer spent five months working lower to a $1.02 close on June 11, then rebuilt in stages through July and August, with a gap higher on August 20 carrying the close from $1.39 to $1.585 in a single session. The advance stopped on August 24 at $1.675 — the same price as the January 28 closing high — and the four sessions since have drifted sideways rather than unwound. The working lens is therefore a retest of an old ceiling, not a fresh breakout: the moving-average stack is in full bullish order, Mansfield RS is +20.9% versus the S&P/ASX 200 and ADX reads 29.3, but the chart also carries a flagged bearish OBV divergence into that August 24 high and an ATR of 5.13% that puts the objective line 10.3% away.
Snapshot as of August 28, 2026
| Item | Value | Reading |
|---|---|---|
| Close | $1.59 | −7.6% from 52w high, +74.7% above 52w low |
| 52-week range | $0.91 – $1.72 | Upper end of the yearly range; the high dates from January 21, 2026 |
| SMA 5 / 20 / 60 | $1.61 / $1.42 / $1.23 | Full bullish alignment, but the close sits 1.1% below SMA5; 12.2% above SMA20 and 29.4% above SMA60 |
| Bollinger (20) | $1.73 / $1.42 / $1.11 | Band width 43.99% — wide after the August expansion; the upper band sits just above the 52-week high |
| aVWAP (2y anchor) | $1.29 (Jan 29, 2026) | Price is 23.5% above the volume-weighted average since the January peak |
| aVWAP (90d anchor) | $1.27 (Jun 11, 2026) | Short-term average price 25.5% below the close, anchored on the June low |
| RSI(14) | 67.1 | Firm but not overbought (2y frame 67.0); no RSI divergence flagged on either frame |
| Mansfield RS (vs the S&P/ASX 200) | +20.9% | Outperforming; +30.42 points over a month from −9.54, but −3.00 points over the past week |
| MACD(12,26) | 0.115 / signal 0.099 | Golden cross of July 22 intact; histogram +0.016 and narrow |
| ADX(14) | 29.3 | Strong directional trend (2y frame 28.8) |
| ATR(14) | $0.082 (5.13%) | Wide daily range — the 2×ATR band spans 10.3% of price |
| OBV | 2y: above MA20, flat (+12.53% spread) · 90d: above MA20, flat (+19.10% spread) | Early accumulation on both frames, but a bearish divergence is flagged on both |
| Volume (last session) | 10,332,547 vs 11,348,347 avg (0.91×) | Slightly below average — well under the August 11 and August 20 spike sessions |
| Unfilled gaps | $1.42 – $1.48 · $1.255 – $1.305 | Two open beneath price (Aug 20, 2026 and Aug 6, 2026) |
| 1×ATR / 2×ATR levels | $1.51 / $1.43 | 2×ATR = technical invalidation level (−10.3% from close) |
① Price & Moving Averages
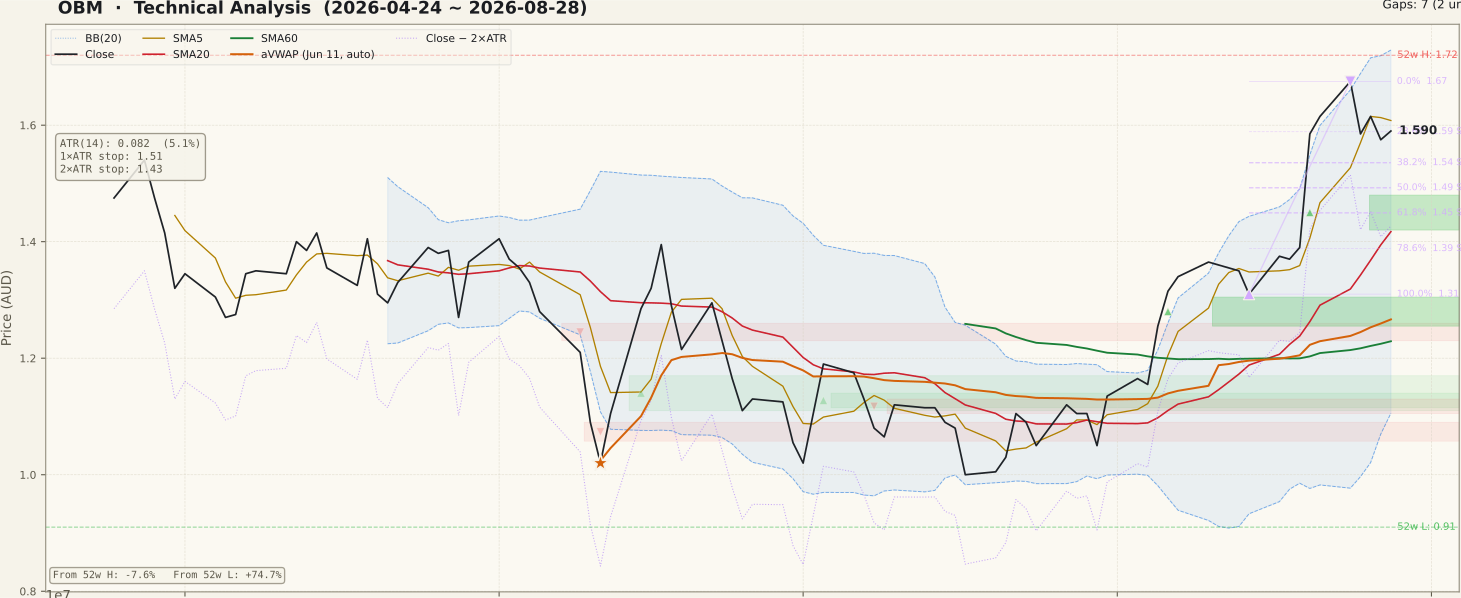
OBM_price-90d-2026-08-30.svgThe stack is in textbook bullish order — SMA5 $1.61 above SMA20 $1.42 above SMA60 $1.23, all three rising — with one qualification the screen flagged directly: the close at $1.59 is 1.1% beneath the fast average rather than above it. That is what a pause looks like while the averages catch up, and it is the difference between a chart that is still extending and one that is digesting. The spacing is the second half of the story: price is 12.2% above SMA20 and 29.4% above SMA60, and the 60-day average itself is close to flat — the detector recorded it rising by only 1.6% — which describes a base that has only recently begun to turn.
The retracement grid is anchored on the August 14 low at $1.31 and the August 24 high at $1.675, an advance of 27.9% in seven sessions. Price has given back 23.3% of that swing, which leaves it fractionally above the 23.6% level at $1.589 — the tightest reference on the chart and the reason the shelf immediately underfoot matters more than anything overhead. Below it the 38.2% level sits at $1.54, the 50% at $1.49 and the 61.8% at $1.45, the last of those falling inside the unfilled August 20 gap at $1.42 – $1.48. That gap, the SMA20 at $1.42 and the 2×ATR line at $1.43 form a dense cluster roughly 10% down.
Overhead the structure is unusually well defined for a stock this far off its lows. The August 24 high of $1.675 is the same closing price as the January 28 peak, so the chart is re-approaching a ceiling it has already failed at once this year; above that sits the $1.72 52-week high from January 21 and then the upper Bollinger band at $1.73. Band width of 43.99% is wide, and with the midline at $1.42 the mean is a long way beneath the last print — an observation about how the August move was built, not a forecast of where it goes.
② Volume

OBM_volume-90d-2026-08-30.svgFriday's turnover of 10,332,547 shares is 0.91× the 20-day average of 11,348,347 — ordinary participation, and notably calm given where price sits in its range. The 90-day panel is dominated by two outliers. On August 11 roughly 60.5 million shares changed hands, more than five times the current average, while the close barely moved ($1.365 to $1.36): the signature of a single large crossing rather than a directional move. On August 20 close to 22.9 million shares — about twice the average — accompanied the gap that carried price from $1.39 to $1.585.
What matters for the current reading is the four sessions since the August 24 high. Turnover through them has run in a narrow band around 8–10 million shares, on both up and down closes, with no single bar approaching the August spikes. Heavy participation on the way down is the usual signature of distribution, and the panel does not show it. The mirror-image caution is equally honest: a push back through $1.675 on turnover near the 20-day average would be much weaker confirmation than the one that created the level, and unverified breakouts on thin volume are among the most common traps on charts of this shape.
③ MACD

OBM_macd-90d-2026-08-30.svgMACD sits at 0.115 against a signal line of 0.099, with the golden cross of July 22 still intact after five weeks. That cross came shortly after the June low, which is the constructive version of the pattern — a crossover initiated from well below zero tends to mark the beginning of a move rather than its exhaustion, and the whole $1.02-to-$1.675 advance has taken place beneath it.
The histogram is the caveat. At +0.016 it is positive but thin relative to the size of the August move, which says the rate of improvement has slowed even though direction has not changed. That is consistent with everything else on this page: the trend is intact, the impulse behind it is fading. A histogram that re-expands as price works back toward $1.675 would resolve the ambiguity constructively; a dead cross would be the first momentum break since July 22 and would most likely coincide with the $1.589 shelf failing.
④ RSI

OBM_rsi-90d-2026-08-30.svgRSI(14) reads 67.1 on the 90-day frame and 67.0 on the two-year frame — firm, directional, and just under the conventional 70 overbought threshold. A reading in the mid-60s after a 27.9% seven-session advance is a reasonably healthy outcome; it means the pullback of the last four sessions has cooled momentum without breaking it.
No RSI divergence is flagged on either timeframe: rsi.divergence is null on both the
90-day and two-year sidecars, and both peak fields are empty. That absence is worth stating plainly
because the OBV panel does carry a flagged divergence — the two oscillators disagree, and
collapsing them into a single verdict would misrepresent the chart. Note also that a high RSI is not
by itself a warning: the level says the recent advance was one-directional, and the more informative
question is whether it can stay above the 50 midline on the next pullback.
⑤ Mansfield Relative Strength

OBM_rs-90d-2026-08-30.svgMansfield RS versus the S&P/ASX 200 stands at +20.9% with a rising slope, and the screen ranks OBM at 88 on relative strength. The monthly comparison is the striking one: a month ago the reading was −9.54, so the stock has gained 30.42 points and crossed the zero line from underperformance into outperformance — the transition that Mansfield's framework treats as the meaningful event, far more than any absolute level.
The weekly comparison qualifies it. A week ago the reading was +23.89, so RS has given back 3.00 points over the past five sessions. In positive territory a negative change is deceleration, not deterioration — the stock is still outrunning the index, just by less than it was — and a give-back of that size after a zero-line crossing is unremarkable. It becomes a different signal if a second week of the same scale follows, because a fresh crossing that fails to hold is a much weaker structure than one that consolidates above zero. The benchmark here is the S&P/ASX 200 throughout; readers should also keep in mind that a gold producer's relative strength frequently tracks the metal rather than anything company-specific.
⑥ ATR & ADX

OBM_atr_adx-90d-2026-08-30.svgADX(14) reads 29.3 on the 90-day frame and 28.8 on the two-year frame, both comfortably in the "strong trend" band above 25. ADX measures the strength of a move and not its direction, so the reading confirms that the June-to-August advance was genuinely directional rather than a drift — and it would read just as high in a decline of similar conviction.
ATR(14) at $0.082 is 5.13% of the closing price, which is high in absolute terms and typical for a sub-$2 ASX gold producer. It sets the objective reference points mechanically: the 1×ATR level is $1.51 and the 2×ATR technical invalidation level is $1.43, or 10.3% below the close. That distance is the single most practical number on this page — a chart with a 5.13% daily range needs roughly a tenth of its value to be given up before the structure is objectively broken, so position sizing rather than level selection does most of the risk work here. Note also that ASX small and mid caps routinely enter trading halts around capital raisings and drilling announcements, so a gap through any of these references without warning is a normal feature of this market rather than an anomaly.
⑦ OBV

OBM_obv-90d-2026-08-30.svgBoth frames tag OBV the same way: early accumulation, above the 20-day average, with a flat slope. The spread between OBV and its own average is 19.10% on the 90-day frame and 12.53% on the two-year frame. That measures the intensity of accumulation relative to the recent norm — it is not a divergence reading, despite the similar name, and the two should not be conflated.
The divergence itself is flagged separately, and it is bearish on both frames. On the 90-day panel the two marked peaks are July 22 at $1.105 with OBV at −64,874,653 and August 24 at $1.675 with OBV at −66,323,514: price made a substantially higher high while OBV made a lower one. The two-year panel marks the same August 24 peak against August 10, when price closed at $1.365 with OBV at 169,025,152 versus 140,591,027 at the high — again a higher price high against a lower volume high. (The two frames report OBV on different cumulative bases, so the signs differ; only the direction between marked peaks is comparable.)
This is the genuine tension in the chart, and it deserves precision rather than a verdict. A bearish divergence describes volume failing to confirm the newest price high — it raises the probability of a top, it does not establish one, and the same tag has appeared many times inside advances that continued. It is also not in conflict with the accumulation state: OBV can sit above a rising average on the medium horizon while lagging on the most recent leg. Declaring the top early is the classic misreading here. What converts the divergence from a caution into a confirmed reversal is price action — losing the $1.589 shelf and then the $1.54 level — and until that happens the flag is an argument for a smaller assumption of continuation, not for an opposite one.
Bull vs Bear
Bull Case
- Mansfield RS +20.9% vs the S&P/ASX 200 with a rising slope, up 30.42 points in a month from −9.54 — a fresh zero-line crossing.
- Full bullish alignment of the averages: SMA5 $1.61 > SMA20 $1.42 > SMA60 $1.23, all rising, with the close only 1.1% under SMA5.
- The July 22 MACD golden cross, made from well below zero, has survived the entire $1.02–$1.675 advance; the histogram is still positive at +0.016.
- ADX 29.3 confirms the June-to-August move was strongly directional rather than drift.
- The pullback has retraced only 23.3% of the $1.31–$1.675 swing over four sessions, on turnover below the 20-day average — no heavy-volume distribution.
- SMA60 is a flat base turning up (+1.6%), and price is 25.5% above the 90-day anchored VWAP of $1.27 — recent participants are in profit, which reduces overhead supply.
Bear Case
- Bearish OBV divergence flagged on both frames — price $1.105 → $1.675 between the marked peaks while OBV fell from −64.87M to −66.32M on the 90-day panel.
- ATR 5.13% of price puts the 2×ATR technical invalidation level 10.3% below the close — an unusually wide objective band.
- The August 24 high of $1.675 is the same price as the January 28 closing high; the chart has already failed at this ceiling once in 2026.
- RS weekly change −3.00 points, from +23.89 — the crossing above zero is only weeks old and is already decelerating.
- The close is 1.1% below SMA5 and the MACD histogram at +0.016 is thin — momentum has flattened even though direction has not turned.
- Two unfilled gaps sit beneath at $1.42–$1.48 and $1.255–$1.305, and price is 12.2% above SMA20 with band width at 43.99% — the mean is a long way down.
Scenarios
| Scenario | Probability | Path | Trigger / Invalidation |
|---|---|---|---|
| Shelf holds, the January ceiling is retested | 40% | The pause resolves above the 23.6% retracement at $1.589. The rising SMA5 at $1.61 is reclaimed, the MACD histogram re-expands, and price works back to the August 24 high at $1.675 — the January 28 closing high — with the $1.72 52-week high and the $1.73 upper Bollinger band immediately above. RS holds above zero and the OBV divergence resolves by volume catching up rather than by price rolling over. | Daily closes above $1.589 keep this framing; a reclaim of $1.61 and then $1.675 on above-average volume confirms it. A close below $1.54 argues for the second path. |
| Deeper retracement into the August gap | 35% | The $1.589 shelf gives way and price works down through the 38.2% level at $1.54 and the 50% at $1.49 into the unfilled August 20 gap at $1.42–$1.48, where the 61.8% retracement at $1.45 also sits. Filling a gap of that age is ordinary behaviour and would not by itself end the June–August structure, which stays intact above the $1.31 August low. | A daily close below $1.54 opens this path; sustained closes back above $1.589 close it. |
| The August structure unwinds | 25% | Price closes beneath the $1.43 technical invalidation level and through the SMA20 and Bollinger midline at $1.42, which sits inside the same gap band. The next references are the 78.6% retracement at $1.39, the August 14 swing low at $1.31 and the second unfilled gap at $1.255–$1.305. MACD prints its first dead cross since July 22, RS retraces toward zero, and the bearish OBV divergence reads as confirmed rather than pending. | A daily close below $1.43 triggers this reading; a close back above $1.54 negates it. |
Key Levels & Volatility References
| Price | Role | Basis |
|---|---|---|
| $1.72 – $1.73 | Resistance | 52-week high $1.72 (January 21, 2026 session) and the upper Bollinger band $1.73 — band width 43.99% |
| $1.675 | Resistance | August 24, 2026 swing high — 0% of the current swing; the same price as the January 28, 2026 closing high |
| $1.61 | Resistance | SMA5, rising — the close sits 1.1% beneath it |
| $1.59 | Current | Close, August 28, 2026 |
| $1.589 | Support | 23.6% retracement of the $1.31–$1.675 swing (Aug 14 – Aug 24); 23.3% has been given back so far |
| $1.54 | Support | 38.2% retracement; the 50% level follows at $1.49 and the 61.8% at $1.45 |
| $1.43 | Invalidation | 2×ATR technical invalidation level (−10.3% from close), inside the unfilled August 20 gap $1.42–$1.48, with SMA20 $1.42 just beneath; the 1×ATR reference is $1.51 |
What to Watch
- The $1.589 shelf and SMA5 at $1.61. The close is wedged between them, 1.1% under the fast average and fractionally above the 23.6% retracement. This is the tightest decision zone on the chart: closes that stay above $1.589 keep the pause orderly, while a close under $1.54 turns it into a genuine retracement.
- Whether the bearish OBV divergence gets confirmed or dissolved. The flag is on both frames, marked at the August 24 high. Volume expanding on a push back through $1.675 would dissolve it; price losing $1.589 on rising turnover would confirm it. Until one of those happens the divergence is a caution and not a reversal.
- The $1.675 ceiling on the second attempt. It is the January 28 closing high as well as the August peak, and a level that has rejected price once carries more weight than a fresh one. The quality of any retest — volume against the 20-day average of 11.3 million — matters more than the touch itself.
- The slope of Mansfield RS, not its level. The zero-line crossing is only weeks old and RS has already given back 3.00 points in a week from +23.89. A second week of that size would matter far more than the still-solid +20.9% reading.
- The $1.42–$1.48 cluster. The unfilled August 20 gap, the SMA20 and Bollinger midline at $1.42, the 61.8% retracement at $1.45 and the 2×ATR line at $1.43 all sit within six cents of each other. It is the structural floor of the August advance, and how price behaves on a first visit there would say more than anything happening at the highs.