Ansell
This analysis is based on closing-price data as of August 21, 2026. Whether you're researching Ansell (ANN) on the ASX or learning how to read stock charts, here are objective support, resistance and technical invalidation levels built from the RSI, MACD and ATR indicators.
Ansell closed Friday at $34.90, 7.0% below the $37.54 52-week high and 39.3% above the $25.05 low printed in May. The two-year panel explains why the recovery matters: price fell for most of the first half of 2026, bottomed in May, and has since run back through the July 6 swing high at $32.55 — the anchor of the two-year retracement grid — with Mansfield RS crossing above zero to +5.5% against the S&P/ASX 200 and ADX at 51.5. What the 90-day panel adds is a first crack in that advance. The August 19 high at $35.62 came with RSI lower than at the July 29 high, MACD printed a dead cross on Friday itself, and the close slipped under SMA5 $35.25 on the heaviest turnover in more than three weeks. The working lens is a strong recovery trend meeting its first credible momentum warning, with the retracement so far only 16.1% of the July–August leg.
Snapshot as of August 21, 2026
| Item | Value | Reading |
|---|---|---|
| Close | $34.90 | −7.0% from 52w high, +39.3% above 52w low |
| 52-week range | $25.05 – $37.54 | Upper half of the yearly range, but not yet at the high |
| SMA 5 / 20 / 60 | $35.25 / $34.32 / $31.75 | Close is 1.0% below SMA5, 1.7% above SMA20 and 9.9% above SMA60 |
| Bollinger (20) | $36.31 / $34.32 / $32.32 | Band width 11.61% — moderate; close sits between the midline and the upper band |
| aVWAP (2y anchor) | $31.38 (Apr 3, 2025) | Price is 11.2% above the two-year cost basis |
| aVWAP (90d anchor) | $31.60 (May 29, 2026) | Short-term cost basis 10.4% below price and rising |
| RSI(14) | 61.9 | Neutral-to-firm (2y frame 61.8) — but a regular bearish divergence is flagged |
| Mansfield RS (vs the S&P/ASX 200) | +5.5% | Outperforming; +5.37 points over a month, −1.02 points over the past week |
| MACD(12,26) | 0.911 / signal 0.956 | Dead cross printed August 21; histogram −0.045, the first negative reading of this leg |
| ADX(14) | 51.5 | Strong directional trend (2y frame 50.6) |
| ATR(14) | $0.647 (1.85%) | Low daily range for an ASX mid cap — the 2×ATR band is only 3.7% wide |
| OBV | 2y: above MA20, flat (+0.2%) · 90d: above MA20, rising (+0.1%) | Accumulation on the 90-day frame, early accumulation and flat on the two-year frame |
| Volume (last session) | 698,442 vs 363,880 avg (1.92×) | Heaviest session since July 27 — and it was a down close |
| Unfilled gaps | None on either frame | No open gap acts as a magnet above or below price |
| 1×ATR / 2×ATR levels | $34.25 / $33.61 | 2×ATR = technical invalidation level (−3.7% from close) |
① Price & Moving Averages
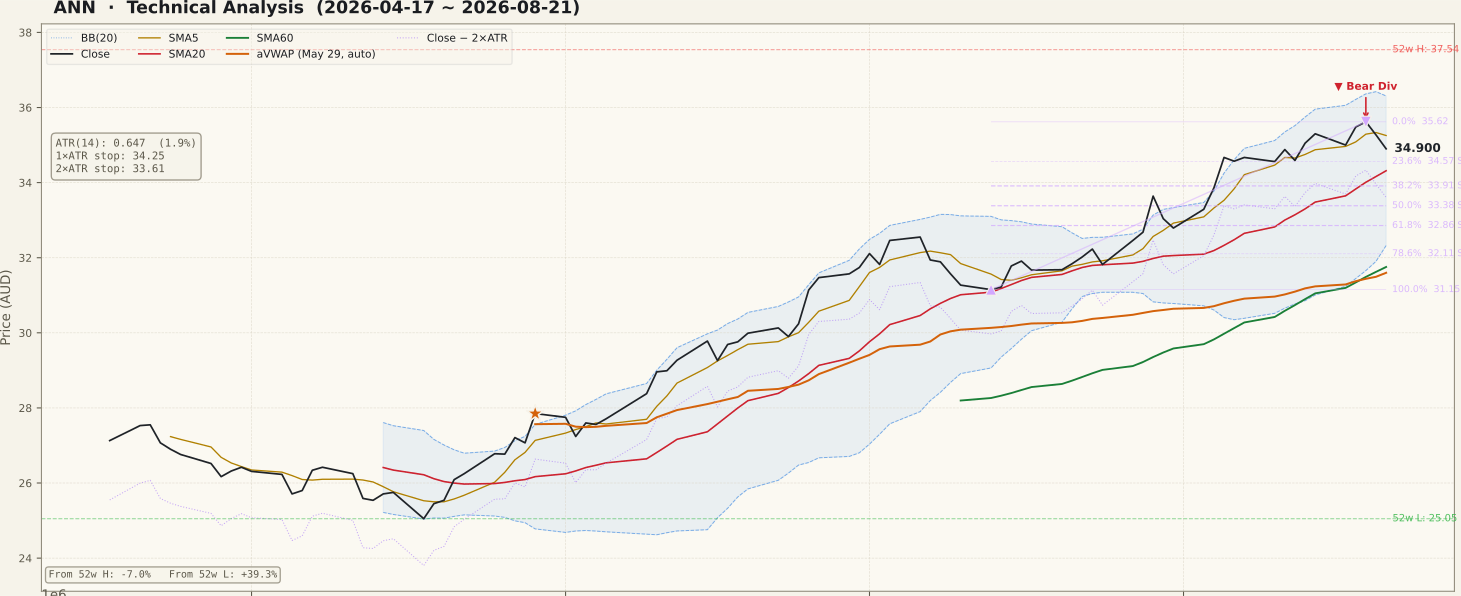
ANN_price-90d-2026-08-23.svgThe longer averages remain in bullish order — close $34.90 above SMA20 $34.32 above SMA60 $31.75 — and the 90-day panel shows all three rising in parallel since late May. The break in that pattern is at the front of the stack: SMA5 sits at $35.25, and Friday's close is 1.0% beneath it, a second consecutive close under the fast average after a run that carried price from $31.15 on July 13 to $35.62 on August 19, a gain of 14.3%.
The retracement grid on the 90-day frame is anchored to exactly that swing. Price has given back 16.1% of it, so it has not yet reached the first retracement shelf at $34.57 (23.6%), below which the 38.2% level at $33.91 and the 50% level at $33.39 sit close together. Bollinger structure is unremarkable by comparison: width 11.61% is moderate, the upper band is at $36.31 and the midline coincides with SMA20 at $34.32, which makes that number the single most-watched reference on the chart.
Two-year context is worth holding alongside this. The May low at $25.05 ended a six-month decline, and the advance since has already cleared the July 6 swing high at $32.55 that anchors the two-year retracement set — that grid is now behind price and no longer describes the live structure. What still sits overhead is the $37.54 52-week high made in the late-2025 advance, 7.0% away, and the price shelf between roughly $34 and $37 that the chart worked through repeatedly in 2025.
② Volume

ANN_volume-90d-2026-08-23.svgFriday's turnover of 698,442 shares against a 20-day average of 363,880 is 1.92× normal, the heaviest single session since July 27 — and it printed on a down close, not on the August 19 high. That is the least constructive place for a volume expansion to appear.
Set against the rest of the leg, however, the reading is not yet damning. The 90-day panel flags only three spike sessions (bars at or above twice the 20-day average) across the whole window, and none of them came in August; the advance from mid-July into mid-August was carried on participation that mostly sat at or below the 20-day average line. Volume that expands on one down day is a single data point. Volume that expands on two or three consecutive down days is a pattern, and the chart does not yet show one.
③ MACD

ANN_macd-90d-2026-08-23.svgMACD reads 0.911 against a signal line of 0.956, with the histogram at −0.045 and a dead cross dated August 21 — the last session in the data set. It is as fresh as a signal can be, which cuts both ways: there is no follow-through to judge it by.
Two features temper the reading. The cross occurred at a MACD value well above zero, which is the signature of a pause inside an uptrend rather than of a trend reversal; crosses that matter most tend to happen near or below the zero line. And the 90-day panel shows this is the second dead cross of the same advance — the first, in early July, was followed by a golden cross in late July and a further leg higher. A histogram that stays shallow and turns back up would mark this one the same way; a histogram that deepens through the coming week would not.
④ RSI

ANN_rsi-90d-2026-08-23.svgRSI(14) at 61.9 on the 90-day frame (61.8 on the two-year frame) is firm but nowhere near an extreme — it has come off the overbought band it occupied through late July and mid-August. The signal here is not the level but the shape.
A regular bearish divergence is flagged on both frames, and the two peaks are specific: July 29, price $33.64 at RSI 74.61; August 19, price $35.62 at RSI 73.34. Price made a high 5.9% above the earlier one while momentum made a lower high. That is the textbook configuration, and it is the strongest single bear argument on this chart.
The standing caution applies with full force: a divergence is a warning that the rate of advance is slowing, not a confirmation that a top is in place. Divergences of this kind resolve upward as often as they resolve downward, and this one is unconfirmed — price has retraced only 16.1% of the swing and still holds above SMA20. A move back above $35.62 would cancel the structure outright.
⑤ Mansfield RS vs the S&P/ASX 200

ANN_rs-90d-2026-08-23.svgMansfield RS sits at +5.5% versus the S&P/ASX 200, in outperformance territory with a rising slope. The 90-day panel shows how recent that is: RS spent most of the window deep in negative ground near −19%, crossed zero in late July, and has held above it since. A month ago the reading was +0.12, so the monthly change is +5.37 points — genuine acceleration from a zero-line crossing.
The weekly picture is the opposite. A week ago RS stood at +6.51, so the seven-day change is −1.02 points. In positive territory a negative change is deceleration, not deterioration — the stock is still beating the index, just by less than it was. The distinction matters because the two-year panel shows Ansell spent most of 2026 below zero; a single week of give-back after a month of gains is normal, while a return through zero would undo the leadership case the recovery has been built on.
⑥ ATR & ADX

ANN_atr_adx-90d-2026-08-23.svgADX at 51.5 on the 90-day frame (50.6 on the two-year frame) is a high reading by any standard and has been climbing since June. ADX measures trend strength without regard to direction, so the number describes how orderly the move has been rather than guaranteeing where it goes next — and a very high ADX is also the reading that most often precedes a consolidation, simply because the trend has already spent much of its energy.
ATR(14) at $0.647, or 1.85% of price, is low, and the 90-day panel shows it flat to slightly higher through August. That has a practical consequence for the level structure: the 2×ATR technical invalidation level at $33.61 sits only 3.7% below the close, tighter than on most ASX mid caps. A quiet tape makes the objective line close, which is useful for defining risk and unforgiving of ordinary noise. Median daily turnover comfortably exceeds the screen's A$2M floor, so volume and OBV readings here carry more weight than they would on a thin small cap.
⑦ OBV

ANN_obv-90d-2026-08-23.svgThe two frames disagree in an instructive way. On the 90-day frame OBV is tagged accumulation, above its 20-day average and rising, with the spread a slim +0.1%. On the two-year frame the tag is early accumulation: still above the average, spread +0.2%, but with a flat slope.
Both spreads are narrow enough that the tags describe direction rather than conviction. The two-year panel puts that in context — OBV spent the first half of 2026 falling and only crossed back above its average in June, so the current reading is a young recovery rather than an established base of demand. What the panel does not show is negative divergence: OBV made its highs alongside price into mid-August rather than lagging them, which is the constructive half of an otherwise cautious set of momentum readings.
Bull vs Bear
Bull Case
- Mansfield RS +5.5% vs the S&P/ASX 200 after most of 2026 below zero — +5.37 points over the past month.
- Bullish order intact on the structural averages: close $34.90 > SMA20 $34.32 > SMA60 $31.75, all rising.
- ADX 51.5 — the July–August leg from $31.15 to $35.62 (+14.3%) has been unusually orderly.
- Price is 11.2% above the two-year anchored VWAP $31.38 and 10.4% above the 90-day anchored VWAP $31.60.
- OBV above its 20-day average on both frames and rising on the 90-day frame, with no negative divergence against the August high.
- No unfilled gaps on either frame, and the July 6 two-year swing high at $32.55 has already been cleared — nothing open is pulling price down.
Bear Case
- Regular bearish RSI divergence: July 29 high $33.64 at RSI 74.61 versus August 19 high $35.62 at RSI 73.34 — a higher price high on lower momentum.
- MACD dead cross printed on August 21 itself, histogram −0.045, the first negative reading of this leg.
- The close sits beneath SMA5 at $35.25 for a second consecutive session, after two weeks in which the fast average was given up only once.
- The heaviest turnover since July 27 (1.92× average) arrived on a down session rather than on the August 19 high.
- RS weekly change −1.02 points — still positive, but decelerating from +6.51 a week ago.
- Price is 7.0% below the $37.54 52-week high, and on the two-year frame OBV is only flat (early accumulation) rather than confirming.
Scenarios
| Scenario | Probability | Path | Trigger / Invalidation |
|---|---|---|---|
| Shallow pause, trend resumes | 45% | The retracement stalls in the $34.57–$34.32 band, where the 23.6% level and the SMA20 / Bollinger midline overlap. The MACD histogram turns back up without deepening, RSI unwinds through sideways time, and price presses the August 19 high at $35.62 and then the upper band at $36.31. | Daily closes above $34.32 keep this framing; a reclaim of $35.25 and then $35.62 confirms it. A close beneath $34.32 argues for the second path. |
| Divergence resolves through price | 40% | The bearish divergence is worked off with a deeper retracement. Price loses the SMA20 / midline at $34.32 and trades into the 38.2%–50% band at $33.91–$33.39, where the 2×ATR technical invalidation level at $33.61 also sits. The larger recovery structure survives so long as price stays above the 61.8% level at $32.86 and the rising SMA60 at $31.75. | A daily close below $34.32 opens this path; a close back above $35.25 closes it. Watch whether the retracement arrives on expanding or contracting volume. |
| Recovery leg breaks down | 15% | Price closes beneath the $33.61 2×ATR technical invalidation level and continues into the 61.8%–78.6% zone at $32.86–$32.11, with the July 6 swing high at $32.55, the 90-day anchored VWAP at $31.60 and SMA60 at $31.75 clustered just below. Mansfield RS returns toward zero and the leadership reading is lost. | A daily close below $33.61 triggers this reading; sustained closes back above $34.32 negate it. |
Key Levels & Volatility References
| Price | Role | Basis |
|---|---|---|
| $36.31 | Resistance | Upper Bollinger band (20, 2σ) — band width 11.61% |
| $35.62 | Resistance | August 19, 2026 swing high — 0% of the current 90-day swing; the divergence peak |
| $34.90 | Current | Close, August 21, 2026 — 16.1% retraced from the $35.62 high |
| $34.57 | Support | 23.6% retracement of the $31.15–$35.62 swing (Jul 13 – Aug 19) |
| $34.32 | Support | SMA20 and Bollinger midline — the two coincide exactly |
| $33.91 | Support | 38.2% retracement of the same swing |
| $33.61 | Invalidation | 2×ATR technical invalidation level (−3.7% from close); the 1×ATR reference sits at $34.25 |
What to Watch
- The $34.57–$34.32 band. The 23.6% retracement and the SMA20 / Bollinger midline sit within 0.7% of each other, and price has not yet reached either. Daily closes above that band keep the pause reading intact; a close beneath it says the divergence is being resolved through price rather than time.
- Whether the August 21 dead cross follows through. The histogram is at −0.045, barely negative, and the cross printed above zero. A shallow histogram that turns back up marks it as noise inside a strong trend; one that deepens through the coming week does not.
- Repeat heavy volume on down days. Friday's 1.92× session was the heaviest since July 27 and it closed lower. One such day near a high is ambiguous; a second and third in sequence are the clearest evidence available that supply is being met.
- The slope of Mansfield RS. The weekly change is −1.02 points from +6.51. A second week of decline while price holds up would be the earliest sign the leadership change that began in late July is unwinding.
- The $35.62 high. Reclaiming it cancels the bearish divergence structure outright and puts the $36.31 band top and the $37.54 52-week high back in view.