Yancoal Australia
This analysis is based on closing-price data as of October 23, 2026. Whether you're researching Yancoal Australia (YAL) on the ASX or learning how to read stock charts, here are objective support, resistance and technical invalidation levels built from the RSI, MACD and ATR indicators.
Yancoal Australia closed at $6.02 on October 23, the end of a three-session pullback from the Oct 19 close of $6.29 — a 20-session closing high set on 1.7× average volume in the window of the company's September-quarter production report. The pullback stopped at $5.88 on Oct 22, inside the cluster formed by SMA20 ($5.89), SMA60 ($5.92) and the 61.8% retracement of the Oct 1 – Oct 19 swing ($5.86), and price closed back above SMA60 on Oct 23. The two-year picture is less constructive: after a March–April 2026 spike to a $9.06 high, the stock has moved sideways in a roughly $5.40–$6.50 range since late July, still 33.6% below that high and below its two-year anchored VWAP ($6.25), with ADX at 18.3 and Mansfield RS negative but improving.
Snapshot as of October 23, 2026
| Item | Value | Reading |
|---|---|---|
| Close | $6.02 | −33.6% from 52w high · +26.5% from 52w low |
| 52-week range | $4.76 – $9.06 | Close in the lower-middle of the range; the high is from the March–April 2026 spike |
| SMA 5 / 20 / 60 | $6.02 / $5.89 / $5.92 | Not aligned: SMA5 > SMA60 > SMA20. The SMA5 > SMA20 > SMA60 ordering formed on Aug 31 and broke on Sep 18. Close sits fractionally under SMA5 ($6.024) and above SMA20 and SMA60 |
| Bollinger (20) | $6.20 / $5.89 / $5.58 | Band width 10.58%; close in the upper half of the band, below the upper band |
| aVWAP (2y anchor Aug 20, 2025) | $6.25 | Price below the long-term anchored average — overhead supply on the two-year frame |
| aVWAP (90d anchor Aug 20, 2026) | $5.99 | Price just above the short-term anchored average |
| RSI(14) | 52.8 | Neutral, just above 50; no RSI divergence flagged |
| Mansfield RS (vs the S&P/ASX 200) | −1.71% | Underperforming but rising: +1.01 points on the week and +3.65 on the month (negative, improving) |
| MACD (12,26,9) | 0.0244 / 0.0107 / +0.0138 | Golden cross on Oct 9 (90d frame; Oct 8 on the 2y frame), now just above the zero line |
| ADX(14) | 18.8 | Ranging (18.3 on the two-year frame) — no established trend |
| ATR(14) | $0.245 (4.1%) | 2×ATR spans about 8.2% of the share price |
| OBV (2y / 90d) | early accumulation / accumulation | Above MA20 on both frames (flat on 2y, rising on 90d); bullish OBV divergence on the 90-day frame |
| Volume vs 20d avg | 1.255× | 3,810,199 shares against a 3,035,054 average, on a day when market-wide volume was in its normal range |
| 1×ATR / 2×ATR technical invalidation | $5.775 / $5.53 | Volatility-based structural reference levels below the close |
① Price & Moving Averages
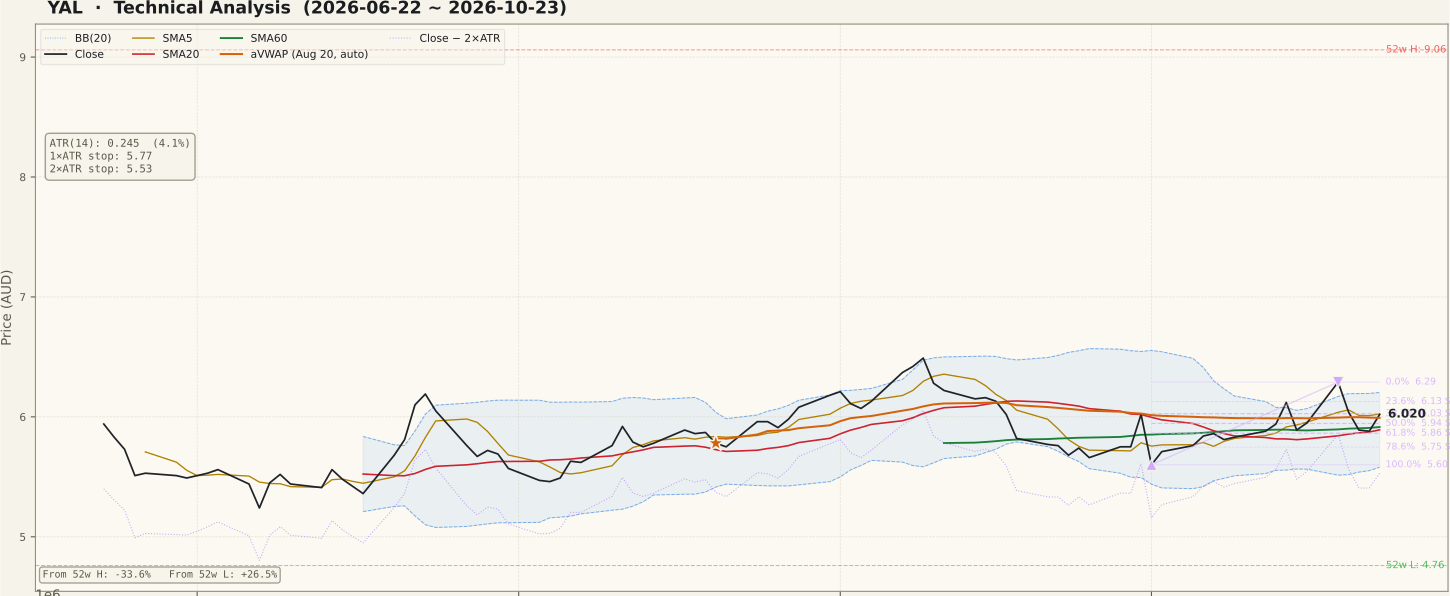
YAL_price-90d-2026-10-25.svgOn the two-year chart, Yancoal spent most of 2025 between roughly $4.70 and $6.70, then spiked in March–April 2026 to a $9.06 high before giving the move back through May–July. Since late July the price has moved sideways between about $5.40 and $6.50, and both SMA20 and SMA60 have flattened into that range. The 90-day chart shows the recent swing: a −7.0% drop to $5.60 on Oct 1, a recovery that put the close back above SMA20 on Oct 12 and above SMA60 on Oct 13, and a run to $6.29 on Oct 19. The following three sessions retraced to $5.88, briefly losing SMA60 on Oct 21; on Oct 23 the bar traded as low as $5.68 intraday before closing at $6.02, back above SMA60. The two-year anchored VWAP at $6.25 and the Oct 19 high at $6.29 form the overhead band; one unfilled gap remains further up at $7.89–$8.11 (Apr 8, 2026).
② Volume

YAL_volume-90d-2026-10-25.svgThe Oct 23 session traded 1.255× its 20-day average. The Oct 19 advance (+5.71%) came on about 1.7× average volume — roughly 2.15× after adjusting for market-wide activity — and it fell in the window of Yancoal's September-quarter production and sales report. That is a clear pickup in participation but well short of the event-scale readings (8% moves on 3× volume) that would mark a single-bar news reaction. The weaker detail is that the Oct 20 decline (−3.97%) traded slightly more shares than the Oct 19 advance, so the pullback was not on light volume at its start. Market-wide volume across Oct 19–23 sat in a normal 0.79–1.03× band, so these readings are not inflated by a broad-market event.
③ MACD

YAL_macd-90d-2026-10-25.svgMACD crossed above its signal line on Oct 9 on the 90-day frame (Oct 8 on the two-year frame, a small warm-up difference between the two calculations) from below the zero line, and both lines are now slightly positive (MACD 0.0244, signal 0.0107). The histogram, at +0.0138, has flattened over the pullback rather than turning negative — momentum eased but the cross was not undone. Values this close to zero describe a market that has moved from mild downside momentum to neutral, not one with strong upside momentum.
④ RSI

YAL_rsi-90d-2026-10-25.svgRSI(14) is 52.8 — neutral, just above the 50 midline. It peaked near the low 60s at the Oct 19 high and eased back below 50 during the pullback before turning up again on Oct 23. The reading leaves room in both directions and is far from overbought. No RSI divergence is flagged in the data, so the indicator neither confirms nor contradicts the recent swing.
⑤ Mansfield Relative Strength

YAL_rs-90d-2026-10-25.svgMansfield RS vs the S&P/ASX 200 is −1.71%: the stock is still underperforming the index, but the line is rising. A week ago it was −2.72 and a month ago −5.36, so the change is +1.01 points on the week and +3.65 on the month — negative territory, improving toward zero. The 90-day panel shows RS touching or briefly crossing zero in mid-October and again around Oct 19 without staying there. A sustained move above zero would mark outright outperformance; until then the relative trend is "less weak" rather than strong.
⑥ ATR & ADX

YAL_atr_adx-90d-2026-10-25.svgATR(14) is $0.245, or 4.1% of the share price, and it has risen sharply through October from a low near $0.20 — the daily ranges around the Oct 19 swing are wider than anything seen since August. ADX is 18.8 on the 90-day frame (18.3 on two years), below the 20 threshold: the chart is ranging, with no established trend. Rising volatility inside a trendless market means wider swings in both directions; the 2×ATR technical invalidation level at $5.53 sits about 8.2% below the close for that reason.
⑦ OBV

YAL_obv-90d-2026-10-25.svgOn the 90-day frame OBV is in accumulation — above its MA20 and rising, with the gap to the MA20 at +25.52% (+22.89% on the two-year frame, where the state is early accumulation with a flat slope). These percentages measure distance from the moving average, not divergence. Separately, the data flags a bullish OBV divergence: price made a lower low from $6.07 on Sep 3 to $5.88 on Oct 22, while OBV made a higher low (−15,181,758 to −14,315,125). That suggests volume flow held up better than price through the pullback — a possible sign of a turn, not a confirmed one. No OBV divergence is flagged on the two-year frame.
Bull Case vs Bear Case
Bull Case
- The pullback from $6.29 stopped at $5.88, inside the SMA20 / SMA60 / 61.8% retracement cluster ($5.86–$5.92)
- Close back above SMA60 on Oct 23 after an intraday low of $5.68, on 1.255× average volume
- Bullish OBV divergence on the 90-day frame (Sep 3 vs Oct 22); OBV above MA20 on both frames
- MACD golden cross (Oct 9) still intact through the pullback, both lines above zero
- Mansfield RS improving: +1.01 points on the week, +3.65 on the month
- Oct 19 20-session closing high came on about 1.7× volume (about 2.15× market-adjusted), with RSI still neutral at 52.8
Bear Case
- Mansfield RS still negative (−1.71%) — not yet outperforming the S&P/ASX 200
- ADX 18.8 — ranging; no trend strength behind the swing
- Moving averages not aligned since Sep 18; SMA20 still below SMA60
- Price below the two-year anchored VWAP ($6.25) and 33.6% under the 52-week high
- The Oct 19 advance gave back most of its gain over the next three sessions, with the Oct 20 decline on slightly higher volume than the advance
- ATR rising (4.1% of price) — wider daily swings in a trendless market
Scenarios
| Scenario | Probability | Path | Trigger / Invalidation |
|---|---|---|---|
| Pullback resolves higher through the range top | 30% | The $5.89–$5.92 moving-average cluster acts as a floor, and price works back through the $6.25 two-year aVWAP and the $6.29 Oct 19 high toward the upper part of the range near $6.50 | Trigger: daily closes above $6.29 on above-average volume, with Mansfield RS moving above zero. Invalidation: a close back below SMA20 ($5.89) |
| Range continues between $5.60 and $6.29 | 45% | Price oscillates around the flat SMA20 / SMA60 with ADX staying under 20, as it has for most of the past four months | Trigger: ADX remains below 20 and closes stay between the Oct 1 low ($5.60) and the Oct 19 high ($6.29) |
| Pullback extends below the swing low | 25% | The moving-average cluster gives way and price returns to the $5.60 Oct 1 low, then the $5.53 2×ATR level | Trigger: a daily close below $5.60. Invalidation of the swing structure: a close below $5.53 |
Key Levels & Volatility References
| Level | Role | Distance | Basis |
|---|---|---|---|
| $6.29 | Resistance | +4.5% | Oct 19 close — 20-session closing high and the 0% anchor of the Oct 1 – Oct 19 swing |
| $6.25 | Resistance | +3.8% | Two-year aVWAP (anchor Aug 20, 2025); upper Bollinger Band $6.20 just below |
| $6.02 | Current | — | Oct 23, 2026 close; the 38.2% retracement of the Oct 1 – Oct 19 swing ($6.03) sits at the price |
| $5.99 | Support | −0.5% | 90-day aVWAP (anchor Aug 20, 2026) |
| $5.92 | Support | −1.7% | SMA60, with SMA20 ($5.89), the 50% retracement ($5.94) and the 61.8% retracement ($5.86) clustered |
| $5.60 | Support | −7.0% | Oct 1 close — swing low and 100% anchor of the Oct 1 – Oct 19 swing |
| $5.53 | Invalidation | −8.2% | 2×ATR technical invalidation level |
What to Watch
- The $5.89–$5.92 cluster. SMA20 and SMA60 stopped the pullback on Oct 22–23. Closes back below it would turn the pullback into a test of the $5.60 swing low.
- The $6.25–$6.29 band. The two-year anchored VWAP and the Oct 19 high sit together overhead; closes above them on above-average volume would carry the price to the top half of the four-month range.
- Mansfield RS crossing zero. At −1.71% and improving, a sustained move above zero would mark outperformance versus the S&P/ASX 200 rather than just less underperformance.
- ADX through 20. At 18.8 the chart is still ranging; a rising ADX would show the swing gaining persistence.
- The $5.53 level. A daily close below the 2×ATR technical invalidation level would undo the October swing structure.