Webbeds Group
This analysis is based on closing-price data as of September 4, 2026. Whether you're researching Webbeds Group (WEB) on the ASX or learning how to read stock charts, here are objective support, resistance and technical invalidation levels built from the RSI, MACD and ATR indicators.
Webbeds Group closed the week at $3.70, some 26.6% under the $5.04 52-week high of December 19, 2025 and 70.5% above the $2.17 low of May 20, 2026. The two-year frame is a de-rating followed by a repair: the stock traded above $7.00 in September 2024, spent 2025 oscillating in a broad $4.00-to-$5.00 band, then broke that structure on February 6, 2026 with a session that opened at $3.80 against a $4.20 previous close, traded as low as $2.47 and finished 29.5% lower at $2.96 on 33,594,840 shares. Price bottomed at the May low and has been rebuilding since mid-July, running from the $2.35 close of July 20 to $3.88 on September 1 — a 65.1% advance over 32 sessions that has carried Mansfield relative strength versus the S&P/ASX 200 back above zero to +1.9% and pushed ADX to 44.1. The last three sessions are the reason this chart reads as a pullback rather than a breakout: price is 1.28% back under its SMA5, MACD registered a dead cross on September 2, and the RSI panel carries a recorded bearish divergence between the August 3 and September 1 peaks. Everything below is measured against an ATR of 4.005% of price.
Snapshot as of September 4, 2026
| Item | Value | Reading |
|---|---|---|
| Close | $3.70 | −26.6% from 52w high · +70.5% from 52w low |
| 52-week range | $2.17 – $5.04 | Mid-range: the recovery has retraced a little over half of the December-to-May decline |
| SMA 5 / 20 / 60 | $3.75 / $3.63 / $3.13 | Close is 1.28% below the SMA5 but 1.94% above the SMA20 and 18.03% above the SMA60 — the medium-term order is upward, the fastest average has been lost |
| Bollinger (20) | $3.89 / $3.63 / $3.37 | Band width 14.37%; price sits between the mid band and the upper band, 5.14% below the upper edge |
| aVWAP (2y anchor Feb 6, 2026) | $2.94 | Price 26.06% above — average positioning since the February break is well onside |
| aVWAP (90d anchor Jul 28, 2026) | $3.50 | Price 5.57% above — positioning since the late-July gap session is onside |
| RSI(14) | 59.8 (90d) / 59.7 (2y) | Neutral-to-firm, unwound from the July–August highs; bearish divergence recorded on both frames |
| Mansfield RS (vs the S&P/ASX 200) | +1.9% | −1.87 on the week (from +3.76) but +11.57 on the month (from −9.69) — positive and slowing after a strong month |
| MACD (12,26,9) | 0.157 / 0.180 / −0.023 | Dead cross Sep 2, 2026; both lines still above zero, histogram negative |
| ADX(14) | 44.1 (90d) / 43.7 (2y) | Strong — far above the 25 threshold on both frames |
| ATR(14) | $0.148 (4.005%) | Ordinary daily noise spans about fifteen cents on a $3.70 share |
| OBV (2y / 90d) | early accumulation / early accumulation | Above MA20 on both frames with a flat slope; 2y spread +1.05%, 90d spread +2.03% (see section ⑧ for what that percentage measures). No OBV divergence recorded on either frame |
| Volume vs 20d avg | 1.44× | 2,376,268 shares against a 1,650,355 average — roughly A$8.8 million of turnover |
| Unfilled gaps | $3.80–$4.20 | Feb 6, 2026 resistance gap sits 2.7% above the close; a $2.81–$3.02 support gap from Jul 28, 2026 lies 18.4% below. Two older resistance gaps from 2024 remain far overhead at $5.20–$6.88 and $6.71–$7.49 |
| 1×ATR / 2×ATR technical invalidation | $3.55 / $3.40 | Volatility-based structural reference levels, 4.0% and 8.0% below the close |
① Price & Moving Averages
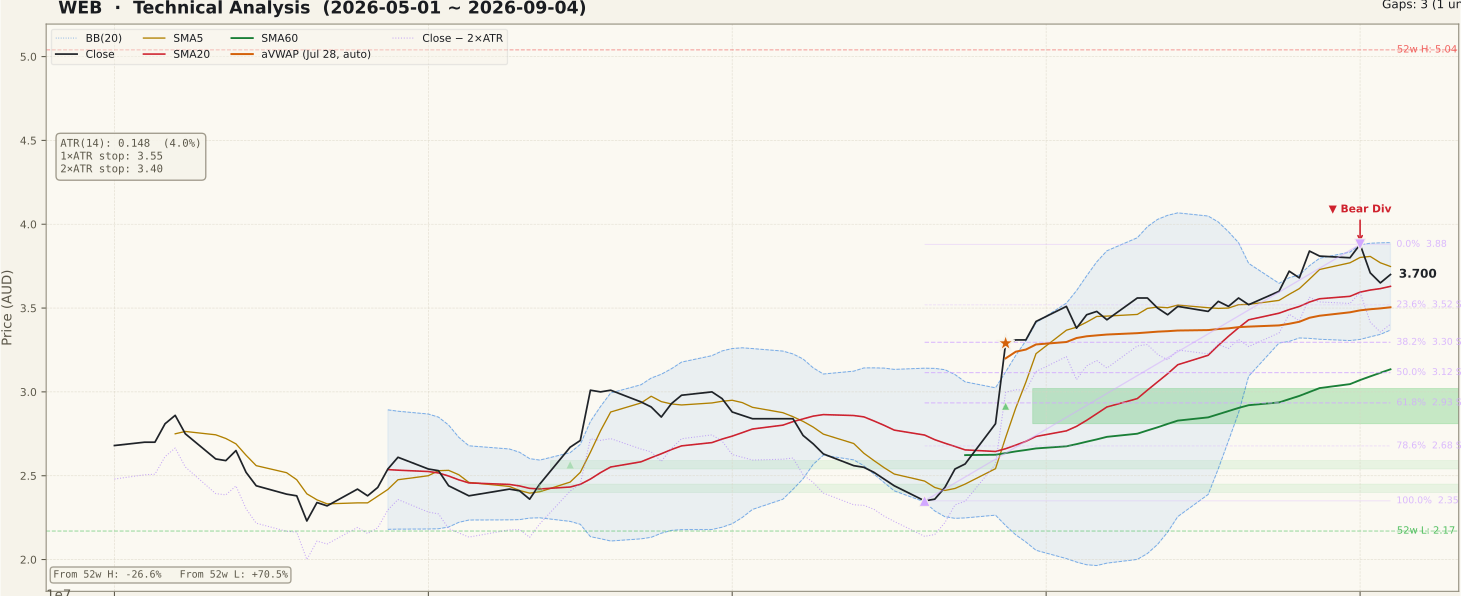
WEB_price-90d-2026-09-06.svgThe averages are not in complete upward order. SMA20 $3.63 sits above SMA60 $3.13 and both are rising, but the close of $3.70 is 1.28% below the SMA5 at $3.75 — the fastest average has turned over relative to price after the September 1 peak. That single break is what separates a pullback from a trend in full flight, and it is worth reading precisely: the close is still 1.94% above the SMA20 and 18.03% above the SMA60, so the structure beneath price is intact while the surface has cracked.
Bollinger Bands frame $3.37 to $3.89 around a $3.63 mid, with band width at 14.37%. Price is in the upper half of that envelope but no longer against the upper edge, which is 5.14% overhead — the shape of a band-walk that has paused rather than one that has been rejected. Note that the mid band and the SMA20 are the same $3.63 line, which concentrates two independent references at one price. Both anchored VWAPs are below the market: $2.94 on the two-year anchor of February 6, 2026 and $3.50 on the 90-day anchor of July 28, 2026, leaving price 26.06% and 5.57% clear of them. The 90-day figure is the more immediate of the two, and it is close enough that a routine two-session drift would reach it.
The retracement grid is drawn up from the July 20 low of $2.35 to the September 1 high of $3.88, so its levels sit beneath the close as pullback structure: 23.6% at $3.52, 38.2% at $3.30, 50% at $3.12 and 61.8% at $2.93. Price has surrendered roughly a quarter of the way toward the first of those. The most consequential feature on the two-year panel, however, sits just above: the February 6, 2026 session left an unfilled resistance gap running $3.80 to $4.20, and its lower edge is only 2.7% above Friday's close. That band is the first structural obstacle this recovery has yet to negotiate.
② Volume

WEB_volume-90d-2026-09-06.svgFriday traded 2,376,268 shares against a 20-day average of 1,650,355 — a Vol/Avg ratio of 1.44×, or about A$8.8 million of turnover. That is comfortably above the liquidity floor where a single order distorts the tape, so the volume readings on this chart carry reasonable weight. The composition of the last five sessions is the more useful detail: August 31 traded 1.97× the average, then 1.18×, 0.87×, 0.96× and Friday's 1.44×. The two down sessions in that run — September 2 and 3 — were the two lightest, which is what an orderly pullback looks like rather than distribution.
The origin of the whole advance is the July 28, 2026 session, and it belongs in any honest reading of this panel. Price opened at $3.07 against the previous session's $2.81 close, traded to $3.29 and finished there, 17.1% higher, on 7,947,528 shares — 4.8× the current 20-day average. That session left the $2.81-to-$3.02 support gap that remains unfilled and set the 90-day aVWAP anchor. It is 28 sessions in the past, so it is described here as history rather than as a live condition, but it is the bar that re-rated the stock and the reason the 90-day average volume line steps up where it does.
One market-specific caveat: ASX small and mid-caps commonly halt for two sessions around capital raisings, so blanks and gaps in the record are ordinary rather than data faults. The February 6 and July 28 sessions both carried volumes many multiples of normal, which is the signature of information arriving rather than of chart mechanics.
③ MACD

WEB_macd-90d-2026-09-06.svgThe MACD line reads 0.157 against a signal line at 0.180, leaving the histogram negative at −0.023. The last crossover was a dead cross on September 2, 2026 — two sessions before the close this page is built on — and it is the freshest bearish mark on the chart.
Context matters more than the cross itself. Both lines remain well above zero, which distinguishes this from a breakdown out of a topping structure; what has happened is that the faster average of price has decelerated relative to the slower one after a 65% run. That is the ordinary arithmetic of a pause. A dead cross fired above zero after a strong advance most often resolves as either a shallow retracement or a sideways drift, and it becomes a genuine trend signal only if the MACD line follows through toward and then below zero. As of Friday it has not, but the histogram widening further negative would be the first evidence it intends to.
④ RSI

WEB_rsi-90d-2026-09-06.svgRSI(14) prints 59.8 on the 90-day frame and 59.7 on the two-year frame — firm but nowhere near the 70 line, having unwound from the readings recorded at the August and September peaks. Both frames record a regular bearish divergence. On the 90-day data the two peaks are August 3, 2026 at a price of $3.51 with RSI 79.22 and September 1, 2026 at a price of $3.88 with RSI 73.75; the two-year data gives the same dates and prices with RSI 79.01 and 73.69. Price made a higher high, momentum made a lower one.
That is the textbook definition of the pattern, and it is also where inexperienced readings most often overreach. A divergence is a statement about the rate of an advance, not a forecast: momentum decelerating while price extends is normal in the second half of any strong move, and divergences routinely appear, persist and dissolve without a top forming. What would convert this into a confirmed signal is price action — a failure to reclaim the $3.88 high followed by a loss of the $3.63–$3.52 shelf. What would dissolve it is a close through $3.88 with RSI pushing back above the September 1 reading. Until one of those happens the divergence is a caution flag on an otherwise strong chart, no more and no less.
⑤ Mansfield Relative Strength

WEB_rs-90d-2026-09-06.svgMansfield relative strength versus the S&P/ASX 200 reads +1.9%, with a rising slope and the same value on both timeframes as the measure is anchor-free. A week ago the line stood at +3.76 and four weeks ago at −9.69, so the change is −1.87 on the week and +11.57 on the month. With the line itself positive, a negative weekly change places the stock in the positive-but-slowing quadrant, while the monthly change still reads as accelerating outperformance. The two readings are not in conflict — they describe a stock that spent a month crossing from clear underperformance to modest leadership and has spent the last week giving a little of that back.
The important qualification is how thin the cushion is. At +1.9% the line is barely above zero, and the two-year panel shows it has spent almost the entire period beneath it — below −30 for much of 2025 and again from February 2026. This is the first stretch of index-relative leadership in a year, and it is one week of weakness away from testing the zero line again. Relative strength that has only just crossed carries none of the buffer that a reading in the double digits would.
⑥ ATR & ADX

WEB_atr_adx-90d-2026-09-06.svgADX(14) is 44.1 on the 90-day frame and 43.7 on the two-year frame, both far above the 25 line that marks a strong trend. Readings in the forties are unusual and describe a directional move of real conviction — which, paired with the price panel, means the July-to-September advance was a trend rather than a bounce. ADX measures intensity and not direction, so the same number would apply to a decline of equal force; here the direction is established by the rising SMA20 and SMA60 beneath price.
ATR(14) is $0.148, or 4.005% of the close. That figure is the practical scale for every level quoted on this page. The distance from the close to the SMA5 at $3.75 is a third of one average day; the distance to the SMA20 at $3.63 is roughly half a day. Levels that look distinct on a chart of a $3.70 share are, in volatility terms, adjacent, and a single ordinary session can traverse the whole $3.63-to-$3.75 zone. The 1×ATR reference sits at $3.55 and the 2×ATR technical invalidation level at $3.40, 4.0% and 8.0% below the close — the first of those falls just above the 23.6% retracement at $3.52, a confluence worth noting.
⑦ OBV

WEB_obv-90d-2026-09-06.svgBoth timeframes report the same state, described as early accumulation. The 90-day window shows OBV at 18,890,696 against a 20-day average of 18,514,968, above its average with a spread of +2.03%. The two-year window shows OBV at −35,303,767 against an MA20 of −35,679,495, also above its average, spread +1.05%. The slope is recorded as flat on both frames, and no OBV divergence is recorded on either — the divergence fields are null, so nothing on this panel argues for or against the RSI signal discussed above.
Two cautions before either number is over-read. First, the two-year OBV is a large negative figure because the series accumulates across a window that includes the February collapse and the long decline into May; it is a statement about that window, not about current flow. Second, the +2.03% and +1.05% readings are not divergences — they measure the distance between OBV and its own 20-day average, and because those averages sit close to the series values here, both percentages are small. They should not be compared with each other or with the divergence field.
What survives the arithmetic is modest. OBV is above its moving average on both frames, which is constructive, but the slope is flat rather than rising after a 65% price advance — volume flow has not extended with price over the last stretch. That is a non-confirmation in the mild sense: not the classic pattern of OBV rolling under its average while price makes new highs, but not the endorsement a rising slope would provide either. OBV turning up while price consolidates would be the constructive resolution; OBV dropping through its MA20 while $3.88 stands unbeaten would be the warning.
Bull Case
- SMA20 $3.63 above SMA60 $3.13 with both rising, and the close 18.03% above the SMA60 — the medium-term structure is upward and the pullback so far has only reached the SMA5.
- Mansfield RS has crossed to +1.9% versus the S&P/ASX 200, a +11.57 swing on the month from −9.69 — the first index-relative leadership in a year.
- ADX 44.1 (90d) and 43.7 (2y), both in the forties — a trend of unusual measured intensity rather than a bounce.
- Both MACD lines remain above zero at 0.157 and 0.180 despite the September 2 dead cross, so the cross came from strength rather than from a topping structure.
- OBV above its MA20 on both frames (2y +1.05%, 90d +2.03%), with no OBV divergence recorded on either.
- Both anchored VWAPs sit below price — $2.94 on the February 6 anchor and $3.50 on the July 28 anchor — so there is no overhead supply shelf from either.
Bear Case
- Regular bearish RSI divergence on both frames: Aug 3 at $3.51 with RSI 79.22 against Sep 1 at $3.88 with RSI 73.75 — a higher price high on lower momentum.
- MACD dead cross dated Sep 2, 2026 with the histogram negative at −0.023 — the freshest signal on the chart is a bearish one.
- The close $3.70 is 1.28% below the SMA5 $3.75; the fastest average has been lost and now sits overhead.
- Mansfield RS is only 1.9 above zero and fell 1.87 on the week from +3.76 — a thin cushion after a single week of relative weakness.
- The unfilled Feb 6, 2026 resistance gap $3.80–$4.20 begins 2.7% above the close, and the two-year chart shows no traded structure inside it.
- OBV slope is flat on both frames after a 65.1% advance, and ATR at 4.005% of price means one ordinary session covers the entire $3.63–$3.75 zone.
Scenarios
| Scenario | Probability | Path | Trigger / Invalidation |
|---|---|---|---|
| Shallow pullback stalls on the SMA20 shelf | ~40% | The $3.63 SMA20 and Bollinger mid absorb the drift, price reclaims the SMA5 $3.75 and works back toward the $3.88 September 1 high, where the lower edge of the February gap at $3.80 and the upper Bollinger Band at $3.89 form a cluster. The RSI divergence dissolves without confirmation and the MACD histogram narrows back toward zero. | Trigger: a daily close back above $3.75 with volume above the 1,650,355 20-day average. Invalidated by a daily close below the 23.6% retracement at $3.52. |
| Range digestion between $3.52 and $3.88 | ~35% | Price oscillates inside the upper half of the July–September swing while RSI unwinds through time from 59.8, the rising SMA20 climbs toward the close and Bollinger width contracts from 14.37%. Mansfield RS hovers near the zero line without decisively re-accelerating. | Trigger: successive closes inside the $3.52–$3.88 band with volume decaying toward 1.0×. Resolved when either boundary gives way on a daily close. |
| Divergence confirms and the swing grid opens | ~25% | $3.63 and then $3.52 give way — taking the 1×ATR reference $3.55 and the 90-day aVWAP $3.50 with them — exposing the 38.2% retracement at $3.30 and, below that, the 50% level $3.12 where the rising SMA60 $3.13 sits alongside it. The 2×ATR technical invalidation level $3.40 falls between those two. | Trigger: a daily close below $3.52 with the MACD line following through toward zero. A daily close below $3.40 — the 2×ATR technical invalidation level — ends the structure described on this page. |
Key Levels & Volatility References
| Level | Role | Basis |
|---|---|---|
| $3.88 | Resistance | Sep 1, 2026 closing high and the 0% anchor of the Jul 20 – Sep 1 up-swing; the upper Bollinger Band $3.89 sits immediately above |
| $3.80 | Resistance | Lower edge of the unfilled Feb 6, 2026 gap ($3.80–$4.20), 2.7% above the close |
| $3.75 | Resistance | SMA5 — the fastest average, now 1.3% overhead after the September drift |
| $3.70 | Current close | Sep 4, 2026 close, on 1.44× the 20-day average volume |
| $3.63 | Support | SMA20 and Bollinger mid band at the same price, 1.9% below the close |
| $3.52 | Support | 23.6% retracement of the Jul 20 – Sep 1 swing; the 1×ATR reference $3.55 sits just above and the 90-day aVWAP $3.50 just below |
| $3.40 | Invalidation | 2×ATR technical invalidation level, 8.0% below the close, between the 23.6% and 38.2% retracements |
What to Watch
- The SMA5 at $3.75, 1.3% overhead. Whether price recovers that line or is turned away by it is the cleanest short-term distinction between a pause inside the advance and the start of a deeper retracement.
- The $3.63–$3.52 shelf, where the SMA20, the Bollinger mid band, the 23.6% retracement, the 1×ATR reference $3.55 and the 90-day aVWAP $3.50 are all concentrated. With ATR at fifteen cents, that entire cluster is about one average session wide.
- The bearish RSI divergence between Aug 3 ($3.51, RSI 79.22) and Sep 1 ($3.88, RSI 73.75). It is a caution, not a verdict — a close above $3.88 with RSI exceeding 73.75 would dissolve it, while a failure at $3.75 followed by a loss of $3.52 would confirm it.
- Mansfield RS versus the S&P/ASX 200 at +1.9%, down 1.87 on the week. The zero line is the reference that matters: a return below it would end the first stretch of index-relative leadership this stock has recorded in a year.
- The $3.80–$4.20 gap left on Feb 6, 2026 and still unfilled. It is the first structural obstacle above the market, it contains no traded reference points, and unfilled gaps act as magnets as often as they act as ceilings.