Resolute Mining
This analysis is based on closing-price data as of September 4, 2026. Whether you're researching Resolute Mining (RSG) on the ASX or learning how to read stock charts, here are objective support, resistance and technical invalidation levels built from the RSI, MACD and ATR indicators.
Resolute Mining closed Friday at $1.475, 12.5% below the $1.685 52-week high set intraday on March 3 and 98.0% above the $0.745 low of September 9, 2025. The two-year panel explains why that pairing matters: the African gold producer ran from under $0.42 in early 2025 to the March peak, gave most of the second quarter and all of the third back to a $0.90 close on July 30, and has since rebuilt in a near-vertical leg that has carried it to the top of its 90-day range in 26 sessions. Every trend gauge on the sheet now reads the same way — full moving-average alignment, ADX 35.9, Mansfield RS +21.4% versus the S&P/ASX 200 after a month at −11.7% — which makes the one dissenting reading the interesting one: Friday's turnover was 0.77× the 20-day average on the highest close of the entire advance. The working lens is therefore a strong, late-stage recovery leg being tested for confirmation, with the objective invalidation line at $1.343 sitting inside a single session's range.
Snapshot as of September 4, 2026
| Item | Value | Reading |
|---|---|---|
| Close | $1.475 | −12.5% from 52w high, +98.0% above 52w low |
| 52-week range | $0.745 – $1.685 | Upper third of the yearly range; the high is the March 3, 2026 session, the low September 9, 2025 |
| SMA 5 / 20 / 60 | $1.425 / $1.293 / $1.090 | Full bullish alignment with the close above all three — but the spacing is unusually wide after a 26-session advance |
| Bollinger (20) | $1.553 / $1.293 / $1.032 | Band width 40.29% — expanded, not contracting; the close sits in the upper half between the midline and the upper band |
| aVWAP (2y anchor) | $0.794 (Nov 11, 2024) | The long-run volume-weighted average is far beneath price — holders from the 2024 base are well above water |
| aVWAP (90d anchor) | $1.089 (Jun 5, 2026) | The short-term anchored average also sits below the close, close to the SMA60 at $1.090 |
| RSI(14) | 69.60 | A whisker under the conventional 70 threshold (2y frame 69.56); no RSI divergence flagged on either frame |
| Mansfield RS (vs the S&P/ASX 200) | +21.42% | Outperforming and rising: +2.87 points over a week from +18.54, and +33.11 points over a month from −11.69 |
| MACD(12,26) | 0.1072 / signal 0.0971 | Golden cross of July 15 intact; histogram +0.0101 and positive |
| ADX(14) | 35.92 | Strong directional trend on both frames (2y 35.56) — strength, not direction |
| ATR(14) | $0.066 (4.49%) | Wide daily range — the 2×ATR band spans 8.98% of price |
| OBV | 90d: accumulation, above MA20, rising (+44.08% spread) · 2y: early accumulation, above MA20, flat (+10.95% spread) | Flow confirms the short-term leg; the two-year series is only just turning and remains deeply negative at −186,337,620 |
| Volume (last session) | 6,095,313 vs 7,916,482 avg (0.77×) | Below average on the highest close of the advance — the weakest link in the structure |
| Unfilled gaps | $1.190 – $1.2475 · $1.065 – $1.095 · $0.99 – $1.0125 | Three open beneath price (Aug 20, Aug 10 and Aug 6, 2026); on the two-year frame a resistance gap remains at $1.540 – $1.590 (Mar 4, 2026) |
| 1×ATR / 2×ATR levels | $1.409 / $1.343 | 2×ATR = technical invalidation level (−8.98% from close) |
① Price & Moving Averages
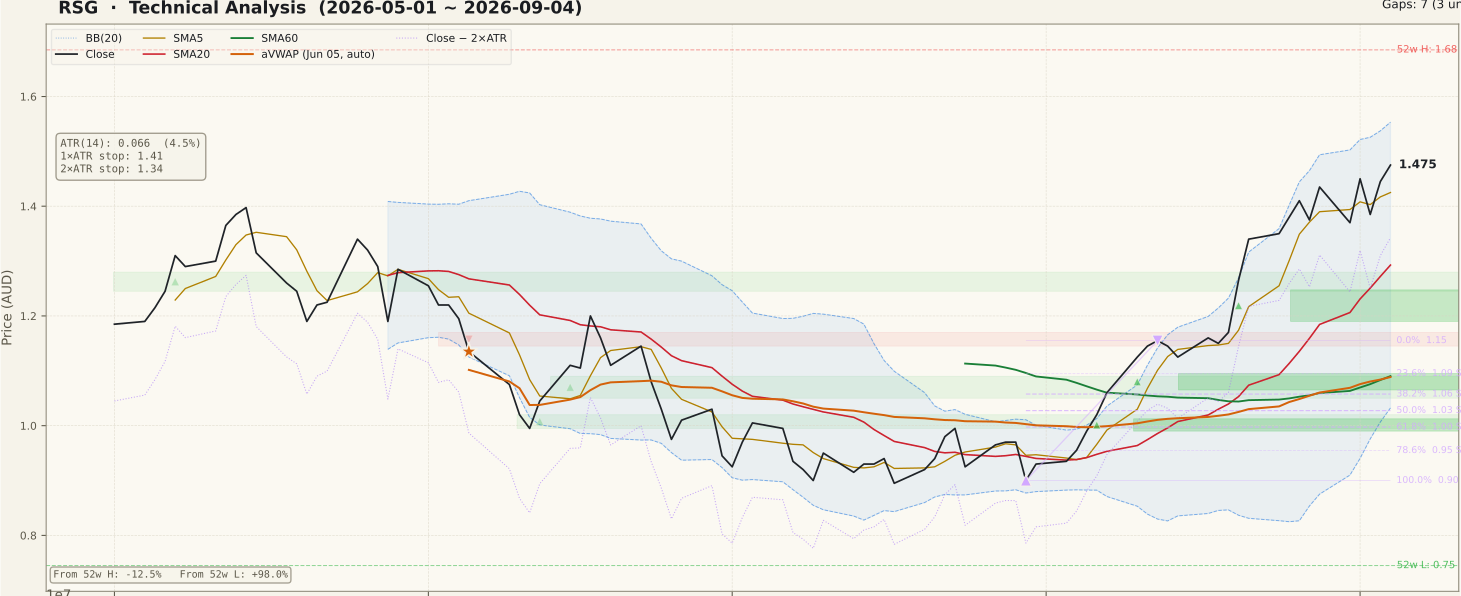
RSG_price-90d-2026-09-06.svgThe stack is in textbook order — close $1.475 above SMA5 $1.425, above SMA20 $1.293, above SMA60 $1.090 — and unlike many charts that screen this way, the close is above the fast average rather than beneath it. What deserves attention is the spacing rather than the order. SMA60 at $1.090 is still roughly where the July base was built, which tells you the long average has not yet absorbed the August leg; the distance between the close and that average is the arithmetic definition of an extended move, and it is the most common reason a chart in perfect alignment still pauses.
The Bollinger structure says the same thing in a different alphabet. Band width is 40.29% with the upper band at $1.553, the midline at $1.293 and the lower band at $1.032 — an expanded envelope, which is what band-walking produces, not what a coiled base looks like. Through late August the close tracked the upper band repeatedly; that is a signature of trend strength while it lasts, and a signature of how far a reversion can travel when it ends, because the midline is more than a fifth of the chart away.
The retracement grid is the one part of this chart that has gone stale, and saying so is more useful than dressing it up. It is anchored on the July 30 low at $0.90 and the August 12 high at $1.155, so the 0% level sits at $1.155 and every retracement step below it — $1.0948, $1.0576, $1.0275, $0.9974, $0.9546 — is far beneath the last print. Price ran clean through that swing high in the third week of August and never looked back, which means there is no Fibonacci reference near current levels at all. The nearest structural marks underfoot are therefore SMA5 $1.425, the 2×ATR line at $1.343, and then the unfilled August 20 gap at $1.190 – $1.2475 running into SMA20 $1.293. Overhead, the two-year frame carries an unfilled down-gap from March 4 at $1.540 – $1.590, with the upper band at $1.553 inside it and the $1.685 52-week high above.
② Volume

RSG_volume-90d-2026-09-06.svgFriday's turnover of 6,095,313 shares is 0.77× the 20-day average of 7,916,482. That is the single most important qualification on this page, because the session it describes produced the highest close of the entire recovery. A breakout that arrives on below-average participation is the textbook unconfirmed breakout, and it is one of the traps that catches newer chart readers most often: the price pattern looks finished while the evidence that would validate it is absent.
The rest of the panel is more constructive. The heaviest bar of the 90-day window belongs to August 10, when roughly 15.6 million shares — close to twice the current average — carried the close from $1.06 to $1.125 and left the unfilled gap at $1.065 – $1.095. Participation stayed at or above average through the August advance and, importantly, the one recent heavy session was a down day rather than an up day: August 31 traded about 13.2 million shares while the close slipped from $1.435 to $1.370. Heavy turnover on a decline is normally the signature of distribution, and the fact that price then recovered to $1.475 in four sessions on lighter volume cuts both ways — the decline was absorbed, but the recovery has not been re-confirmed by turnover.
③ MACD

RSG_macd-90d-2026-09-06.svgMACD reads 0.1072 against a signal line of 0.0971, with the golden cross of July 15 still intact seven weeks on. (The two-year frame dates the same cross a session earlier, July 14 — an artefact of the longer window used to seed the exponential averages, not a disagreement about what happened.) The cross was made from well below zero, immediately after the $0.90 low, which is the constructive version of the pattern: a crossover initiated deep in negative territory usually marks the start of a move rather than its exhaustion, and the whole advance to $1.475 has taken place above it.
The histogram is where the caution sits. At +0.0101 it is positive but modest set against a MACD line of 0.1072 — the two lines have converged, meaning the rate of improvement has flattened even though direction has not changed. That is the normal shape late in an impulse leg. A histogram that re-expands as price works into the $1.540 – $1.590 gap would resolve the ambiguity in the trend's favour; a dead cross would be the first momentum break since July 15 and would most likely coincide with SMA5 $1.425 giving way.
④ RSI

RSG_rsi-90d-2026-09-06.svgRSI(14) reads 69.60 on the 90-day frame and 69.56 on the two-year frame — effectively identical, and a hair under the conventional 70 overbought threshold. The 90-day panel shows the indicator pushing into the shaded overbought band in late August and then easing back to the high 60s while price kept making higher closes. That combination is worth understanding properly: momentum cooling while price advances is the raw material of a bearish divergence, but it is not one yet.
The JSON carries no RSI divergence on either frame — divergence is null and neither peak field is populated — so there is nothing to describe beyond the fact that the reading is elevated. This matters because calling a divergence early is one of the more expensive habits in chart reading; the pattern requires two confirmed peaks with a lower oscillator high, and the detector has not registered them here. An RSI in the high 60s after a 26-session advance is a stretched but coherent reading, and its behaviour on the next pullback — holding above 50 versus breaking under it — is more informative than the absolute number.
⑤ Mansfield Relative Strength

RSG_rs-90d-2026-09-06.svgMansfield RS versus the S&P/ASX 200 is +21.42% with a rising slope, and the trajectory is the strongest single argument on the page. A week ago the same measure read +18.54, so the weekly change is +2.87 points; a month ago it read −11.69, so the monthly change is +33.11 points. Both changes are positive from an already positive base, which places the stock in the accelerating quadrant of the four-way test — outperforming, and doing so faster than a month ago.
The 90-day panel shows the shape behind those numbers: RS was above zero through May, sank into the shaded underperform region for most of June and July, and crossed back above zero in the third week of August. A fresh zero crossing after a sustained period below the line is the configuration that Mansfield's own framework treats as most meaningful, because it marks a change in the stock's standing relative to the index rather than a continuation of an existing one. The honest caveat is that RS is anchor-free and measures relative behaviour only: it says RSG has outpaced the ASX 200 recently, not that the index itself is healthy, and it can stay positive through a shared sector drawdown.
⑥ ATR & ADX

RSG_atr_adx-90d-2026-09-06.svgADX(14) reads 35.92 on the 90-day frame and 35.56 on the two-year frame, comfortably in the "strong trend" zone above 25 and rising off the low-20s readings of mid-year. ADX measures the strength of a directional move, not its direction, so on this chart it corroborates what the moving averages already say: the August leg was a genuine trend rather than a drift. It also carries the usual asymmetry — the same reading would describe an equally strong decline, so it is a confirmation tool, never a directional one.
ATR(14) is $0.066, or 4.49% of the close, which is what actually sets the risk arithmetic here. The 1×ATR reference sits at $1.409 and the 2×ATR technical invalidation level at $1.343, a band spanning 8.98% of price. Put that next to the recent daily record and the implication is plain: over the five sessions to September 4 the stock moved roughly −4.5%, +5.8%, −4.5% and +4.3% on consecutive days, so a single session can traverse most of that band. Those swings were sector-wide rather than company-specific — Northern Star, Evolution, Ramelius, Genesis and Perseus all moved the same way on each of those days — which is gold-sector beta, and it means any level within roughly one day's range should be treated as a zone rather than a line.
⑦ OBV

RSG_obv-90d-2026-09-06.svgThe two frames disagree in degree, not in direction, and both belong in the reading. On the 90-day frame OBV is 74,923,353 against a 20-day average of 52,001,946 — tagged accumulation, above its average and rising, with a spread of 44.08%. On the two-year frame OBV is −186,337,620 against an average of −209,259,027 — tagged early accumulation, above its average but flat, with a spread of 10.95%. The short frame is confirming the August leg emphatically; the long frame shows a series that spent two years in net decline and has only recently stopped falling.
One clarification is worth making because the field name invites confusion: the 44.08% and 10.95% figures are the gap between OBV and its own 20-day average — a measure of how forcefully flow has moved recently — and not a divergence. The actual divergence field is null on both frames, so no bullish or bearish OBV divergence is flagged for this chart. The relevant caution is instead the mismatch between a rising OBV and Friday's 0.77× turnover: OBV is cumulative and slow to reflect a single quiet session, so it will keep reading well until several below-average sessions have accrued.
Bull Case vs Bear Case
Bull Case
- Full bullish alignment with the close on top: $1.475 > SMA5 $1.425 > SMA20 $1.293 > SMA60 $1.090.
- Mansfield RS +21.42% versus the S&P/ASX 200 and rising — +33.11 points in a month from −11.69, a fresh crossing of zero rather than a continuation.
- The July 15 MACD golden cross was made from deep below zero and is still intact, with MACD 0.1072 above signal 0.0971 and a positive histogram.
- ADX 35.92 on the 90-day frame and 35.56 on the two-year frame — the August leg was strongly directional, not a drift.
- OBV is in accumulation on the 90-day frame, above its MA20 and rising, and the two-year series has turned to early accumulation after two years of net decline.
- Three unfilled gaps sit beneath price at $1.190 – $1.2475, $1.065 – $1.095 and $0.99 – $1.0125, each a step the advance left behind and a potential shelf on the way down.
Bear Case
- Friday's turnover was 0.77× the 20-day average on the highest close of the advance — the classic unconfirmed breakout.
- RSI 69.60 after a 26-session run from the $0.90 July 30 close leaves the oscillator with little headroom before the overbought band.
- ATR 4.49% of price means the $1.343 invalidation level sits inside a single recent session's range — position sizing, not conviction, decides how survivable that is.
- The close is far above SMA60 $1.090 and the Bollinger midline $1.293, with band width already expanded to 40.29% — a wide gap for any reversion to close.
- Overhead structure is dense: the unfilled March 4 down-gap at $1.540 – $1.590, the upper band at $1.553 and the $1.685 52-week high, all within reach of one strong week.
- The Fibonacci grid is anchored on the $0.90–$1.155 swing, so every retracement reference is far below the market and there is no near-price grid at all; and the two-year OBV, at −186,337,620, remains deeply negative and flat.
Scenarios
| Scenario | Probability | Path | Trigger / Invalidation |
|---|---|---|---|
| Trend extends into the March gap | 45% | Price holds SMA5 $1.425 and works into the unfilled March 4 gap at $1.540 – $1.590, with the upper Bollinger band at $1.553 inside that zone and the $1.685 52-week high beyond it. The MACD histogram re-expands from +0.0101, RS keeps rising above zero and OBV continues to make higher readings. | Trigger: closes above $1.475 on turnover above the 7,916,482 20-day average. Invalidation: a daily close below $1.343. |
| Sideways digestion while the averages catch up | 35% | The 0.77× volume reading proves to mark a pause rather than a top. Price ranges between SMA5 $1.425 and the upper band $1.553 while RSI unwinds from 69.60 toward the mid-50s and SMA20 $1.293 rises into the range, compressing band width from 40.29%. | Trigger: closes contained inside $1.343 – $1.553 with the histogram narrowing but positive. Invalidation: a close below SMA20 $1.293. |
| Reversion toward the August gap | 20% | The unconfirmed push fails, SMA5 $1.425 and the $1.343 line go in quick succession given a 4.49% ATR, and price works back toward the unfilled August 20 gap at $1.190 – $1.2475, which overlaps SMA20 $1.293 and the Bollinger midline. | Trigger: a daily close below $1.343 on turnover above the 20-day average, with a MACD dead cross. Invalidation of this path: a reclaim of $1.475. |
Key Levels & Volatility References
| Level | Role | Basis |
|---|---|---|
| $1.685 | Resistance | 52-week high — the March 3, 2026 session high |
| $1.590 – $1.540 | Resistance | Unfilled down-gap of March 4, 2026 (two-year frame) — the nearest overhead structure |
| $1.553 | Resistance | Upper Bollinger band (20, 2σ), band width 40.29% — sits inside the March gap |
| $1.475 | Current | Close, September 4, 2026 — highest close of the recovery leg, on 0.77× average turnover |
| $1.425 | Support | SMA5, rising; the 1×ATR reference at $1.409 sits immediately beneath |
| $1.343 | Invalidation | 2×ATR technical invalidation level — 8.98% below the close, inside a single recent session's range |
| $1.293 | Support | SMA20 and the Bollinger midline, overlapping the unfilled August 20 gap at $1.190 – $1.2475 |
What to Watch
- Turnover on the next higher close. Friday's 6,095,313 shares against a 7,916,482 average is the weakest element of the structure; a push above $1.475 on above-average volume repairs it, another on light volume compounds it.
- First contact with $1.540 – $1.590. The March 4 gap has been open for six months and is the first real overhead structure since the recovery began — how price behaves on the initial approach matters more than the level itself.
- RSI behaviour on the next pullback. From 69.60, an unwind that stalls above 50 is momentum resetting inside a trend; one that breaks under 50 while price stalls is momentum failing.
- The $1.425 / $1.343 pair. SMA5 and the 2×ATR line define the shelf, and with ATR at 4.49% a single session can cover the distance between them — treat both as zones.
- Whether Mansfield RS keeps rising. It has moved +33.11 points in a month; a flattening slope while price holds up would mean the gold complex, not RSG specifically, is doing the work.