Stanmore Resources
$3.03 −2.88% from the 52-week high of $3.12 · +75.14% from the 52-week low of $1.73
This analysis is based on closing-price data as of September 4, 2026. Whether you're researching Stanmore Resources (SMR) on the ASX or learning how to read stock charts, here are objective support, resistance and technical invalidation levels built from the RSI, MACD and ATR indicators.
Two years of data show a stock that fell from roughly $3.30 in late 2024 to a 52-week low of $1.73, spent most of 2025 rebuilding, and has since spent 2026 oscillating inside a wide band without clearing the old highs. The last week changed the short-term picture: from the swing low of $2.53 on August 26 the close has travelled to $3.03 on September 4, a move of about 19.8% that leaves the price 2.88% below the 52-week high of $3.12, above the upper Bollinger band at $2.98, and with Mansfield RS at +19.08% against the S&P/ASX 200 after sitting at −5.79% a month ago. The caveat is that the structure supporting the move is very young — the moving-average alignment behind this setup formed on August 28, six sessions before the basis date — and part of the advance is attributable to identifiable news rather than to chart mechanics alone.
Snapshot as of September 4, 2026 close
| Metric | Value | Reading |
|---|---|---|
| Close | $3.03 | 2.88% below the 52-week high |
| 52-week high / low | $3.12 / $1.73 | Upper quarter of the two-year range |
| SMA5 / SMA20 / SMA60 | $2.90 / $2.67 / $2.55 | Close > SMA5 > SMA20 > SMA60 — aligned, six sessions old |
| Bollinger upper / mid / lower | $2.98 / $2.67 / $2.36 | Close 1.55% above the upper band; width 23.3% |
| aVWAP (2y, anchor Apr 17, 2026) | $2.53 | Close 19.87% above |
| aVWAP (90d, anchor Jul 28, 2026) | $2.62 | Close 15.56% above |
| RSI(14) | 70.93 (90d) / 70.90 (2y) | Just into the overbought zone |
| Mansfield RS vs the S&P/ASX 200 | +19.08% | Outperform, rising (prev week 4.56, prev month −5.79) |
| MACD / signal / histogram | 0.1036 / 0.0620 / +0.0416 | Golden cross on August 13, 2026; histogram expanding |
| ADX(14) | 32.16 (90d) / 31.76 (2y) | Strong trend regime |
| ATR(14) | $0.1218 (4.02%) | Elevated daily range for a mid-cap producer |
| OBV state | 90d accumulation, rising · 2y early accumulation, flat | Above its MA20 on both timeframes |
| Volume vs 20-day average | 2,988,052 vs 1,452,936 (2.06×) | Move carried real participation |
| 1× / 2× ATR technical invalidation | $2.91 / $2.79 | 2× sits 8.05% below the last close |
① Price & Moving Averages
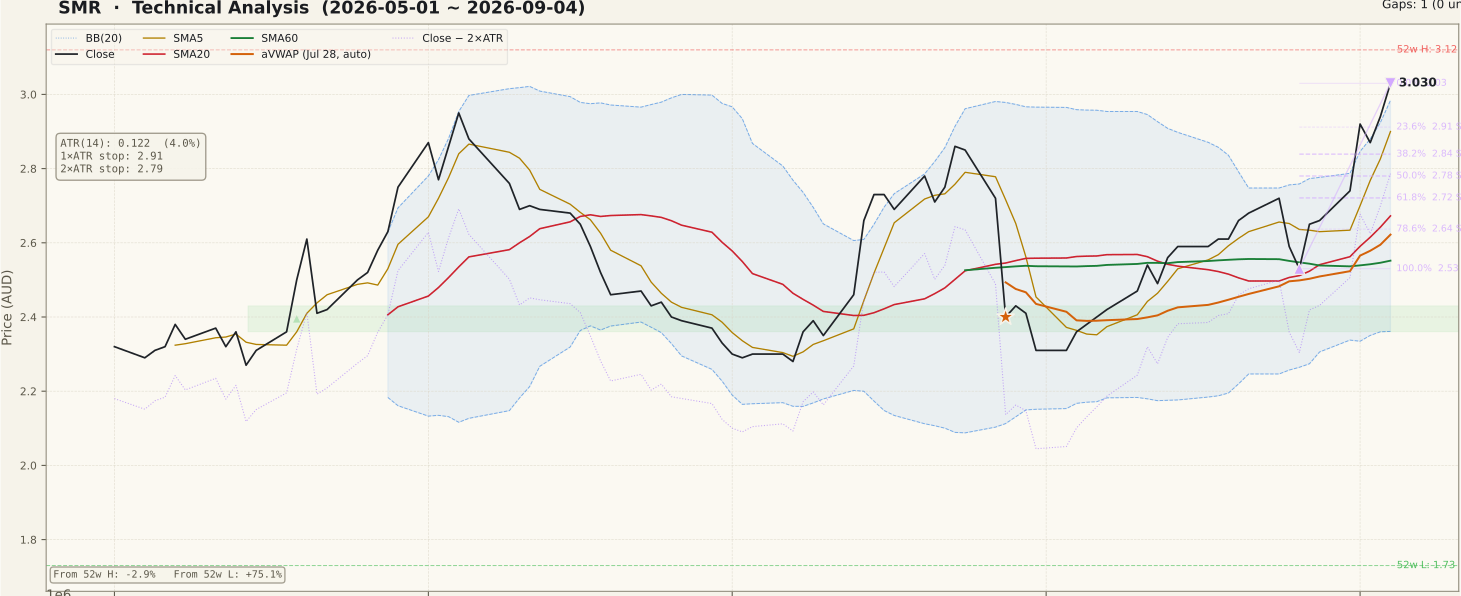
SMR_price-90d-2026-09-06.svgThe averages sit in textbook rising order: close $3.03 above SMA5 $2.90, above SMA20 $2.6725, above SMA60 $2.5518. That order is what the screen flagged, and it is worth being precise about its age — the alignment formed on August 28, 2026, six sessions before the basis date, so the structure is young relative to a move that has already carried about 19.8% from the August 26 swing low of $2.53. The close is 13.38% above SMA20 and 18.74% above SMA60, which is a wide stretch from the mean rather than a quiet advance.
The close is also 1.55% above the upper Bollinger band at $2.9838, with band width at 23.3% of the middle band. A close outside the upper band is a sign of trend intensity rather than an automatic reversal signal, but it does mean the price is temporarily extended relative to the twenty-day distribution. Anchored VWAP from the April 17, 2026 low sits at $2.5277 and the shorter anchor from July 28, 2026 sits at $2.6220; the price is above both, so the average price paid since either anchor is below the market, which historically thins overhead supply. Above the close the only structural reference on the two-year chart is the 52-week high at $3.12, less than 3% away.
② Volume

SMR_volume-90d-2026-09-06.svgThe final session traded 2,988,052 shares against a 20-day average of 1,452,936, a ratio of 2.06×. The 90-day panel shows two bars tagged as volume spikes in the closing week, so the advance was not a thin drift higher — one of the more common beginner errors is treating a breakout on below-average volume as confirmed, and that criticism does not apply here.
The corollary is that heavy volume confirms participation, not direction. Volume of this size clustered around a sector move and a corporate announcement tells you the tape was busy, and busy tape near the top of a two-year range can mark either continuation or distribution. The OBV panel below is the cleaner read on which of the two is in progress.
③ MACD

SMR_macd-90d-2026-09-06.svgMACD reads 0.1036 against a signal line of 0.0620, a positive histogram of +0.0416, with the last crossover a golden cross dated August 13, 2026. The crossover happened close to the zero line rather than deep below it, which is the more common pattern inside a range than at the base of a fresh trend.
What the 90-day panel makes clear is how often this pattern has repeated: the June, late-July and current swings each produced a crossover of similar amplitude, and the first two faded back through zero within weeks. The histogram is currently expanding, which is the constructive read, but this indicator has not yet exceeded the amplitude of the early-June peak on the same panel. Momentum is improving; it is not yet unprecedented for this stock.
④ RSI

SMR_rsi-90d-2026-09-06.svgRSI(14) reads 70.93 on the 90-day frame and 70.90 on the two-year frame — a fraction above the conventional overbought threshold of 70. The JSON reports no RSI divergence on either timeframe and provides no divergence peaks, so there is no basis on this page for a divergence claim in either direction.
An RSI just above 70 is a statement about the speed of the advance, not a reversal signal. In a strong trend the indicator can remain above 70 for weeks, and the two-year panel shows earlier episodes where it did exactly that. The practical point is narrower: at 70.9 the oscillator has spent its cushion, so any further advance is starting from a stretched reading rather than a neutral one.
⑤ Mansfield Relative Strength

SMR_rs-90d-2026-09-06.svgMansfield RS versus the S&P/ASX 200 reads +19.08% and is rising. Because the prior values are absolute readings rather than changes, the arithmetic matters: one week ago RS stood at 4.56, so the weekly change is +14.52; one month ago it stood at −5.79, so the monthly change is +24.86. Both are positive with RS in positive territory, which places the stock in the positive-and-accelerating quadrant on both horizons.
The month-ago reading is the more instructive number. RS was below zero — underperforming the index — as recently as a month back, and the whole of the positive reading has been built since. That is a genuine change of leadership rather than the extension of a long-standing one, and it is consistent with a sector re-rating in metallurgical coal rather than with stock-specific grind. The two-year panel shows RS has crossed zero repeatedly through 2026, so this reading has to earn its persistence.
⑥ ATR & ADX

SMR_atr_adx-90d-2026-09-06.svgATR(14) is $0.1218, or 4.02% of the last close. That is a wide daily range, and it is the number that sets the scale of every level on this page: one average day's range is roughly 12 cents, so clusters of levels within 10 cents of each other are, in practice, a single zone. The 1× ATR technical invalidation level sits at $2.91 and the 2× level at $2.79, the latter 8.05% below the close.
ADX(14) reads 32.16 on the 90-day frame and 31.76 on the two-year frame, both in the strong-trend band above 25. ADX measures the strength of a directional move, not its direction, but combined with the rising moving-average order the reading describes a market that is trending rather than chopping. ADX has been climbing off the low-20s readings that dominated July and August, which is the change that separates this move from the two earlier rallies in the 90-day window.
⑦ OBV

SMR_obv-90d-2026-09-06.svgThe two timeframes agree in direction and differ in maturity. On the 90-day frame OBV is 34,171,618 against an MA20 of 23,924,727.65, tagged as accumulation, above its average and rising. On the two-year frame OBV is 89,085,268 against an MA20 of 78,838,377.65, tagged as early accumulation, above its average but with a flat slope. In short: strong short-term inflow sitting on top of a longer-term picture that has only just turned constructive.
The gap between OBV and its own MA20 is 42.83% on the 90-day frame and 13.0% on the two-year frame. It is worth being explicit about what that figure is, because the name misleads: it is the distance between OBV and its own moving average, a measure of how stretched the inflow is, and it is not a divergence. The actual divergence fields are null on both timeframes for both RSI and OBV, so this page makes no divergence claim. The 42.83% gap does say the short-term inflow is running well ahead of its own trend, which is a strength reading and simultaneously a stretched one.
Bull Case vs Bear Case
Bull Case
- Rising moving-average order intact: close $3.03 > SMA5 $2.90 > SMA20 $2.67 > SMA60 $2.55.
- Mansfield RS +19.08% and accelerating on both the weekly (+14.52) and monthly (+24.86) measures, having been negative a month ago.
- ADX 32.16 in the strong-trend band, rising out of the low-20s readings that characterised July and August.
- OBV above its MA20 and rising on the 90-day frame; the two-year frame has turned to early accumulation.
- Closing session volume 2.06× the 20-day average, so the advance carried genuine participation rather than drifting on thin turnover.
- Price above both anchored VWAPs ($2.5277 from April 17; $2.6220 from July 28), leaving little visible overhead supply below $3.12.
Bear Case
- The moving-average alignment is six sessions old (formed August 28), young relative to a roughly 19.8% move off the August 26 low.
- RSI 70.93 is already above the overbought threshold, so the advance is starting from a stretched oscillator rather than a neutral one.
- Close is 1.55% outside the upper Bollinger band and 13.38% above SMA20 — extended against every short-term mean on the page.
- Two earlier 90-day rallies (early June, late July) produced comparable MACD crossovers and both faded back through zero within weeks.
- The 52-week high at $3.12 is under 3% away and is the only overhead reference left; the two-year panel shows the $3.05–$3.30 region has repelled the price repeatedly since late 2024.
- ATR at 4.02% of price means a single average session covers about 12 cents, so the distance between the close and the $2.91 shelf is under one day's range.
Scenarios
| Scenario | Probability | Path | Trigger / Invalidation |
|---|---|---|---|
| Continuation into the 52-week high | 40% | Price holds above the $2.91 shelf and works the remaining 2.88% up to $3.12, with the upper Bollinger band expanding rather than reversing. | Trigger: daily closes above $3.03 on volume at or above the 20-day average. Invalidated by a close back beneath $2.91. |
| Digestion inside the $2.91–$2.72 retracement band | 40% | The stretched RSI and Bollinger readings resolve sideways rather than lower: the price works back into the 23.6%–61.8% retracement shelf ($2.912 to $2.721) while SMA20 rises to meet it. | Trigger: a close back inside the upper band under $2.98. Invalidated upward by a close above $3.12, downward by a close beneath $2.72. |
| Failed thrust back toward the mean | 20% | The move proves to be a news-driven spike; price loses the retracement shelf and returns toward SMA20 at $2.67, matching the pattern of the June and July swings on the 90-day panel. | Trigger: a close beneath the 2× ATR technical invalidation level at $2.79. The rising moving-average order fails on a close beneath SMA20 at $2.67. |
Key Levels & Volatility References
| Level | Role | Basis |
|---|---|---|
| $3.12 | Resistance | 52-week high — the only overhead structural reference, 2.88% above the close |
| $3.03 | Current | Last close, September 4, 2026; also the 0% anchor of the current up-swing |
| $2.98 | Support | Upper Bollinger band, now beneath the price by 1.55% |
| $2.91 | Support | 23.6% retracement of the August 26 – September 4 swing; also the 1× ATR technical invalidation level |
| $2.90 | Support | SMA5 — the fastest average, effectively the same zone as the level above given a 12-cent ATR |
| $2.79 | Invalidation | 2× ATR technical invalidation level, 8.05% below the close; sits alongside the 50% retracement at $2.78 |
| $2.67 | Support | SMA20 and the Bollinger middle band; the rising moving-average order fails beneath it |
What to Watch
- Whether the $2.91 shelf — the 23.6% retracement and the 1× ATR level in the same 1-cent zone — contains the first pullback, or gives way inside a single average session.
- Volume on any approach to $3.12. A test of the 52-week high on below-average turnover would be the classic unconfirmed breakout the volume panel currently argues against.
- Whether Mansfield RS stays above zero. It crossed from −5.79 a month ago and has crossed zero repeatedly through 2026, so persistence above the line is the thing to verify.
- Whether OBV keeps rising on the 90-day frame and whether the flat two-year slope turns up. The current 42.83% gap to its own MA20 is stretched and would narrow on any pause.
- Metallurgical coal pricing and the progress of the Moranbah South agreement, including the Exxaro–Anglo American condition precedent — both sit outside the chart but drove the sessions the chart is reading.