PWR Holdings
This analysis is based on closing-price data as of September 4, 2026. Whether you're researching PWR Holdings (PWH) on the ASX or learning how to read stock charts, here are objective support, resistance and technical invalidation levels built from the RSI, MACD and ATR indicators.
PWR Holdings closed the week at $11.31, 9.5% below the $12.50 52-week high set intraday on August 21 and 59.5% above the $7.09 low of October 13, 2025. The two-year frame shows a stock that spent almost all of 2025 out of favour — Mansfield relative strength against the S&P/ASX 200 sat between −20% and −30% for the whole of that year, and price ground from $9 down to a base near $6 before recovering. The turn came in stages: a re-rating through January and February 2026, a five-month give-back, and then a sustained advance from the June 26 close of $7.87 that has carried the stock 43.7% higher. What the last fortnight has produced is a textbook pullback, not a breakdown — price has retraced 41.6% of the August 19–21 swing on volume that has fallen to 0.28× the 20-day average, while the SMA20 at $11.09 and the SMA60 at $9.68 both continue to rise. The honest counterweights are on the momentum panels: MACD crossed down on September 2, Mansfield RS has decelerated by 4.78 points on the week, and a bearish RSI divergence is on record between the August 6 and August 21 peaks. Everything on this page is measured against an ATR of 3.82% of price.
Snapshot as of September 4, 2026
| Item | Value | Reading |
|---|---|---|
| Close | $11.31 | −9.5% from 52w high · +59.5% from 52w low |
| 52-week range | $7.09 – $12.50 | Upper third of a range that has widened sharply since June; the high is thirteen sessions old |
| SMA 5 / 20 / 60 | $11.37 / $11.09 / $9.68 | Long averages aligned and rising (SMA20 14.5% above SMA60), but the close sits 0.5% under the SMA5 — the fastest average has flipped overhead |
| Bollinger (20) | $12.45 / $11.09 / $9.74 | Band width 24.5% — expanded by the August advance; the close sits in the upper half with the upper band 10.1% overhead |
| aVWAP (2y anchor Nov 20, 2024) | $8.07 | Price 40.2% above — the average position taken since the November 2024 anchor is well onside |
| aVWAP (90d anchor Jun 10, 2026) | $9.92 | Price 14.1% above — positioning since the June turn is onside as well |
| RSI(14) | 57.7 (90d) / 57.7 (2y) | Mid-range on both frames, unwound from the 76-plus readings of August; a bearish divergence is recorded on the 90d frame |
| Mansfield RS (vs the S&P/ASX 200) | +24.1% | −4.78 on the week from +28.90, but +6.56 on the month from +17.57 — positive and still outperforming, decelerating week-on-week |
| MACD (12,26,9) | 0.422 / 0.495 / −0.073 | Dead cross Sep 2, 2026; both lines remain well above zero but the histogram has turned negative |
| ADX(14) | 32.2 (90d) / 31.8 (2y) | Strong — above the 25 threshold on both frames |
| ATR(14) | $0.432 (3.82%) | Ordinary daily noise spans roughly 43 cents, so the distance to the SMA20 is under half an average day |
| OBV (2y / 90d) | early accumulation / accumulation | Both above MA20; 90d rising with a +24.26% spread, 2y flat with a +5.33% spread (see section ⑧ for what that percentage measures). No divergence recorded on either frame |
| Volume vs 20d avg | 0.28× | 87,081 shares against a 311,208 average — roughly A$0.98m of turnover on the day against an average near A$3.5m |
| Unfilled gap | $10.52–$10.99 | Aug 21, 2026 support gap, 2.8% to 7.0% beneath the close; the four other gaps on the two-year frame have been filled |
| 1×ATR / 2×ATR technical invalidation | $10.88 / $10.45 | Volatility-based structural reference levels, 3.8% and 7.6% below the close |
① Price & Moving Averages
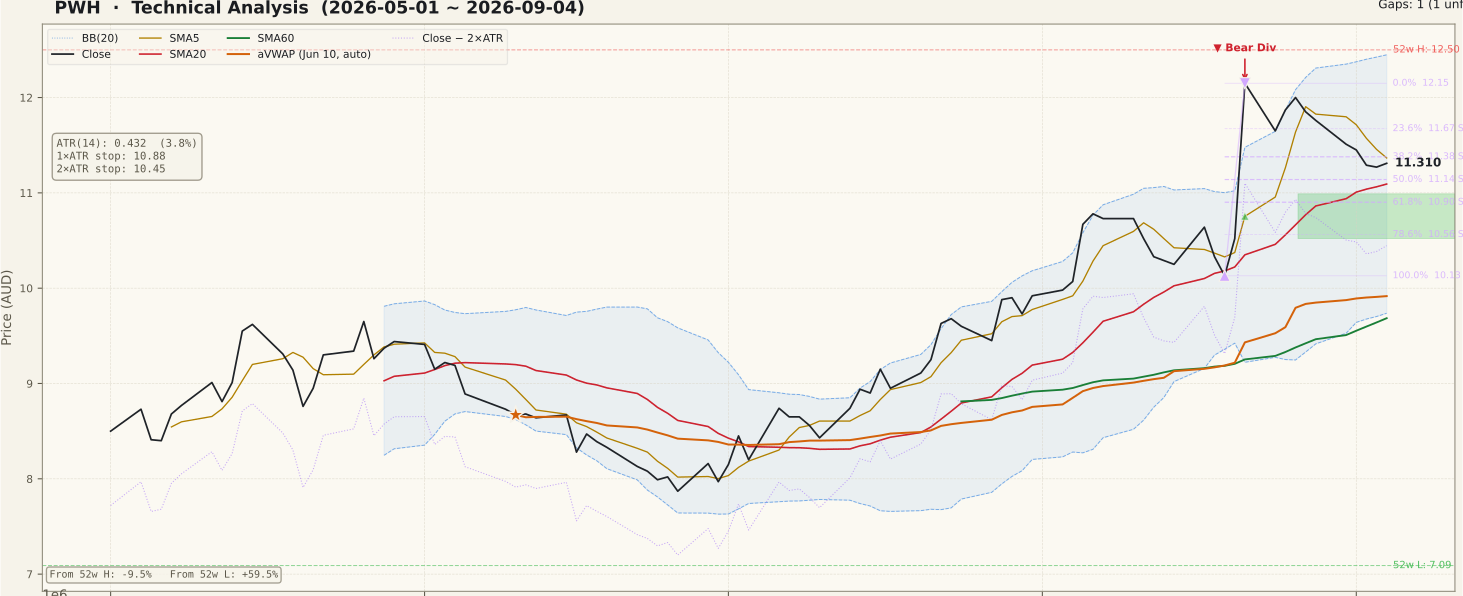
PWH_price-90d-2026-09-06.svgThe moving-average stack is mostly, but not entirely, in upward order: SMA5 $11.37, SMA20 $11.09 and SMA60 $9.68 each sit above the next and all three are rising, yet the close at $11.31 has slipped 0.5% below the SMA5. That single inversion is what separates a pullback from a continuation — the fastest average is now marginally overhead while the two structural averages remain underneath. The close is 2.0% above the SMA20 and 16.8% above the SMA60, and the SMA20 itself is 14.5% clear of the SMA60. That spacing is the arithmetic residue of the June-to-August advance, and it narrows either through time or through price.
Bollinger Bands frame the range at $9.74 to $12.45 around an $11.09 mid, with band width at 24.45%. The bands opened as the August move ran rather than compressed ahead of it, and the close now sits 10.1% below the upper edge, well off the band-walk position it held in late August. Both anchored VWAPs are far beneath the market: $8.07 on the two-year anchor of November 20, 2024 and $9.92 on the 90-day anchor of June 10, 2026, leaving price 40.2% and 14.1% clear of them. Neither anchor projects an overhead supply shelf.
The 90-day retracement grid is drawn up from the August 19 low of $10.13 to the August 21 high of $12.15, so under the standard convention its levels sit beneath that high as pullback structure: 23.6% at $11.67, 38.2% at $11.38, 50% at $11.14, 61.8% at $10.90, 78.6% at $10.56 and 100% back at $10.13. The close has slipped just under the 38.2% line — 41.6% of the swing given back — which puts $11.38 immediately overhead and $11.14 as the next shelf beneath. Below that grid lies the one unfilled gap on the chart, $10.52 to $10.99, left by the August 21 session itself.
② Volume

PWH_volume-90d-2026-09-06.svgFriday traded 87,081 shares against a 20-day average of 311,208 — a Vol/Avg ratio of 0.28×, the lightest bar of the pullback. The sequence behind it matters more than the single reading: the four declining sessions from August 31 through September 3 traded 0.75×, 0.52×, 0.34× and 0.24× the current average. Volume contracting steadily as price gives ground is the signature of supply drying up rather than of distribution, and it is the most constructive single observation on this chart.
The contrast with the advance is stark. The August 21 session — the market's reaction to the FY26 result released on August 20 — traded 983,538 shares, about 3.2× the current 20-day average, opened at $10.99 against the prior session's $10.52 high and closed 15.5% higher at $12.15. August 26 was heavier still at 1,266,779 shares, roughly 4.1×, closing at $12.00. Those two bars carry the whole of the August range, and the pullback since has been transacted on a fraction of that participation.
One structural caveat applies. At $0.98 million of turnover, the last session is thin in absolute terms even for a mid-cap industrial, so both the "low volume pullback" reading and the OBV panel that depends on it carry less statistical weight than they would on a heavily traded name. Thin tape also widens spreads and increases slippage, and it means a single sizeable order can move the printed level more than the chart pattern would suggest.
③ MACD

PWH_macd-90d-2026-09-06.svgThe MACD line reads 0.422 against a signal line at 0.495, leaving the histogram negative at −0.073. The most recent crossover was a dead cross on September 2, 2026, and the two-year frame reports the same event at effectively identical values (0.421 / 0.494). That is an unambiguous momentum deterioration on both timeframes.
The qualifier is where the cross occurred. Both lines remain far above the zero line, which is a very different configuration from a dead cross fired at or below zero. A cross this high in positive territory typically marks the end of an acceleration phase rather than the start of a downtrend — the two lines converge because the rate of advance slowed, not because price collapsed. The reading that would upgrade the warning is the MACD line itself tracking toward zero; the reading that would cancel it is the histogram narrowing back toward positive while price consolidates.
④ RSI

PWH_rsi-90d-2026-09-06.svgRSI(14) prints 57.7 on both the 90-day and two-year frames — mid-range, comfortably clear of both the 70 and 30 lines, having unwound from readings above 76 during August. On its own that is a neutral number, and it is the natural consequence of a pullback: momentum has come off without the market breaking.
The 90-day frame does record a regular bearish divergence, and the two peaks are worth stating precisely because their shape is more nuanced than the label suggests. The first peak on August 6 paired a $10.78 close with an RSI of 76.67; the second on August 21 paired a $12.15 close with an RSI of 76.07. Price made a decisively higher high — 12.7% higher — while RSI made a marginally lower one, a gap of just 0.60 points. That qualifies as a bearish divergence under the standard definition, but the momentum shortfall behind it is slight, and readers who treat every divergence as equally weighted will misjudge this one.
The general caution still applies: a divergence is evidence that price and momentum have parted company, not a confirmed top. It requires follow-through — a failure to reclaim the prior high, or a break of the structure beneath — before the market has validated it. On this chart the divergence has produced a 6.9% retracement from the August 21 close so far, and the structure beneath is still intact.
⑤ Mansfield Relative Strength

PWH_rs-90d-2026-09-06.svgMansfield relative strength versus the S&P/ASX 200 reads +24.1%, with a rising slope and the same value on both timeframes as the measure is anchor-free. A week ago the line stood at +28.90 and four weeks ago at +17.57, so the changes are −4.78 on the week and +6.56 on the month. The line is in positive territory, which means outperformance; the negative weekly change means that outperformance is decelerating rather than deteriorating into underperformance. Over the month the reading is still accelerating.
Context sharpens this. On the two-year panel the stock spent the whole of 2025 between roughly −20% and −30% relative strength — a persistent laggard — and only crossed above zero during the January 2026 re-rating. It dipped back to marginally negative around the June low before the current advance carried it to a peak above +35% in late August. So +24.1% is a strong absolute reading, and the week's give-back is a retreat from an extreme rather than a loss of leadership. The signal that would matter is the line crossing back below zero, and that is a long way from here.
⑥ ATR & ADX

PWH_atr_adx-90d-2026-09-06.svgADX(14) is 32.2 on the 90-day frame and 31.8 on the two-year frame, both in the "strong trend" band above 25. ADX measures conviction rather than direction, so it has to be paired with the price panel to mean anything — and there the direction is up, with the SMA20 and SMA60 both rising. A reading in the low thirties describes a trend that is established, not one that is merely emerging. It also tends to lag: ADX at this level reflects the August advance, and a multi-week consolidation would bring it down without changing anything structural.
ATR(14) is $0.432, or 3.82% of the close. That figure is the practical scale for every level on this page. The SMA20 at $11.09 is 0.5 of an average day beneath the close; the 50% retracement at $11.14 is 0.4 of a day away; the 38.2% level at $11.38 is 0.2 of a day overhead. Levels that look distinct on a chart of an $11 stock are, in volatility terms, effectively adjacent, and a single ordinary session can traverse several of them. The 1×ATR reference sits at $10.88 and the 2×ATR technical invalidation level at $10.45, 3.8% and 7.6% below the close respectively — the latter falling just under the $10.52 base of the unfilled August 21 gap.
⑦ OBV

PWH_obv-90d-2026-09-06.svgThe two frames report related but distinct states. The 90-day window shows OBV at 2,103,907 against a 20-day average of 1,693,149, above its average with a rising slope and a spread of +24.26% — tagged accumulation. The two-year window shows OBV at −7,292,153 against an MA20 of −7,702,911, also above its average but with a flat slope and a spread of +5.33% — tagged early accumulation. No divergence is recorded on either frame.
Two readings need care. First, the negative two-year absolute value is a statement about the window, not about the present: across two years, down-volume exceeded up-volume, which is exactly what a stock that spent 2025 declining would produce. The relevant part is that OBV has now climbed back above its own 20-day average. Second, and more important, the +24.26% and +5.33% figures are not divergences. They measure the distance between OBV and its own 20-day average — a rough gauge of how forcefully flow has moved recently — and because the two windows are re-based to different starting points and different scales, the two percentages are not comparable with each other. The dedicated divergence field is null on both frames, so there is no OBV divergence on this chart in either direction.
What survives the arithmetic is straightforward. Flow is above its average on both timeframes and rising on the short one, which means the pullback of the past four sessions has not yet drawn meaningful distribution volume through the tape. The constructive continuation would be that 90-day slope staying positive while price consolidates under $11.67. The warning would be OBV rolling under its MA20 while price is still in the upper half of the August range — the classic non-confirmation, and the point at which the light-volume reading of this pullback would stop holding.
Bull Case
- Mansfield RS +24.1% versus the S&P/ASX 200 with a rising slope, and +6.56 on the month from +17.57 — a stock that was a persistent laggard through 2025 is now a clear outperformer.
- SMA20 $11.09 and SMA60 $9.68 both rising, with the SMA20 14.5% above the SMA60 and the close 16.8% above the SMA60 — the structural trend is undamaged.
- ADX 32.2 (90d) and 31.8 (2y) — both above the 25 threshold, describing an established trend rather than a bounce.
- The pullback has come on collapsing participation: 0.75×, 0.52×, 0.34× and 0.24× the 20-day average on the four down sessions, versus 3.2× and 4.1× on the two advancing bars that built the range.
- OBV above its MA20 on both frames and rising on the 90-day frame; no OBV divergence recorded on either.
- Both anchored VWAPs sit far below price — $8.07 (2y, Nov 20 2024) and $9.92 (90d, Jun 10 2026) — so there is no overhead supply shelf from either anchor.
Bear Case
- A regular bearish RSI divergence is recorded on the 90d frame: the close rose from $10.78 (Aug 6) to $12.15 (Aug 21) while RSI eased from 76.67 to 76.07.
- MACD dead cross on Sep 2, 2026 with the histogram at −0.073 — momentum has turned down on both timeframes simultaneously.
- The close is 0.5% below the SMA5 $11.37, so the fastest average has flipped from beneath price to overhead.
- Mansfield RS is decelerating: −4.78 on the week from +28.90, a retreat from the late-August extreme.
- Turnover of roughly A$0.98m at the last close on 0.28× average volume — thin enough that the volume-based readings on this page carry less weight, with wider spreads and slippage risk.
- The August 21 session covered $10.99 to $12.50 in a single bar, so the entire zone between the close and the 52-week high is untested range left by one gap-driven session rather than accumulated structure.
Scenarios
| Scenario | Probability | Path | Trigger / Invalidation |
|---|---|---|---|
| Pullback completes and the advance resumes | ~40% | The 50% retracement $11.14 and the SMA20 $11.09 hold the drift, price reclaims the SMA5 $11.37 and the 38.2% level $11.38, then works back toward the 23.6% retracement $11.67 and the $12.15 August 21 closing high; MACD histogram narrows back toward positive and Mansfield RS resumes climbing from +24.1%. | Trigger: a daily close above $11.67 on volume above the 311,208 20-day average. Invalidated by a daily close below the 50% retracement $11.14. |
| Sideways digestion between the retracement lines | ~35% | Price ranges between $11.14 and $11.67 while the rising SMA20 $11.09 closes the gap from below, Bollinger width contracts from 24.45%, and RSI works off the August divergence through time rather than through price. | Trigger: successive closes inside the $11.14–$11.67 band with volume staying under 1.0×. Resolved when either boundary gives way on a daily close. |
| Deeper retracement into the August gap | ~25% | $11.14 and the SMA20 $11.09 give way together, opening the 61.8% retracement $10.90 and then the unfilled Aug 21 gap $10.52–$10.99, where the 78.6% level $10.56 and the 2×ATR technical invalidation level $10.45 sit in close succession. | Trigger: a daily close below $11.09. A daily close below $10.45 — the 2×ATR technical invalidation level, just under the base of the August gap — ends the structure described on this page. |
Key Levels & Volatility References
| Level | Role | Basis |
|---|---|---|
| $12.50 | Resistance | 52-week high, printed intraday on Aug 21, 2026 — 10.5% above the close |
| $12.45 | Resistance | Upper Bollinger Band (20, 2σ), 10.1% above the close |
| $12.15 | Resistance | Aug 21, 2026 closing high; 0% anchor of the Aug 19–21 up-swing grid, 7.4% above the close |
| $11.67 | Resistance | 23.6% retracement of the Aug 19–21 swing, 3.2% above the close |
| $11.37 | Resistance | SMA5, the first average now sitting overhead, 0.5% above the close; the 38.2% retracement $11.38 lies alongside it |
| $11.31 | Current close | Sep 4, 2026 close, on 0.28× the 20-day average volume |
| $11.14 | Support | 50% retracement of the Aug 19–21 swing, 1.5% below the close; the rising SMA20 $11.09 sits immediately beneath |
| $10.45 | Invalidation | 2×ATR technical invalidation level, 7.6% below the close, just under the $10.52 base of the unfilled Aug 21 gap |
What to Watch
- Whether the $11.14 50% retracement and the rising SMA20 at $11.09 contain the drift. They sit five cents apart, roughly a tenth of an average day's range, so they function as one shelf rather than two — and it is the shelf that separates an ordinary pullback from a retracement into the August gap.
- The SMA5 at $11.37, 0.5% overhead. Reclaiming it would restore the full upward stack; continued closes beneath it keep the fastest average working against price.
- Volume on any recovery attempt. The pullback's credibility rests on participation drying up to 0.28×; a move back toward $11.67 on similarly light turnover would be far less persuasive than one printing above the 311,208 average.
- The MACD histogram at −0.073 after the September 2 dead cross. Narrowing back toward zero while price consolidates would mark the deceleration as complete; the MACD line itself tracking down toward zero would widen the warning.
- The $10.52–$10.99 gap of Aug 21, 2026 — the only unfilled gap on the chart, between 2.8% and 7.0% beneath the close. Unfilled gaps act as magnets as often as they act as floors, and the 2×ATR technical invalidation level at $10.45 lies immediately below its base.