WEB Travel Group
This analysis is based on closing-price data as of August 7, 2026. Whether you're researching WEB Travel Group (WEB) on the ASX or learning how to read stock charts, here are objective support, resistance and technical invalidation levels built from the RSI, MACD and ATR indicators.
WEB is a damaged two-year chart in the middle of a violent short-term repair, and the two facts sit awkwardly together. On the long view the stock is still 31.9% below its 52-week high of $5.04, having lost roughly half its value twice — once in late 2024 and again from February 2026 — and the unfilled gaps from those declines still hang overhead. On the short view it has run from the $2.35 swing low of July 20 to $3.51 by August 3 (+49.4%), gapping higher on July 28 in a move the chart marks as a volume-spike day, and Mansfield relative strength has recovered from −29.9% a month ago to −9.7% today. Friday's close of $3.43 therefore sits at RSI 70.0 and 17.9% above its own 20-day average: strong momentum, still a below-market performer, and a long way from repairing the two-year damage.
Snapshot as of August 7, 2026
| Item | Value | Read |
|---|---|---|
| Close | $3.43 | Below the Aug 3 swing high $3.51; upper half of the 90-day range |
| 52-week range | $2.17 – $5.04 | −31.9% from the high · +58.1% off the low |
| SMA 5 / 20 / 60 | $3.45 / $2.91 / $2.73 | SMA5 > SMA20 > SMA60; close 0.6% under SMA5 but 17.9% above SMA20 (extended) |
| Bollinger (20) | $3.84 / $2.91 / $1.98 · width 64.03% | Bands violently wide after the July expansion; close 12.0% under the upper band |
| aVWAP | 2y $2.88 (Feb 6, 2026) · 90d $2.97 (Jun 17, 2026) | Close 19.1% / 15.5% above both anchors |
| RSI(14) | 70.0 (90d) · 69.9 (2y) | Right at the overbought threshold on both frames |
| Mansfield RS (vs the S&P/ASX 200) | −9.7% | Still underperforming; +20.2 pts on the month, −2.1 pts on the week |
| MACD (12,26,9) | 0.216 / signal 0.147 / hist +0.070 | Golden cross Jul 27, 2026; MACD line at its 90-day high |
| ADX(14) | 34.3 (90d) · 34.0 (2y) | Strong-trend regime (above 25) |
| ATR(14) | $0.144 (4.2% of price) | High volatility — an average day moves 4% of the share price |
| OBV | 2y: above MA20, rising (+17.6% vs MA20) · 90d: above MA20, rising (+282.0%) | Accumulation on both timeframes; chart flags a bullish OBV divergence |
| Volume (last vs 20-day avg) | 1.92M vs 2.68M · 0.72x | Friday was a quiet session — no fresh participation behind the advance |
| Unfilled gaps | Support $2.81–$3.02 (Jul 28, 2026) · Resistance $3.80–$4.20 (Feb 6, 2026) | One gap beneath as structure, one above as supply |
| Technical invalidation (ATR-based) | 1×ATR $3.29 · 2×ATR $3.14 | 2×ATR level sits 8.4% below Friday's close |
① Price & Moving Averages
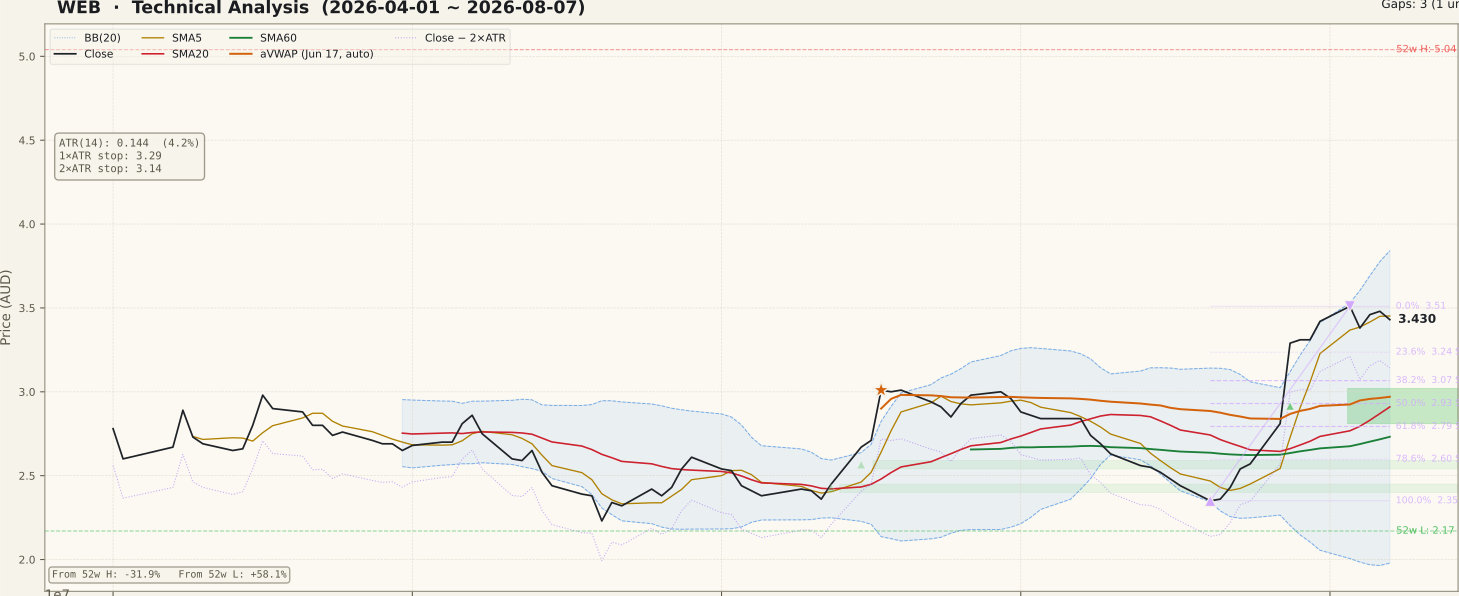
The two-year panel is a story of two step-downs. The chart opens above $8 in August 2024, collapses through September and October 2024 — leaving three unfilled gaps between $5.20 and $8.15 that no rally since has come close to testing — then spends all of 2025 chopping in a $4–$5 band. A second break arrives in February 2026: the gap between $3.80 and $4.20 dated February 6 is still open, and the aVWAP anchor sits on that same date at $2.88. From there price slid to the 52-week low of $2.17 before building the base that the current advance came out of.
The 90-day panel is where the character changes. After drifting from roughly $3.00 in April down to the July 20 swing low at $2.35, price gapped higher on July 28 — the gap between $2.81 and $3.02 remains unfilled — and ran to $3.51 on August 3, a 49.4% swing low to swing high. Moving averages have re-stacked (SMA5 $3.45 above SMA20 $2.91 above SMA60 $2.73), but the close of $3.43 is 0.6% under SMA5 and 17.9% above SMA20: the short-term average has caught up to price while price has stalled. Retracement references from the July–August swing sit at $3.24 (23.6%), $3.07 (38.2%) and $2.93 (50%, which lands inside the July 28 gap alongside SMA20). Bollinger width at 64.03% is the signature of an expansion phase rather than a quiet trend.
② Volume

The thrust itself was confirmed: the 90-day volume panel shows a cluster of spike bars (flagged at 2x or more of the 20-day average) around the July 28 gap, which is exactly what a genuine repricing looks like. The problem is what came after. Friday printed 1.92M shares against a 2.68M 20-day average — 0.72x — and the recent bars have been shrinking as price flattened between $3.38 and $3.51. Advances that lose volume while they lose upward slope are the ones that most often give back ground before they resume. WEB is a liquid mid-cap, so the volume signal itself is trustworthy; the message is simply that nobody chased Friday's close.
③ MACD

MACD crossed above its signal line on July 27, 2026 — one session before the gap — and the spread is still wide: MACD 0.216 against signal 0.147, histogram +0.070. The cross happened below the zero line and has since driven the MACD line to the highest reading of the 90-day window, which is the sequence you want early in a new leg. Two caveats are visible on the panel. First, the histogram peaked a few sessions ago and has been narrowing since, even as the MACD line rises — the first quiet sign that the rate of improvement is fading. Second, the 2-year panel shows this indicator has produced repeated golden crosses through the 2025 range that led nowhere, so the cross confirms momentum rather than guaranteeing a trend.
④ RSI

RSI(14) reads 70.0 on the 90-day frame and 69.9 on the 2-year frame — sitting exactly on the overbought threshold. The panel shows the indicator vaulting from below 30 in late July to a poke above 70 in early August, and now curling back to the line. In a genuinely strong trend RSI can stay pinned above 70 for weeks, so an overbought reading is not, by itself, a reversal signal; equally, this move covered its whole range in about two weeks, which is the kind of vertical repricing that usually needs time or price to work off. No RSI divergence is flagged in the data and the peak fields are null, so there is no bearish non-confirmation to point at — only heat. Whether RSI cools sideways or through a drop is the tell worth waiting for.
⑤ Mansfield Relative Strength

This is the panel that carries the page's central tension, and it deserves reading carefully. Mansfield RS versus the S&P/ASX 200 stands at −9.7%: the stock is still lagging the index, as it has for almost the entire two-year window apart from a brief spell above zero in December 2025 and January 2026. That is the honest headline, and a deeply negative RS is the classic reason a chart that looks exciting up close keeps disappointing.
The rate of change tells the other half. A month ago the reading was −29.9%, so the monthly change is +20.2 points — in negative territory a positive change means improving toward zero, not merely "slowing", and on the 90-day panel that improvement is nearly vertical. Against that, the past week has given a little back: a week ago RS stood at −7.6%, so the weekly change is −2.1 points. The picture is a powerful month-long recovery that has flattened out just short of the zero line. Until RS actually crosses zero, this remains a stock outperforming its own recent past rather than outperforming the market — a distinction that decides whether the July move was the start of a trend or a bounce inside a downtrend.
⑥ ATR & ADX

ADX(14) reads 34.3 on the 90-day frame and 34.0 on the 2-year frame — a strong-trend regime, and the panel shows it lifting off the low-20s as the July move developed. Remember that ADX measures trend strength, not direction: the same reading described the February–June decline, and here it is simply confirming that the tape has stopped being directionless. ATR(14) is $0.144, or 4.2% of the share price, near the top of its 90-day range — this is a wide-swinging chart, and any level on it needs a proportionate buffer. That ATR anchors the objective risk arithmetic: the 1×ATR reference sits at $3.29 and the 2×ATR technical invalidation level at $3.14, 8.4% below Friday's close. A daily close beneath $3.14 would say the July thrust has failed on this chart's own volatility yardstick.
⑦ OBV (On-Balance Volume)

OBV is in an accumulation state on both timeframes — above its 20-day average and rising — but the two frames are saying different-sized things. On the 90-day series OBV sits 282.0% above its MA20 and has pushed to a new high for the window, confirming that the July advance was bought rather than drifted up on thin air. On the 2-year series OBV is still deeply negative at −53.06M, only 17.6% above its own MA20: two years of distribution are not undone by two weeks of demand. The chart also flags a bullish OBV divergence, which is a constructive early signal, though divergence indicates the possibility of a turn rather than confirming one. The fair summary is real short-term demand inside a long-term supply overhang.
Bull Case
- Sharp base-and-thrust reversal: $2.35 (Jul 20) to $3.51 (Aug 3), +49.4%, leaving an unfilled gap at $2.81–$3.02 as structure beneath.
- Moving averages have re-stacked — SMA5 $3.45 > SMA20 $2.91 > SMA60 $2.73 — after months of bearish alignment.
- Mansfield RS has improved +20.2 points in a month (−29.9% → −9.7%), the strongest relative recovery since February 2026.
- MACD golden cross on Jul 27 with the line at its 90-day high (0.216 vs signal 0.147, histogram +0.070).
- OBV in accumulation on both frames, 282.0% above MA20 on the 90-day series, with a bullish divergence flagged.
- ADX 34.3 confirms a strong-trend regime, and price is 19.1% above the 2-year aVWAP anchor at $2.88 — average holders from the February break are no longer underwater.
Bear Case
- Still 31.9% below the 52-week high $5.04, with unfilled overhead gaps at $3.80–$4.20 and a cluster between $5.20 and $8.15 — years of trapped supply above.
- Mansfield RS is negative at −9.7%: after a 49% run the stock still lags the S&P/ASX 200, and the past week gave back 2.1 points.
- RSI 70.0 on both frames after a near-vertical two-week move — the whole advance happened before this page was written.
- Close $3.43 is 17.9% above SMA20 and 15.5% above the 90-day aVWAP — extended from every mean on the chart.
- Friday's volume was 0.72x the 20-day average and the MACD histogram is narrowing — the thrust is losing participation, not gaining it.
- ATR at 4.2% of price makes the 2×ATR invalidation $3.14 sit 8.4% below the close: on this chart, a normal week of noise covers the whole distance.
Scenarios
| Scenario | Probability | Path | Trigger / Invalidation |
|---|---|---|---|
| Digest the thrust, then extend | 40% | Price works off RSI 70 sideways or with a shallow dip into the $3.24–$3.07 retracement band (23.6–38.2% of the July–August swing), then clears the $3.51 swing high and opens the road toward the lower edge of the February gap at $3.80. | Trigger: closes staying above $3.07, then a volume-backed daily close above $3.51. Invalidated on a daily close below $3.14 (2×ATR). |
| Gap fill and mean reversion | 35% | The unfilled July 28 gap acts as a magnet. Price retraces into the $3.02–$2.81 zone, where the 50% retracement $2.93, SMA20 $2.91 and the 2-year aVWAP $2.88 all cluster — a support retest zone that would leave the broader repair intact if it stabilises there. | Trigger: a daily close below $3.14, then loss of $3.07. The repair narrative breaks if the $2.81 gap floor gives way. |
| Momentum continuation | 25% | Relative strength pushes through zero, RSI stays pinned above 70 and price runs straight at the $3.80–$4.20 gap without resting — the pattern seen when a repriced stock keeps re-rating. | Trigger: daily close above $3.51 on 2x or more of average volume, with Mansfield RS crossing zero. Loses credibility if price slips back under $3.24 within days. |
Key Levels & Volatility References
| Price | Role | Basis |
|---|---|---|
| $3.80 | Upside resistance level | Lower edge of the unfilled Feb 6, 2026 gap ($3.80–$4.20) · 10.8% above the close |
| $3.51 | Upside resistance level | Aug 3 swing high, the 0% anchor of the current up-swing · 2.3% above the close |
| $3.43 | Current close | Fri, Aug 7 close · 31.9% below the 52-week high $5.04 |
| $3.24 | Support | 23.6% retracement of the $2.35→$3.51 swing; the 1×ATR reference $3.29 sits just above |
| $3.14 | Technical invalidation (2×ATR) | Close − 2×ATR(14) · 8.4% below Friday's close — a daily close beneath means the thrust failed |
| $3.07 | Support | 38.2% retracement of the July–August swing |
| $3.02 – $2.81 | Support retest zone | Unfilled Jul 28, 2026 gap; the 50% retracement $2.93, SMA20 $2.91 and the 2-year aVWAP $2.88 sit inside it |
What to Watch
- Mansfield RS and the zero line. The single most informative line on this page. RS crossing above zero would turn "recovering from a deep hole" into genuine market outperformance; a slide back toward −20% would mark the July move as a bounce inside a downtrend.
- $3.51 on volume. A daily close above the August 3 swing high on 2x or more average turnover reopens the path to the $3.80 gap edge; a stall there on 0.7x volume after a 49% run is the classic exhaustion pattern.
- The $3.02–$2.81 gap. Unfilled gaps act as magnets as often as they act as floors. How price behaves on a first visit to this zone — where SMA20 and both aVWAP anchors cluster — separates a healthy retest from a failed thrust.
- The MACD histogram. It has been narrowing while the MACD line still rises. If it turns negative before price makes a new high, momentum peaked at $3.51.
- The catalyst behind July 28. A gap of this size on 2x-plus volume is news-driven far more often than not, and ASX mid-caps routinely halt around capital raisings and corporate announcements. Verify what actually happened before reading these technicals in isolation.