Deep Yellow
This analysis is based on closing-price data as of September 4, 2026. Whether you're researching Deep Yellow (DYL) on the ASX or learning how to read stock charts, here are objective support, resistance and technical invalidation levels built from the RSI, MACD and ATR indicators.
Deep Yellow closed the week at $1.66, some 44.1% below the $2.97 52-week high of January 30, 2026 and 36.6% above the $1.22 52-week low printed only twenty-six sessions ago on July 30. The two-year chart is a completed round trip — a long base through late 2024, a re-rating into the January 2026 peak, then a six-month decline that surrendered the entire advance — and what is on the screen now is the first sustained recovery off that low. That recovery has already restored full upward moving-average alignment, with the close above the SMA5 $1.63, the SMA20 $1.59 and the SMA60 $1.47, yet ADX at 18.8 still describes the market as directionless and Mansfield relative strength remains 11.1% behind the S&P/ASX 200. The immediate structure is the pullback this screen was built to examine: price gave back 71% of the August 14–26 up-swing by Wednesday's close, then rebounded 8.4% on Thursday to leave Friday's close sitting almost exactly on the 38.2% retracement at $1.66.
Snapshot as of September 4, 2026
| Item | Value | Reading |
|---|---|---|
| Close | $1.66 | −44.1% from 52w high · +36.6% from 52w low |
| 52-week range | $1.22 – $2.97 | In the lower third of a range that has halved and then partly recovered inside twelve months |
| SMA 5 / 20 / 60 | $1.63 / $1.59 / $1.47 | Full upward alignment; close 1.9% above SMA5, 4.6% above SMA20, 12.9% above SMA60, with the SMA20 8.0% clear of the SMA60 |
| Bollinger (20) | $1.82 / $1.59 / $1.35 | Band width 29.7%; price sits in the upper half with the upper band 9.9% overhead and the lower band 18.6% beneath |
| aVWAP (2y anchor Jun 16, 2025) | $1.80 | Price 7.9% below it — average positioning taken since the 2025 anchor is offside, so the level is overhead supply |
| aVWAP (90d anchor Jun 19, 2026) | $1.46 | Price 13.4% above it — positioning since the June anchor is onside |
| RSI(14) | 57.3 (90d) / 57.2 (2y) | Mid-range on both frames, above the 50 pivot and well clear of either extreme; no divergence recorded on either |
| Mansfield RS (vs the S&P/ASX 200) | −11.1% | Below zero, so underperforming; −1.92 on the week (deteriorating) but +16.76 on the month (improving from −27.82) |
| MACD (12,26,9) | 0.064 / 0.067 / −0.003 | Dead cross on Sep 2, 2026, but both lines sit above zero and the histogram is only marginally negative |
| ADX(14) | 18.8 (90d) / 18.4 (2y) | Below 20 on both frames — ranging, with no established trend to confirm the moving-average alignment |
| ATR(14) | $0.097 (5.86%) | High — ordinary daily noise spans roughly ten cents, so most levels on this page are within a single session of each other |
| OBV (2y / 90d) | early distribution / early distribution | Both frames below their MA20 with a flat slope; 2y spread −3.47%, 90d spread −29.64% (see section ⑧ for what that percentage measures) |
| Volume vs 20d avg | 0.81× | 4,248,511 shares against a 5,228,994 average — roughly A$7.05 million of turnover, comfortably clear of thin-liquidity territory |
| Retracement grid (90d) | $1.44 – $1.80 | Drawn up from the Aug 14 low to the Aug 26 high; 23.6% $1.71, 38.2% $1.66, 50% $1.62, 61.8% $1.57, 78.6% $1.51 |
| Unfilled gaps (2y) | $2.08–$2.17 · $2.34–$2.41 | Both from March 2026 and both above the market, 25.3% and 41.0% overhead; a support gap at $0.82–$0.88 (Apr 2025) sits far below. The 90-day frame records five gaps, none unfilled |
| 1×ATR / 2×ATR technical invalidation | $1.56 / $1.47 | Volatility-based structural reference levels, 5.8% and 11.8% below the close |
① Price & Moving Averages
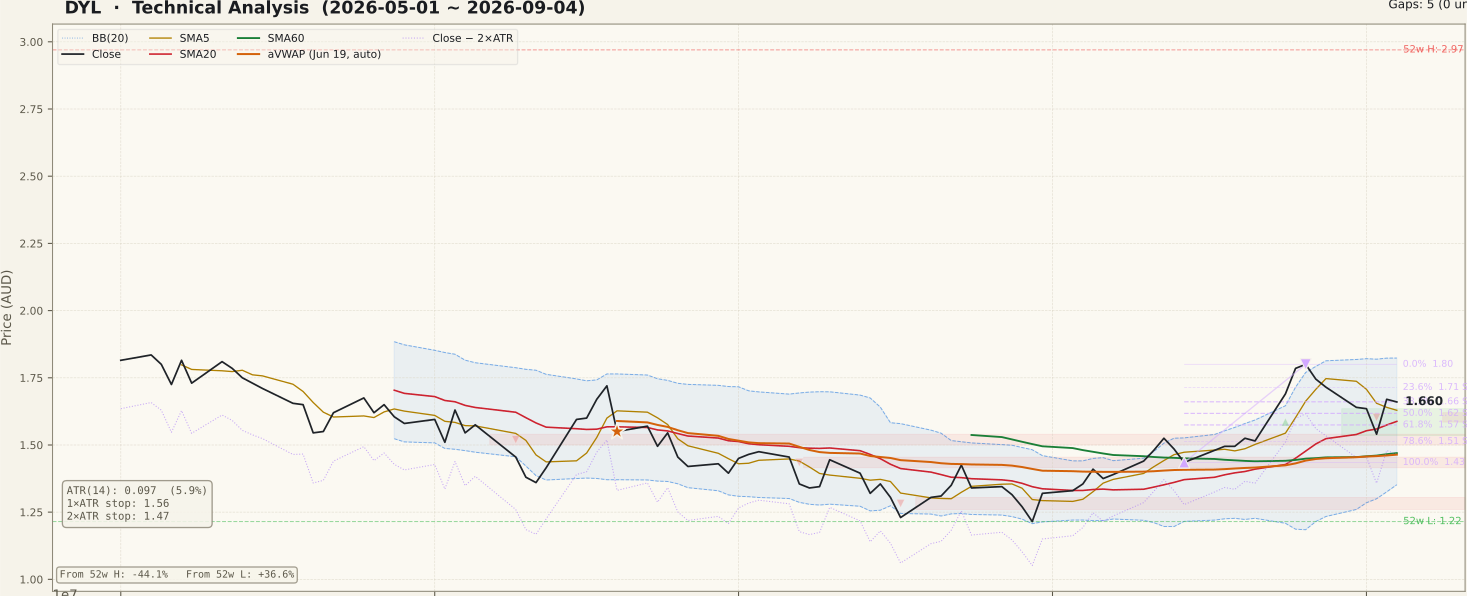
DYL_price-90d-2026-09-06.svgThe averages are in full upward order — close $1.66, SMA5 $1.63, SMA20 $1.59, SMA60 $1.47 — and the spacing is moderate rather than stretched: 1.9% from the close to the SMA5, 4.6% to the SMA20 and 12.9% to the SMA60, with the SMA20 8.0% above the SMA60. That is a far tidier arrangement than the one this stock carried through the first half of the year, when the same averages were stacked in the opposite order. It is worth being precise about what the alignment does and does not say: it confirms that the past sixty sessions have been constructive, not that a trend has been established, and the ADX panel disagrees with the second reading.
Bollinger Bands frame the range at $1.35 to $1.82 around a $1.59 mid, with width at 29.7%. Price sits in the upper half of that envelope, 9.9% under the upper band, so there is no band-walk in progress. The two anchored VWAPs point in opposite directions and that contrast is the most useful thing on the panel: the 90-day anchor of June 19, 2026 sits at $1.46, leaving price 13.4% above it, while the two-year anchor of June 16, 2025 sits at $1.80, leaving price 7.9% below. Recent positioning is onside; the longer book is not, and $1.80 therefore reads as overhead supply.
The 90-day retracement grid is drawn up from the August 14 low of $1.44 to the August 26 high of $1.80, which puts its levels beneath the close as pullback structure: 23.6% at $1.71, 38.2% at $1.66, 50% at $1.62, 61.8% at $1.57 and 78.6% at $1.51. Friday's close is effectively on the 38.2% line. Note the confluence at the top of that grid — the 0% anchor $1.80, the August 26 closing high and the two-year aVWAP $1.80 are the same price, which makes it the single most defined reference on the chart.
② Volume

DYL_volume-90d-2026-09-06.svgFriday traded 4,248,511 shares against a 20-day average of 5,228,994, a Vol/Avg ratio of 0.81×. At $1.66 that is roughly A$7.05 million of turnover, which places the stock well above the level at which single orders distort the tape — a relevant check for any ASX small or mid-cap where volume-based indicators are being read.
The sequence through the week is more instructive than the last bar. The advance that built the August swing came on expanding volume: 1.49× the average on August 24 and 1.46× on August 26. The pullback since has not matched it — Wednesday's 5.8% decline traded 1.02× and Thursday's 8.4% rebound only 0.74×. Neither side of this week's swing carried conviction volume, which argues for treating the whole move as positioning noise rather than as a change of hands.
One market-specific caveat applies throughout. This is an ASX uranium developer, and names in that group reprice on drilling and resource announcements, permitting milestones and moves in the uranium price itself — none of which any volume pattern anticipates. The sharp swings inside the last five sessions were sector-wide rather than company-specific: Paladin, Boss Energy and Lotus Resources all moved the same way on the same days.
③ MACD

DYL_macd-90d-2026-09-06.svgThe MACD line reads 0.064 against a signal line at 0.067, leaving the histogram fractionally negative at −0.003. The most recent crossover was a dead cross on September 2, 2026 — two sessions before the reference close — and the two-year frame records the identical event on the identical date.
Context matters more than the label here. Both lines sit above zero, which distinguishes this from a dead cross fired in negative territory, and the histogram is barely below the line rather than expanding downward. What the reading describes is the loss of upward momentum that the September 2 decline produced, measured against a fortnight in which momentum had been rising steeply. A cross this shallow is reversed by two or three constructive sessions as easily as it is confirmed; the panel is worth watching for which of those happens, not for the crossover in isolation.
④ RSI

DYL_rsi-90d-2026-09-06.svgRSI(14) prints 57.3 on the 90-day frame and 57.2 on the two-year frame — essentially the same value, above the 50 pivot and a long way from both the 70 and 30 thresholds. The JSON records no divergence and no divergence peaks on either timeframe.
A mid-range RSI is the least dramatic reading this indicator produces and, for a pullback screen, arguably the most useful one. It says momentum has been reset without being broken: the August advance carried RSI to the low 70s, the September decline unwound it to the mid 50s, and the indicator now has room to expand in either direction without immediately running into an extreme. The common error at this point is to read the shape of the recent decline in the RSI line as a divergence. A divergence requires a lower price high set against a higher momentum low, or the mirror image, and this chart records neither — so the honest description is that the panel is neutral, not that it is quietly signalling.
⑤ Mansfield Relative Strength

DYL_rs-90d-2026-09-06.svgMansfield relative strength versus the S&P/ASX 200 reads −11.1%, with the same value on both timeframes because the measure is anchor-free. A week ago the line stood at −9.14 and four weeks ago at −27.82, so the change is −1.92 on the week and +16.76 on the month. Because the line itself is below zero, those two changes have different names: the monthly move is improvement toward zero, while the weekly move is deterioration away from it. Neither is outperformance.
This is the single most important qualification on the page, and it is the reading beginners most often invert. A stock recovering 16.76 points of relative strength in a month is genuinely doing better than it was — but at −11.1% it is still lagging the index, and the whole 90-day window shown on this panel sits inside the underperformance shading. The threshold that would change the character of the chart is the zero line, not the slope. Until relative strength crosses it, every constructive reading elsewhere on this page describes a stock improving within a laggard position rather than one leading the market.
⑥ ATR & ADX

DYL_atr_adx-90d-2026-09-06.svgADX(14) is 18.8 on the 90-day frame and 18.4 on the two-year frame, both below the 20 line that separates a ranging market from a forming trend. That is the direct counterweight to the moving-average alignment described in section ①: the averages are stacked upward, but the trend-strength measure says the market has not yet committed to that direction. ADX is also non-directional, so the low reading is not itself bearish — it is an absence of conviction on either side.
ATR(14) is $0.097, or 5.86% of the close. That figure sets the scale for everything else quoted here. An average day covers roughly ten cents, so the distance from the close to the 23.6% retracement at $1.71 is barely half a session of normal movement, and the SMA5, the close and the 38.2% retracement are separated by less than a third of an average day. Levels that appear distinct on the chart are, in volatility terms, the same neighbourhood. The 1×ATR reference sits at $1.56 and the 2×ATR technical invalidation level at $1.47, 5.8% and 11.8% below the close — the latter falling immediately beneath the rising SMA60 at $1.470, which is a confluence worth noting.
⑦ OBV

DYL_obv-90d-2026-09-06.svgBoth timeframes report the same state, and it is the least constructive panel on the page. The two-year window shows OBV at 177,415,039 against a 20-day average of 183,789,302 — below its average, flat slope, a spread of −3.47%. The 90-day window shows OBV at 15,134,484 against an MA20 of 21,508,747, also below its average, also flat, with a spread of −29.64%. The generator tags both as early distribution, and no divergence is recorded on either frame.
Two cautions before either percentage is over-read. First, the two figures are not comparable with each other: the 90-day series is re-based to the start of its own window, so it is computed off a much smaller base and any given flow imbalance shows up as a far larger percentage. Second, and more importantly, that percentage is not a divergence. It measures the gap between OBV and its own 20-day average — a measure of how far current flow sits from its recent norm. The divergence fields on this chart are separate, and both are empty, so no divergence claim can be made from this data.
What survives the arithmetic is straightforward and it cuts against the price panel: volume flow is beneath its own average on the long frame and the short frame simultaneously, with no upward slope on either. Price has recovered 36.6% off the July low without flow confirming the move. The constructive change would be OBV crossing back above its MA20 with a rising slope while price remains above the SMA5 $1.63; a continuation of the present configuration, with price grinding higher and OBV flat beneath its average, is the classic non-confirmation and the reason this page treats the recovery as unconfirmed.
Bull Case
- Full upward moving-average alignment — close $1.66 above SMA5 $1.63 above SMA20 $1.59 above SMA60 $1.47, with the SMA20 8.0% clear of the SMA60.
- Mansfield RS has recovered 16.76 points in four weeks, from −27.82% to −11.1% against the S&P/ASX 200 — the fastest improvement on the 90-day panel.
- Price is 36.6% above the $1.22 52-week low of July 30, 2026, and that low has not been retested in the twenty-six sessions since.
- The 90-day aVWAP $1.46 sits 13.4% below the market, so positioning taken since the June 19 anchor is onside with no near-term supply shelf beneath the close.
- Both MACD lines remain above zero (0.064 / 0.067) despite the September 2 dead cross, and the histogram is only −0.003 — a shallow loss of momentum rather than a reversal.
- RSI at 57.3 is mid-range with no divergence on either frame; the August advance has been unwound through price without breaking the indicator's structure.
Bear Case
- Mansfield RS is −11.1% — still underperforming the index, and 1.92 points weaker than a week ago, so the monthly improvement stalled in the past five sessions.
- OBV is below its MA20 with a flat slope on both timeframes (−3.47% on 2y, −29.64% on 90d), tagged early distribution — flow has not confirmed the five-week price recovery.
- ADX 18.8 (90d) and 18.4 (2y) are both under 20: the moving-average alignment is not backed by any measured trend strength.
- The two-year aVWAP $1.80 sits 8.6% overhead and coincides exactly with the August 26 high, so the first meaningful resistance is a confluence rather than a single level.
- MACD dead cross on September 2, 2026 on both frames, with the histogram negative at −0.003.
- ATR at 5.86% of price is high; this week alone produced closes of −5.8% and +8.4%, and as a uranium developer the stock reprices on announcements and on the uranium price rather than on chart structure.
Scenarios
| Scenario | Probability | Path | Trigger / Invalidation |
|---|---|---|---|
| Range persists between the retracement levels | ~45% | Price oscillates between the 61.8% retracement $1.57 and the 23.6% level $1.71 while ADX stays under 20, the SMA20 $1.59 climbs into the range from below and RSI unwinds through time rather than through price. | Trigger: successive closes inside the $1.57–$1.71 band with volume decaying toward the 5,228,994 average. Resolved when either boundary gives way on a daily close. |
| Recovery resumes toward the $1.80 confluence | ~30% | The 38.2% retracement $1.66 holds as a floor, price clears $1.71 and works toward the August 26 high $1.80, where the 0% swing anchor and the two-year aVWAP $1.80 sit together; the upper Bollinger Band $1.82 is the next reference above that. | Trigger: a daily close above $1.71 on volume above the 5,228,994 20-day average, with OBV crossing back above its MA20. Invalidated by a daily close below the 61.8% retracement $1.57. |
| Pullback extends into the swing origin | ~25% | $1.57 gives way, opening the 1×ATR reference $1.56, the 78.6% retracement $1.51 and the $1.44 August 14 swing low; the 2×ATR technical invalidation level $1.47 and the SMA60 $1.47 sit inside that band. | Trigger: a daily close below $1.57. A daily close below $1.47 — the 2×ATR technical invalidation level — ends the structure described on this page. |
Key Levels & Volatility References
| Level | Role | Basis |
|---|---|---|
| $1.82 | Resistance | Upper Bollinger Band (20, 2σ), 9.9% above the close |
| $1.80 | Resistance | Aug 26, 2026 closing high and the 0% anchor of the Aug 14–26 up-swing; the two-year aVWAP ($1.802) sits on the same price, making this the chart's clearest overhead reference |
| $1.71 | Resistance | 23.6% retracement of the Aug 14–26 swing, 3.2% above the close — roughly half an average day's range |
| $1.66 | Current close | Sep 4, 2026 close on 0.81× the 20-day average volume; the 38.2% retracement ($1.661) is effectively the same price |
| $1.63 | Support | SMA5 — the first average beneath the close, 1.9% away |
| $1.59 | Support | SMA20 and Bollinger mid at the same price, 4.4% below the close; the 50% retracement $1.62 sits between it and the close |
| $1.47 | Invalidation | 2×ATR technical invalidation level ($1.465), 11.8% below the close, immediately under the rising SMA60 ($1.470); the 1×ATR reference $1.56 and the 61.8% retracement $1.57 lie between it and the market |
What to Watch
- The $1.80 confluence — the August 26 closing high, the 0% anchor of the retracement grid and the two-year aVWAP all sit at the same price, 8.6% overhead. Three independent references landing on one level is what makes it the chart's defining ceiling rather than an ordinary prior high.
- OBV against its MA20, currently below it and flat on both timeframes. A cross back above with a rising slope would be the first confirmation flow has given the five-week recovery; a continued flat reading while price grinds higher is the textbook non-confirmation.
- Mansfield RS at −11.1% and the sign of the weekly change. The month brought +16.76 points of improvement, the past week gave 1.92 back. Whether that weekly figure turns positive again matters more here than the absolute level, because the zero line is still some distance away.
- ADX 18.8 and whether it climbs through 20 and then 25. Until it does, the upward moving-average alignment describes a range that has drifted higher rather than a trend, and range behaviour is what the scenario table weights most heavily.
- The $1.57–$1.71 band defined by the 61.8% and 23.6% retracements. It spans only fourteen cents, which is under a session and a half of average range — so the resolution of that band is likely to arrive quickly rather than after weeks of compression.