Nick Scali Limited
$17.11 −34.4% from the 52-week high · +33.5% from the 52-week low
This analysis is based on closing-price data as of August 7, 2026. Whether you're researching Nick Scali Limited (NCK) on the ASX or learning how to read stock charts, here are objective support, resistance and technical invalidation levels built from the RSI, MACD and ATR indicators.
Across the two-year window Nick Scali ran from the mid-$15s to a $26.08 fifty-two-week high, then broke down sharply in February 2026 — a decline that left an unfilled gap at $22.88–23.46 dated February 13 and eventually reached a $12.82 fifty-two-week low. Since then the chart has spent months building a base, and the August 7 close of $17.11 sits +33.5% above that low while still −34.4% below the high. The near-term structure has turned constructive — close above SMA5, SMA20 and SMA60, a MACD golden cross on July 29 — but the confirmation layer has not caught up: Mansfield RS is still −17.64% against the S&P/ASX 200 and OBV is tagged early distribution on both timeframes, even as the latest session traded 3.22× its 20-day average volume. Read this page as a study of that gap between price structure and confirmation, not as a verdict.
Snapshot as of August 7, 2026 close
| Metric | Value | Reading |
|---|---|---|
| Close | $17.11 | August 7, 2026 close (AUD) |
| 52-week high / low | $26.08 / $12.82 | −34.4% from high · +33.5% from low |
| SMA 5 / 20 / 60 | $16.70 / $15.87 / $15.36 | Close above all three — aligned |
| Bollinger (20,2) | Upper $17.11 · Mid $15.87 · Lower $14.63 | Width 15.63% — close sits at the upper band |
| aVWAP (2y, anchor Feb 13, 2026) | $16.02 | Price above the long-term anchor |
| aVWAP (90d, anchor Jun 10, 2026) | $15.96 | Price above the short-term anchor |
| RSI(14) | 67.11 (2y) / 67.16 (90d) | Firm, still under the 70 overbought line |
| Mansfield RS vs the S&P/ASX 200 | −17.64% | Underperform, slope rising (prev week −21.41 · prev month −19.68) |
| MACD (12,26,9) | 0.3218 / signal 0.1585 / hist +0.1632 | Golden cross July 29, 2026 — both lines above zero |
| ADX(14) | 23.13 (2y) / 23.61 (90d) | Emerging — below the 25 threshold |
| ATR(14) | $0.66 · 3.84% of price | Volatility reference for level width |
| OBV (2y) | −2,649,557 vs MA20 −2,228,853 | Early distribution · below MA20 (−18.88%) · flat |
| OBV (90d) | −2,693,846 vs MA20 −2,273,142 | Early distribution · below MA20 (−18.51%) · flat |
| Volume | 1,442,377 vs 20-day avg 447,694 | 3.22× average — heaviest expansion of the 90-day window |
| 1× / 2× ATR technical invalidation | $16.45 / $15.80 | Volatility-scaled invalidation references |
| Unfilled gap (2y) | $22.88–23.46 | Resistance gap dated February 13, 2026 |
① Price & Moving Averages
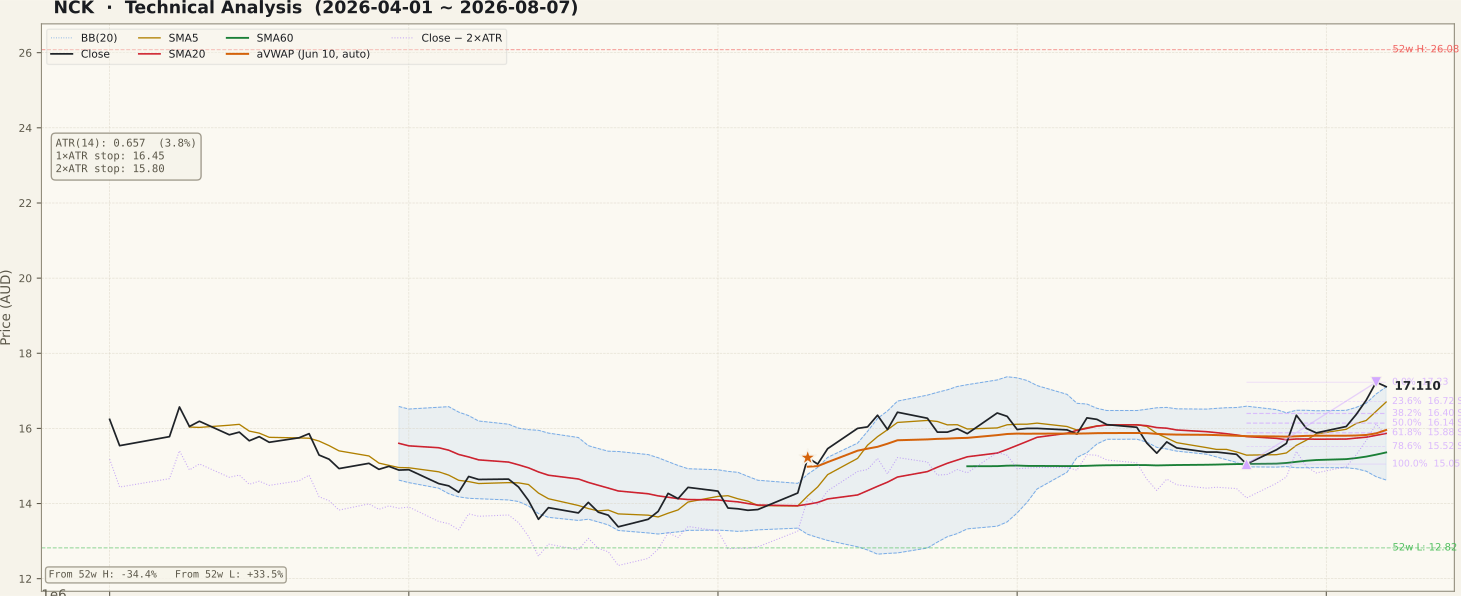
The moving-average stack is in full ascending order: close $17.11 above SMA5 $16.70, above SMA20 $15.87, above SMA60 $15.36. That is the cleanest configuration this chart has shown since the February breakdown, and it is what put NCK on this week's screen. The close also finished fractionally above the upper Bollinger band at $17.11 (band width 15.63%) — an expansion out of a multi-week range rather than a drift along the band. Both anchored VWAPs sit below price: $16.02 from the February 13, 2026 anchor on the two-year chart and $15.96 from the June 10, 2026 anchor on the 90-day chart, so the average holder from either anchor is above water. Overhead, the nearest structure is the 90-day swing high at $17.23 set on August 6, then the February 16 down-swing anchor at $18.43 — a level price now trades beneath, so it functions as overhead structure rather than as footing. Beyond that the chart is thin all the way to the unfilled $22.88–23.46 gap.
② Volume

The August 7 session turned over 1,442,377 shares against a 20-day average of 447,694 — 3.22× normal, and visibly the tallest bar in the 90-day panel. Expansion of that size around a range breakout is usually the confirmation a structure needs, so it deserves precise reading rather than a headline. Two details temper it. First, the 90-day up-swing is anchored at $17.23 on August 6, and the August 7 close of $17.11 finished below that anchor — the heaviest volume of the quarter did not produce a higher close. Second, the price bar itself carries a long upper shadow: the session reached well above where it settled, which is the shape of demand meeting supply intraday rather than of demand clearing it. Heavy volume with a wide range and a close off the highs is a two-sided bar, and it is the least conclusive kind of expansion a chart can print.
③ MACD

MACD registered a golden cross on July 29, 2026 and has widened since: MACD line 0.3218 over signal 0.1585, histogram +0.1632 (two-year values are effectively identical at 0.3211 / 0.1576 / +0.1635). Both lines are above the zero line, which distinguishes this from the deep sub-zero crosses the two-year panel shows through the March–June decline — those were bounces inside a downtrend, this one is happening from a base. The histogram is expanding rather than rolling over, so momentum is still building at the measurement date. Momentum improving from a low base is a real change of state, but MACD is a lagging construction and it says nothing about the relative-strength problem below.
④ RSI

RSI(14) reads 67.16 on the 90-day frame and 67.11 on the two-year frame — firm, in the upper band, but not yet through the 70 overbought line. The 90-day panel shows RSI failing near 70 in early July, easing to the mid-40s through late July, and pushing back up with the current advance; that is a healthy reset rather than a single exhausted run. No RSI divergence is recorded in the data for either timeframe, and the divergence peak fields are null — so there are no specific peaks to cite, and none are invented here. A common beginner error at this reading is to treat a high-60s RSI as a signal in itself; on a stock that has been in a downtrend against its index, RSI strength describes the recent swing only.
⑤ Mansfield Relative Strength

Mansfield RS versus the S&P/ASX 200 reads −17.64%, state underperform, slope rising. The comparison points matter more than the level here: one week ago the same measure was −21.41 and one month ago −19.68, so the change is +3.77 over the week and +2.04 over the month. Because the reading is still below zero, a positive change is improvement toward the benchmark, not acceleration away from it — the stock is losing to the index more slowly, which is a different statement from leading it. The two-year panel makes the scale plain: RS sat firmly above zero through most of 2025, fell through zero in February 2026, and has spent every session since in negative territory. A deeply negative RS is the strongest counterweight on this page, and it is exactly the reading beginners most often wave through when the price panel looks clean.
⑥ ATR & ADX

ATR(14) is $0.66, or 3.84% of the close, and the 90-day panel shows it turning sharply higher on the final bar — the wide-range session mechanically lifted the volatility measure. Scaled from the close, that puts the 1× ATR reference at $16.45 and the 2× ATR technical invalidation level at $15.80, roughly 7.7% below price. A structure this volatile needs correspondingly wide levels; treating a 3.84% daily range as if it were a 1% stock is how people get shaken out of their own thesis. ADX(14) reads 23.61 on the 90-day frame (23.13 on the two-year), tagged emerging — above the 20 line but not yet the 25 that marks a trend as established. ADX measures strength, not direction, so this is a trend that is forming rather than one already running.
⑦ OBV

On-balance volume disagrees with the price panel, and it does so on both timeframes. The 90-day reading is −2,693,846 against a 20-day average of −2,273,142 — −18.51% below its own average, state early distribution, slope flat. The two-year reading is the same picture: −2,649,557 versus −2,228,853, a −18.88% shortfall, also early distribution and flat. This is the classic non-confirmation: price is at the top of its three-month range while cumulative volume flow is below its own trend and sinking. The August 7 bar is a direct illustration — the quarter's largest turnover arrived on a session that closed lower than the day before, so that volume was subtracted from OBV rather than added to it. The chart annotation flags an OBV bearish divergence, and until OBV reclaims its MA20 the volume expansion described in ② is unconfirmed as demand.
Bull Case vs Bear Case
Bull Case
- Full ascending moving-average order: close $17.11 > SMA5 $16.70 > SMA20 $15.87 > SMA60 $15.36.
- MACD golden cross on July 29, 2026 with both lines above zero and the histogram expanding to +0.1632.
- Mansfield RS improving from −21.41 a week ago and −19.68 a month ago to −17.64, slope rising.
- Close at the upper Bollinger band ($17.11) with width at 15.63% — range expansion after a long base.
- Both aVWAP anchors sit below price ($16.02 from Feb 13, $15.96 from Jun 10).
- Price is +33.5% off the $12.82 fifty-two-week low, and RSI at 67.16 is firm without being overbought.
Bear Case
- Mansfield RS is still −17.64% versus the S&P/ASX 200 — negative in every session since February.
- OBV tagged early distribution on both timeframes, −18.88% and −18.51% below its MA20, slope flat.
- The quarter's heaviest volume (3.22× average) produced a close of $17.11, below the August 6 swing anchor at $17.23.
- Price remains −34.4% under the $26.08 high, with the unfilled $22.88–23.46 gap and the $18.43 down-swing anchor overhead.
- ADX 23.61 is below the 25 line — trend strength is emerging, not established.
- ATR at 3.84% of price puts the 2× ATR invalidation reference $15.80, about 7.7% away — a wide structure to be wrong in.
Scenarios
| Scenario | Probability | Path | Trigger / Invalidation |
|---|---|---|---|
| Confirmed expansion | 40% | Closes hold above the August 6 anchor at $17.23 while volume stays above the 447,694 average and OBV climbs back over its MA20. The next structural reference overhead is the February 16 down-swing anchor at $18.43. | Confirmed by consecutive closes above $17.23 with OBV rising; negated by a close back under the 23.6% retracement at $16.72. |
| Range digestion | 40% | The wide-range bar is absorbed sideways between the $15.87 SMA20 / Bollinger midline and the $17.23 anchor, with ADX drifting rather than pushing through 25. This is the common outcome after a two-sided high-volume session. | Defined by closes inside $15.87–17.23; resolved either way by a close outside that band on above-average volume. |
| Failed expansion | 20% | Price loses the 50% retracement at $16.14 and then the $15.87–15.88 confluence, marking August 7 as a supply event rather than a breakout. The still-negative RS reading is what makes this scenario more than academic. | Triggered by a close below $15.87; the 2× ATR technical invalidation level at $15.80 is breached on the way. |
Key Levels & Volatility References
| Level | Role | Basis |
|---|---|---|
| $18.43 | Overhead structure | Two-year down-swing anchor low, February 16, 2026 (0% of that swing) — price now trades below it |
| $17.23 | Resistance | 90-day up-swing anchor high, August 6, 2026 (0% of that swing) — nearest overhead reference |
| $17.11 | Current close | August 7, 2026 close; coincides with the upper Bollinger band at $17.11 |
| $16.72 | Support retest zone | 23.6% retracement of the July 24 – August 6 up-swing; SMA5 sits alongside at $16.70 |
| $16.45 | Volatility reference | 1× ATR below the close (ATR $0.66) |
| $16.14 | Support | 50% retracement of the same up-swing |
| $15.87–15.88 | Support confluence | SMA20 and Bollinger midline at $15.87 with the 61.8% retracement at $15.88 |
| $15.80 | Technical invalidation (2× ATR) | Close − 2× ATR(14); about 7.7% below the August 7 close |
What to Watch
- Follow-through volume. Whether turnover stays above the 20-day average of 447,694 in the sessions after the 3.22× bar, or fades straight back to the 200k–500k range the 90-day panel shows as normal.
- OBV versus its MA20. The 90-day gap is −18.51% and the two-year gap −18.88%. A recovery of OBV above its average would convert the volume expansion from ambiguous into confirming; a further slide would harden the early-distribution tag.
- Mansfield RS relative to zero. From −17.64%, with +3.77 gained over the past week, the question is whether the improvement continues toward the zero line or stalls in the high teens as it did through June and July.
- ADX through 25. At 23.61 the trend is emerging; a move above 25 would mark it as established, while a fade back under 20 would describe the last two weeks as range noise.
- The $15.87–15.88 confluence. SMA20, the Bollinger midline and the 61.8% retracement sit within a cent of each other — the tightest structural shelf on the 90-day chart.
Conclusion
Past Analyses of This Stock same ticker · newest first
Other signals from this issue same publication date · 6 stocks
SwingRoo · swingroo.com · S&P/ASX 300 screened weekly