James Hardie Industries PLC
This analysis is based on closing-price data as of August 7, 2026. Whether you're researching James Hardie Industries PLC (JHX) on the ASX or learning how to read stock charts, here are objective support, resistance and technical invalidation levels built from the RSI, MACD and ATR indicators.
JHX is most of the way back from a crash. The two-year chart shows a slide from the mid-$50s through the first half of 2025, then a single violent session on August 20, 2025 that left a gap between $33.20 and $44.20 which has never been filled, and a 52-week low at $24.41 in November 2025. Since then the stock has ground higher for eight months, turned positive on relative strength in June 2026, and in the first week of August pushed from the $37.21 swing low of July 31 to a $43.18 close — back inside the upper half of that old gap and the highest close since it opened. The tension in this chart is that the structure is genuinely strong while the short-term reading is hot: RSI(14) is 74.4, the close sits above the upper Bollinger Band, and the price is 14.4% above its own 20-day average.
Snapshot as of August 7, 2026
| Item | Value | Read |
|---|---|---|
| Close | $43.18 | Top of the current swing (0% fib anchor, Aug 7) — but still below the 52-week high |
| 52-week range | $24.41 – $45.98 | −6.1% from the high · +76.9% off the low |
| SMA 5 / 20 / 60 | $40.22 / $37.73 / $34.66 | Bullish alignment, all rising; close 14.4% above SMA20 (extended) |
| Bollinger (20) | $41.75 / $37.73 / $33.71 · width 21.31% | Close above the upper band — stretched, bands expanding |
| aVWAP | 2y $30.78 (Aug 20, 2025) · 90d $34.76 (May 21, 2026) | Price well above both anchors — average cost from each is far below |
| RSI(14) | 74.4 (90d) · 74.4 (2y) | Overbought; a shallow bearish divergence is flagged on the 90-day frame |
| Mansfield RS (vs the S&P/ASX 200) | +28.5% | Outperforming and accelerating (prior week +13.9, prior month +8.4) |
| MACD (12,26,9) | 1.434 / signal 0.995 / hist +0.440 | Golden cross Aug 4, 2026, well above zero; histogram widening |
| ADX(14) | 22.1 (90d) · 21.7 (2y) | Emerging trend — still under the 25 confirmation line |
| ATR(14) | $1.22 (2.8% of price) | Volatility expanding with the August thrust |
| OBV | 2y: above MA20, flat (+11.2% vs MA20) · 90d: above MA20, rising (+36.9%) | Near-term accumulation; the two-year series has gone flat, not down |
| Volume (last vs 20-day avg) | 2.70M vs 1.71M · 1.58x | Above average on the thrust, short of a 2x spike |
| Unfilled gaps | Overhead $33.20–$44.20 (Aug 20, 2025) · beneath $40.82–$42.05 (Aug 7), $37.89–$39.00 (Aug 4), $35.36–$36.62 (Jul 23) | Price is trading inside the 2025 gap; three fresh gaps form a stepped shelf below |
| Technical invalidation (ATR-based) | 1×ATR $41.96 · 2×ATR $40.74 | 2×ATR level sits 5.6% below Friday's close |
① Price & Moving Averages
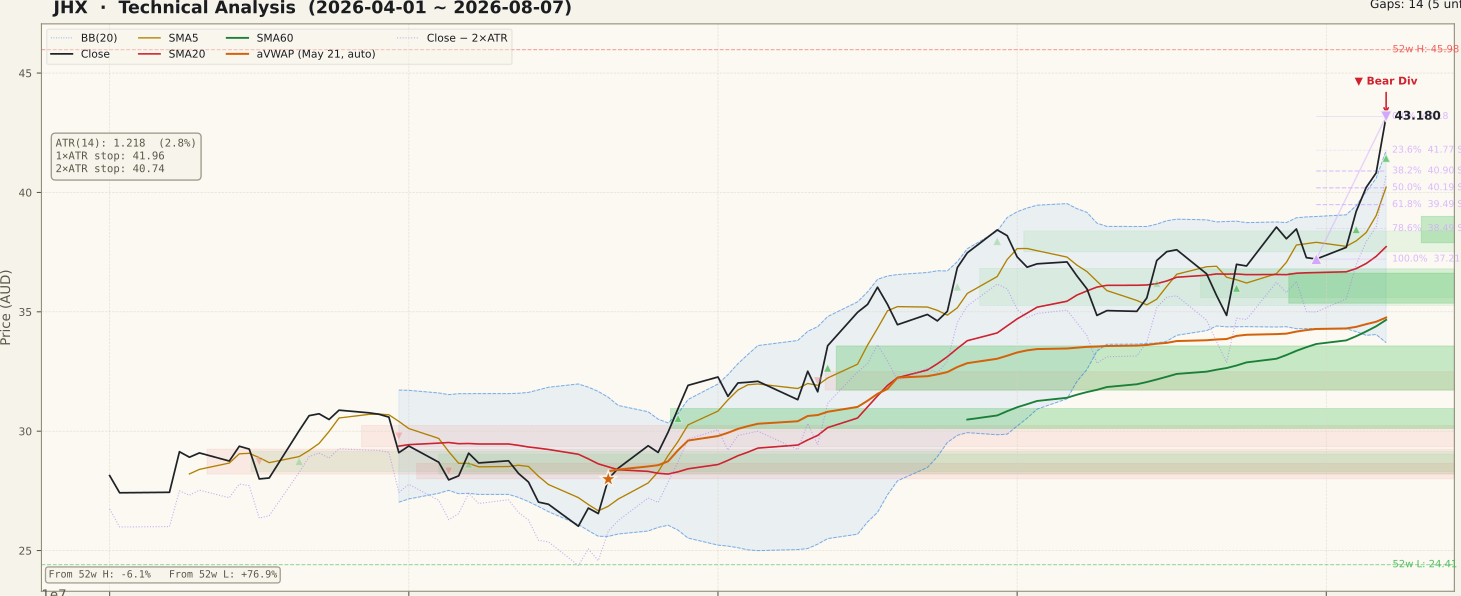
The moving averages are in textbook bullish order: close $43.18 above SMA5 $40.22, SMA5 above SMA20 $37.73, SMA20 above SMA60 $34.66, and all three rising. On the 90-day frame the shape is a staircase — a base near $28 in April and May, a step up through June, a month of digestion between roughly $35 and $38 in July, then a near-vertical August leg. That August leg is where the caution lives: the close is above the upper Bollinger Band at $41.75, band width has expanded to 21.31%, and price is 14.4% clear of its own 20-day average. Advances that separate this far from the mean usually resolve through either sideways time or a fast giveback.
Retracement references for the July 31 → August 7 swing ($37.21 → $43.18) sit at $41.77 (23.6%), $40.90 (38.2%), $40.19 (50%), $39.49 (61.8%) and $38.49 (78.6%), with the 100% anchor at $37.21. Three unfilled gaps sit underneath as structure: $40.82–$42.05 from August 7, $37.89–$39.00 from August 4 and $35.36–$36.62 from July 23. Overhead, the single most important feature on the two-year chart is the unfilled August 20, 2025 gap spanning $33.20 to $44.20 — price has now climbed back into its upper reaches, so the $44.20 edge is the next structural line, and the 52-week high at $45.98 sits above it. Note that ASX names can also print gaps for procedural reasons such as a trading halt, so a gap on this chart is a level to watch rather than proof of a fundamental event by itself.
② Volume

Friday turned over 2.70M shares against a 1.71M 20-day average — 1.58x. That is real participation behind the thrust and comfortably better than a drift higher on thin turnover, which is the classic unconfirmed breakout that beginners tend to trust. It is not, however, a 2x-plus climax bar; the 90-day volume panel shows the two genuine spikes of this window landing in late May and mid-June, not in August. JHX is a large, liquid ASX name, so the volume reading itself is dependable — there is no thin-stock caveat here, and no slippage warning of the kind that applies to microcaps.
③ MACD

MACD crossed back above its signal line on August 4, 2026 and has widened quickly since: MACD 1.434 against signal 0.995, histogram +0.440 and growing. Two details matter. First, this cross happened well above the zero line, after the July pullback took the histogram negative without ever dragging MACD itself under zero — that pattern is a trend that paused rather than a trend that broke. Second, MACD is now back near the top of its 90-day range, which means the indicator is confirming momentum that price has already delivered, not giving an early read. A histogram that flattens out here would be the first quiet sign that the August thrust is losing its push.
④ RSI

RSI(14) reads 74.4 on both the 90-day and two-year frames — above the 70 overbought line, and the highest reading of the past year on this chart. The 90-day data flags a regular bearish divergence: the June 29 peak paired price $38.43 with RSI 75.01, while the August 7 peak paired a much higher price of $43.18 with a slightly lower RSI of 74.42. Read that honestly. The price high is decisively higher while the RSI high is lower by 0.59 of a point — a divergence that thin is a hairline non-confirmation, not a top signal, and it is exactly the kind of reading that gets over-interpreted. A divergence only means something once price confirms it by breaking a level; until then, RSI pinned in the 70s is just as consistent with a strong trend as with an exhausted one.
⑤ Mansfield Relative Strength

Mansfield RS versus the S&P/ASX 200 stands at +28.5%, on the outperform side of zero and rising. The acceleration is the strongest single feature of this chart: the reading was +13.9 a week ago and +8.4 a month ago, so the weekly change is +14.5 points and the monthly change +20.0 points — positive and speeding up on both horizons. The two-year panel puts that in context. RS was deeply negative from mid-2025 through early 2026, spending the better part of a year below −20, and only crossed above zero in June 2026. This is a stock that has moved from sustained laggard to clear index leader inside two months, which is the backdrop under which advances tend to hold rather than fade.
⑥ ATR & ADX

ADX(14) reads 22.1 on the 90-day frame and 21.7 on the two-year frame — the "emerging" band, below the 25 line that marks a confirmed trend regime. That is a genuine mismatch worth naming: price has run hard, yet trend strength has not confirmed, because the July chop flattened directional movement and ADX lags. ADX measures strength, not direction, so a low reading here says "not yet established", not "bearish". ATR(14) is $1.22, or 2.8% of price, and expanding with the August range. That ATR sets the objective risk arithmetic on this chart: the 1×ATR reference is $41.96 and the 2×ATR technical invalidation level is $40.74, which sits 5.6% below Friday's close.
⑦ OBV (On-Balance Volume)

The two timeframes disagree in a way worth reading carefully. On the 90-day frame OBV is in accumulation — above its 20-day average by 36.9% and rising, pushing to a new high alongside price, which is volume confirming the August leg rather than lagging it. On the two-year frame OBV is tagged early accumulation: above its MA20 by 11.2%, but with a flat slope. In plain terms, the recent advance has been well supported, while the longer volume series has not yet made the same progress as price — it has stalled sideways since the February 2026 peak rather than rolling over. That is a mild non-confirmation on the long frame, not a distribution signal, and it would resolve constructively if the two-year OBV slope turns up from here.
Bull Case
- Full bullish alignment — close $43.18 > SMA5 $40.22 > SMA20 $37.73 > SMA60 $34.66, all rising.
- Mansfield RS +28.5% vs the S&P/ASX 200 and accelerating: +14.5 pts on the week, +20.0 pts on the month, after a year of underperformance.
- MACD golden cross on Aug 4 taken well above the zero line, histogram +0.440 and still widening.
- 90-day OBV in accumulation, 36.9% above its MA20 and making new highs with price.
- Volume 1.58x the 20-day average on the August 7 advance — the move carries participation.
- Three unfilled gaps beneath ($40.82–$42.05, $37.89–$39.00, $35.36–$36.62) form a stepped support structure, and price is +76.9% off the $24.41 low.
Bear Case
- RSI(14) at 74.4 on both frames — overbought, and the hottest reading in a year.
- Close is above the upper Bollinger Band ($41.75) and 14.4% above SMA20 — statistically stretched.
- Regular bearish RSI divergence flagged: price $38.43 → $43.18 while RSI eased 75.01 → 74.42.
- ADX 22.1 has not confirmed a trend regime above 25, despite a $37.21 → $43.18 run in five sessions.
- Overhead supply is real: the $44.20 top edge of the unfilled 2025 gap, then the 52-week high $45.98 — the close is still 6.1% below that high, so this is not new-high territory yet.
- Two-year OBV slope is flat while price surges, and price is far above both aVWAP anchors ($30.78 from Aug 2025, $34.76 from May 2026) — the long-frame volume base has not kept pace.
Scenarios
| Scenario | Probability | Path | Trigger / Invalidation |
|---|---|---|---|
| Pause, then press the 2025 gap | 40% | Price consolidates above the $42.05 gap edge / $41.77 retracement instead of giving the August leg back, works off the RSI extreme through sideways time, then tests the $44.20 top of the 2025 gap and the $45.98 52-week high above it. | Trigger: daily closes above $42.05, then a close above $44.20 on volume at or above the 20-day average. Invalidated by a daily close below $40.74 (2×ATR). |
| Overbought giveback to the retracement band | 40% | The stretch above the upper band resolves downward: price fades into the $40.90–$39.49 band (38.2–61.8% of the July 31 → Aug 7 swing), where the August 4 gap at $39.00–$37.89 and the rising SMA20 $37.73 sit as the next shelf. The larger uptrend stays intact if that zone acts as a support retest zone. | Trigger: a close back inside the Bollinger Bands with $42.05 lost. This path turns into the failure case on a close below $40.74. |
| Failed thrust | 20% | The bearish RSI divergence gets its price confirmation: the August gap at $40.82–$42.05 fills and does not recover, the 2×ATR invalidation level goes, and price works back toward the $37.21 swing anchor and the July range it came from. | Trigger: a daily close below $40.74 on above-average volume; loss of $37.21 would confirm the August leg as a false start. |
Key Levels & Volatility References
| Price | Role | Basis |
|---|---|---|
| $45.98 | Upside resistance level | 52-week high (August 2025) — 6.1% above Friday's close |
| $44.20 | Upside resistance level | Top edge of the unfilled August 20, 2025 gap ($33.20–$44.20) — the next structural line overhead |
| $43.18 | Current close | Fri, Aug 7 close · 0% anchor of the current up-swing (Jul 31 → Aug 7) |
| $42.05 | Support | Top edge of the August 7 gap ($40.82–$42.05) — first shelf beneath the close |
| $41.96 | 1×ATR volatility reference | Close − 1×ATR(14) · one average day's range below |
| $41.77 | Support | 23.6% retracement of the Jul 31 → Aug 7 swing; the upper Bollinger Band ($41.75) coincides |
| $40.74 | Technical invalidation (2×ATR) | Close − 2×ATR(14) · 5.6% below Friday's close — a daily close beneath says the August thrust has failed on this chart's own volatility terms |
What to Watch
- The $42.05 gap edge. Whether the August 7 gap ($40.82–$42.05) stays open on a closing basis is the cleanest single tell — gaps that survive their first test tend to become shelves, gaps that fill immediately tend to mark exhaustion.
- $44.20, the 2025 gap top. Unfilled gaps act as both magnets and resistance; how price behaves at that edge — clean push versus stall on fading turnover — will say more than any indicator here.
- Price confirmation for the RSI divergence. A 0.59-point lower RSI peak means nothing on its own. It only becomes evidence if price loses a level while RSI keeps making lower peaks.
- ADX crossing 25. Trend strength catching up to price would resolve the current mismatch; ADX stuck near 22 while price stays extended is the less comfortable combination.
- The two-year OBV slope. It is flat, not falling. Turning up would align the long-frame volume picture with the 90-day accumulation read.
- Any outsized single-day move with news. The August 7 session gapped higher and closed at the top of its range; ASX reporting-season announcements and trading halts can produce exactly that shape, so weigh any fundamental catalyst before reading such a candle as pure chart structure.