Reece Limited
This analysis is based on closing-price data as of August 7, 2026. Whether you're researching Reece Limited (REH) on the ASX or learning how to read stock charts, here are objective support, resistance and technical invalidation levels built from the RSI, MACD and ATR indicators.
Reece closed Friday at $17.30, finishing above its upper Bollinger Band ($17.18) and just 0.9% under the 52-week high of $17.45 — the culmination of a year-long repair that has carried the stock 70.6% off the $10.14 low. The two-year chart frames why that matters: this is a stock that fell from the high $20s through 2024–2025, bottomed in the second half of 2025, and has since rebuilt a rising moving-average stack with Mansfield relative strength swinging from deeply negative to +21.3% versus the S&P/ASX 200. The near-term picture is more nuanced than the headline breakout suggests. The last five weeks have been a sideways digestion between roughly $16.09 and $17.30, and the push back to the highs has come with a lower RSI peak than the June high — a textbook bearish divergence shape — while ADX at 18.3 still reads as a range rather than an established trend.
Snapshot as of August 7, 2026
| Item | Value | Reading |
|---|---|---|
| Close | $17.30 | −0.9% from 52w high · +70.6% from 52w low |
| 52-week range | $10.14 – $17.45 | At the very top of the yearly range |
| SMA 5 / 20 / 60 | $16.88 / $16.24 / $15.47 | Bullish alignment — close above all three, stack rising |
| Bollinger (20) | $17.18 / $16.24 / $15.31 | Band width 11.5%; close finished above the upper band — stretched |
| aVWAP (2y anchor Aug 25, 2025) | $12.69 | Price far above — long-horizon average cost well below the market |
| aVWAP (90d anchor Jun 10, 2026) | $16.20 | Price above — recent positioning is onside |
| RSI(14) | 69.9 | At the 70 line, with a bearish divergence versus the June 30 peak |
| Mansfield RS (vs the S&P/ASX 200) | +21.3% | Outperforming and accelerating (+4.48 w/w, +4.60 vs a month ago) |
| MACD (12,26,9) | 0.31 / 0.21 / +0.10 | Golden cross Aug 4, 2026 — histogram positive above zero |
| ADX(14) | 18.3 (90d) / 17.9 (2y) | Below 20 — ranging; no established trend behind the move |
| ATR(14) | $0.46 (2.7%) | Contained daily range for a $17 share price |
| OBV (2y / 90d) | early accumulation / early accumulation | Both above their MA20 but flat in slope; the 2y line is still deeply negative |
| Volume vs 20d avg | 1.58× | 817,120 shares against a 518,571 twenty-day average |
| 1×ATR / 2×ATR technical invalidation | $16.84 / $16.38 | Volatility-based structural reference levels below the close |
① Price & Moving Averages
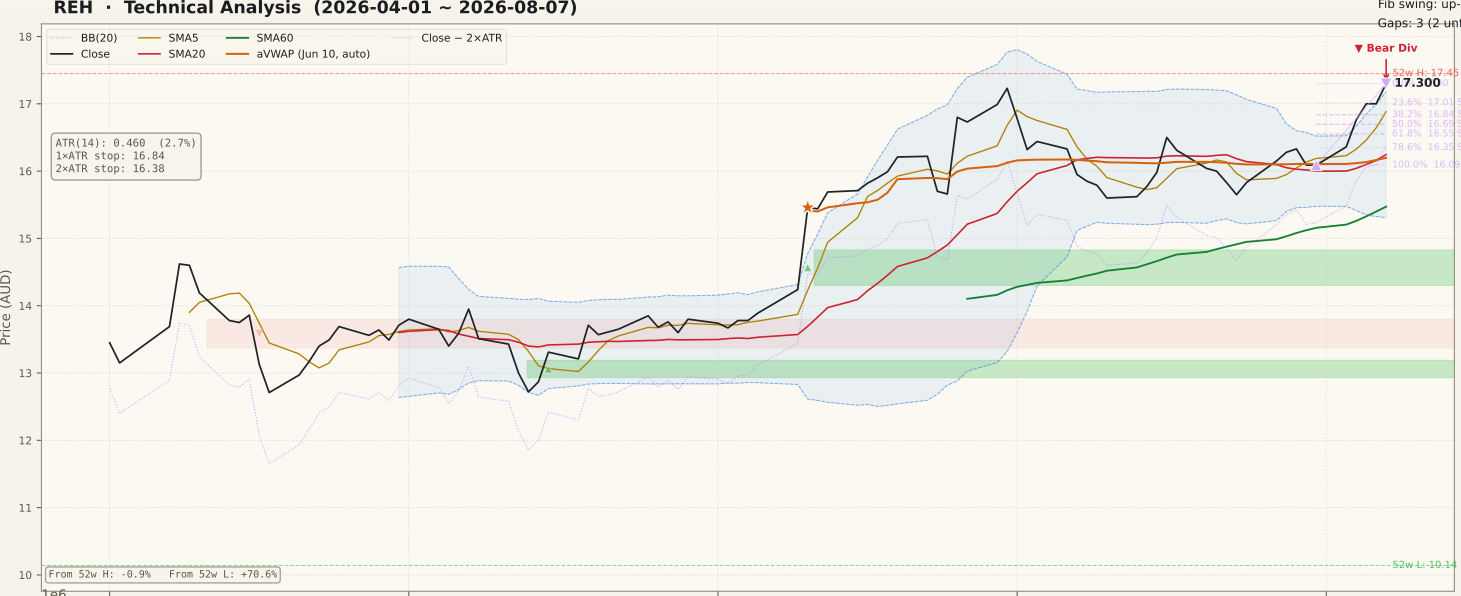
REH_price-90d-2026-08-09.svgThe 90-day window has two distinct halves. Through April and May the stock drifted between roughly $12.70 and $14.60; from the June 10 gap higher it re-rated in a near-vertical leg to the June 30 peak at $17.23, and the five weeks since have been sideways digestion rather than continuation. Friday's $17.30 close is the first print above that June peak, which technically resolves the range to the upside — but by a margin of seven cents, and with the 52-week high at $17.45 still overhead.
The moving-average stack is unambiguously constructive: the close sits above a rising SMA5 ($16.88), which sits above the SMA20 ($16.24), which sits above the SMA60 ($15.47). On the two-year chart that stack was inverted for most of 2025, so the current configuration is a genuine regime change rather than a one-week wobble. The counterweight is extension: at $17.30 the close finished above the upper Bollinger Band at $17.18, with band width at 11.5%. Band-walking is what strong trends do, but a close outside the band also means price is roughly a full ATR above its 20-day mean, and a retracement into the $17.01–$16.84 area would be routine behaviour rather than structural damage. Note too that the two-year Fibonacci ladder (anchored $13.60 on May 28 to $16.22 on June 22) now sits entirely below the market, so the relevant retracement grid is the 90-day one built from the July 31 low at $16.09.
② Volume

REH_volume-90d-2026-08-09.svgFriday traded 817,120 shares against a 20-day average of 518,571 — a Vol/Avg ratio of 1.58×. That is meaningful participation on the day the range resolved, and it is the kind of confirmation a breakout attempt needs; it is not, however, the 2×-plus conviction spike that marks an unambiguous institutional footprint. The 90-day volume panel shows two much larger bars — mid-June and late June, both around the initial re-rating leg — so the market has produced heavier days on this chart recently than the one that took price to new highs.
Turnover of roughly half a million shares a day at a $17 share price puts REH comfortably clear of the thin-liquidity problems that distort volume readings in ASX small caps, so the volume and OBV panels here can be taken at closer to face value. The honest reading is "adequate, not emphatic": above-average confirmation on the breakout day, without the volume expansion that would settle the question outright.
③ MACD

REH_macd-90d-2026-08-09.svgMACD crossed back above its signal line on August 4, 2026, with the line at 0.31, the signal at 0.21 and the histogram positive at +0.10. Structurally this is a second-generation cross: the July peak in the MACD line was far higher, the indicator then rolled over through five weeks of red histogram bars as price consolidated, and this cross is the recovery from that dip. Crosses that form above zero, as this one does, sit inside an existing up-cycle rather than launching a new one — they tend to have less room ahead of them than the deep sub-zero variety.
What is genuinely constructive is that the histogram has flipped from a sustained red sequence to a widening green one exactly as price cleared the range. What would undermine it is a histogram that peaks and contracts within a few sessions while price stalls under $17.45 — the same fading-thrust shape that ended the July advance.
④ RSI

REH_rsi-90d-2026-08-09.svgThis is the panel that argues with the price chart. RSI(14) reads 69.9, essentially at the overbought threshold, and the chart flags a regular bearish divergence: on June 30 price peaked at $17.23 with RSI at 78.4, while Friday's higher price high of $17.30 came with RSI at only 69.9 (the two-year panel shows the same shape at 77.9 and 69.9). Price made a higher high; momentum did not follow. That is the classic warning that the second push is being driven by fewer, smaller advances than the first.
Three qualifications keep this even-handed. First, a divergence is a possibility, not a verdict — it requires confirmation from price, meaning an actual rejection and a break of structure, and divergences frequently dissolve when a stock simply keeps going. Second, part of the RSI decline is mechanical: five weeks of sideways trade drains an oscillator regardless of what happens next. Third, in a genuine uptrend RSI can sit in the 60–80 band for extended stretches, so a 69.9 print is not itself a reversal call. The clean cancellation signal would be RSI pushing to a new high above 78.4 on any move through $17.45; the confirmation of the bearish case would be price failing at the 52-week high while RSI turns down from here.
⑤ Mansfield Relative Strength

REH_rs-90d-2026-08-09.svgRelative strength is the strongest single reading on this chart. Mansfield RS versus the S&P/ASX 200 stands at +21.3% with a rising slope — firmly in outperform territory. The trajectory reinforces the level: a week ago the reading was +16.80 and a month ago +16.68, so the change is +4.48 week-over-week and +4.60 month-over-month. Positive and rising is the accelerating quadrant, and notably the acceleration happened during the five-week price consolidation, which means REH gained ground on the index while going sideways.
The two-year RS panel puts this in proper context. Relative strength was pinned below zero for the whole of 2025, reaching roughly −45 at the worst of it, crossed back above zero in the first quarter of 2026, and has been building in positive territory since. Sustained positive, rising RS is the backdrop in which breakout attempts have the best odds — it is the one input here that is unambiguous. A rollover back toward zero would remove the leadership premise that underwrites the rest of the bullish read.
⑥ ATR & ADX

REH_atr_adx-90d-2026-08-09.svgATR(14) is $0.46, or 2.7% of price — a contained daily range that has drifted lower through the consolidation after spiking during the June re-rating. This is the number that sizes the structural references on this page: the 1×ATR level sits at $16.84 and the 2×ATR technical invalidation level at $16.38, both measured from Friday's close. Because volatility has compressed, those references sit unusually close to the market — the invalidation level is only 5.3% below the close, tighter than most charts of this kind.
ADX is the caution flag. At 18.3 on the 90-day panel (17.9 on the two-year) it sits below the 20 line, which reads as ranging — the indicator has not registered a directional trend at all, and it has been falling since April. ADX measures strength, not direction, so a low reading alongside a rising price simply says the advance has not yet been forceful or sustained enough to qualify as a trend. A move above 20 and then 25 while price holds above the breakout zone would upgrade this from "range resolution" to "trend"; ADX stalling below 20 while price slips back under $17.18 would say the five-week range is still in charge.
⑦ OBV

REH_obv-90d-2026-08-09.svgBoth timeframes read early accumulation, and both carry the same qualifier: flat slope. On the 90-day window OBV sits at 8.29M against a 20-day average of 6.82M, a +21.5% divergence above its MA — the cumulative line rose sharply through the June leg and has since gone flat while price ground sideways. On the two-year window OBV is at −40.2M against a −41.6M average, a +3.5% divergence — above its MA, but the absolute line is still deeply negative and has barely recovered from the collapse that accompanied the 2025 decline.
The chart flags this explicitly as a bearish non-confirmation: price is at new highs while OBV lags. That is the honest counterweight to the breakout. Volume flow supported the June re-rating but has not confirmed the push to the 52-week high, and the multi-year volume base destroyed in 2025 has not been rebuilt. It does not negate the price structure, but it does mean the move is resting on price and relative strength rather than on demonstrable flow. The resolution to watch is whether OBV starts printing higher highs alongside price over the coming sessions.
Bull Case
- Full bullish alignment: close $17.30 above a rising SMA5 $16.88 > SMA20 $16.24 > SMA60 $15.47.
- Five-week range resolved upward — close above the June 30 peak ($17.23) and above the upper Bollinger Band ($17.18).
- Mansfield RS +21.3% vs the S&P/ASX 200 and accelerating (+4.48 w/w, +4.60 m/m) — leadership through the consolidation.
- MACD golden cross on Aug 4 with the histogram flipping green (+0.10) as price cleared the range.
- Range resolution carried 1.58× average volume — above-average participation on the day it mattered.
- Price above both anchored VWAPs ($12.69 two-year, $16.20 90-day) — average cost sits well below the market.
Bear Case
- Regular bearish RSI divergence: price $17.23 → $17.30 higher high, RSI 78.4 → 69.9 lower high.
- ADX 18.3 below the 20 line — the advance has not registered as a trend at all.
- Close finished outside the upper Bollinger Band with width at 11.5% — extended relative to the $16.24 mean.
- OBV bearish non-confirmation on both timeframes; the two-year line remains at −40.2M and flat.
- RSI 69.9 at the overbought line after a 70.6% recovery off the 52-week low — extension risk.
- Heavy legacy supply above: three unfilled downside gaps from the 2024–25 decline at $21.03–$21.90, $23.31–$23.88 and $25.58–$26.26 remain far overhead.
Scenarios
| Scenario | Probability | Path | Trigger / Invalidation |
|---|---|---|---|
| Breakout confirmed | ~40% | Clears the 52-week high at $17.45 and walks the upper band higher; the RSI divergence cancels via a new momentum high above 78.4. The next mapped structure on the two-year chart is the unfilled gap zone at $21.03–$21.90, with untested supply from the 2025 decline between here and there. | Trigger: daily close above $17.45 on ≥1.5× average volume, with ADX turning up through 20. Invalidated by a close back below $17.01. |
| Retest, then resume | ~35% | The stretched close mean-reverts into the $17.01–$16.84 support retest zone (23.6–38.2% of the $16.09 → $17.30 up-swing, where the SMA5 also sits), a higher low forms, and the 52-week high is challenged again from a less extended base. | Trigger: a fade from $17.45 on shrinking volume. Invalidated by a close below the 61.8% retracement at $16.55. |
| Divergence confirms | ~25% | Rejection at $17.45 validates the RSI divergence; price falls back inside the July range, losing the SMA20 / Bollinger mid at $16.24, the 90-day aVWAP at $16.20 and the July 31 swing low at $16.09. The unfilled June 10 gap at $14.30–$14.83 becomes the next reference below. | Trigger: daily close below the 2×ATR technical invalidation level at $16.38 — that ends the current swing structure. |
Key Levels & Volatility References
| Level | Role | Basis |
|---|---|---|
| $17.45 | Resistance | 52-week high — the last defined barrier on the chart |
| $17.30 | Current close | Aug 7 close; 0% of the Jul 31 → Aug 7 up-swing |
| $17.18 | Resistance | Upper Bollinger Band (20, 2σ) — Friday closed above it |
| $17.01 | Support | 23.6% retracement of the $16.09 → $17.30 up-swing |
| $16.84 | Support | 38.2% retracement, converging with the SMA5 at $16.88 and the 1×ATR reference at $16.84 |
| $16.55 | Support | 61.8% retracement (50% sits just above at $16.69) |
| $16.38 | Invalidation | 2×ATR technical invalidation level below the Aug 7 close (5.3%); the SMA20 / Bollinger mid $16.24, 90-day aVWAP $16.20 and swing low $16.09 sit just beneath |
What to Watch
- A daily close above $17.45 on at least 1.5× average volume — the confirmation that turns a seven-cent range resolution into a genuine 52-week breakout.
- Whether RSI prints a new high above 78.4 on that move — that cancels the bearish divergence outright; a lower momentum high with price rejected at $17.45 confirms it.
- ADX crossing 20 and then 25 — until it does, this chart is technically a range, not a trend.
- Behaviour on any dip into $17.01–$16.84 — a higher low in that band keeps the up-swing structure intact; losing $16.55 (61.8%) weakens it.
- Whether OBV starts making higher highs alongside price — the bearish non-confirmation on both timeframes is the main unresolved item on this chart.