Tabcorp Holdings
This analysis is based on closing-price data as of August 7, 2026. Whether you're researching Tabcorp Holdings (TAH) on the ASX or learning how to read stock charts, here are objective support, resistance and technical invalidation levels built from the RSI, MACD and ATR indicators.
Tabcorp Holdings finished the week at $0.89, still 25.2% below its 52-week high of $1.19 but 34.8% above the $0.66 low that followed a violent May decline. One session dominates the two-year chart: the gap of May 7, 2026, which left an unfilled window between $0.99 and $1.12 and marked the start of a fall from the $1.17 swing high of May 1 to $0.68 by May 18. What has followed is a slow, orderly repair — the close now sits above a rising SMA20 ($0.88) and SMA60 ($0.82), above the 90-day anchored VWAP at $0.79, and between the 38.2% ($0.86) and 50% ($0.92) retracements of that down-swing. The near-term picture is more guarded: the RSI carries a bearish divergence, MACD registered a dead cross on Friday, and Mansfield relative strength versus the S&P/ASX 200 is still negative at −8.9%, so this reads as a pause inside a recovery range rather than a trend that has proved itself.
Snapshot as of August 7, 2026
| Item | Value | Reading |
|---|---|---|
| Close | $0.89 | −25.2% from 52w high · +34.8% from 52w low |
| 52-week range | $0.66 – $1.19 | Roughly mid-range after the May decline and partial repair |
| SMA 5 / 20 / 60 | $0.89 / $0.88 / $0.82 | Rising stack; close above the SMA20 and SMA60, fractionally under the SMA5 |
| Bollinger (20) | $0.93 / $0.88 / $0.84 | Band width 10.2% — compressed versus May; price in the upper half |
| aVWAP (2y anchor Aug 27, 2025) | $0.92 | Price below — the long-horizon average holder is under water |
| aVWAP (90d anchor May 7, 2026) | $0.79 | Price above — positioning since the gap session is onside |
| RSI(14) | 54.0 | Neutral, just above the 50 line; bearish divergence flagged |
| Mansfield RS (vs the S&P/ASX 200) | −8.9% | Underperforming; +2.1 better than a month ago (−10.9), −3.7 week-over-week |
| MACD (12,26,9) | 0.0152 / 0.0153 / −0.00003 | Dead cross Aug 7, 2026 — histogram has just turned negative |
| ADX(14) | 17.7 | Below 20 — ranging, no established trend in either direction |
| ATR(14) | $0.033 (3.7%) | Moderate daily range for a sub-dollar ASX name |
| OBV (2y / 90d) | early distribution / early distribution | Both frames below their MA20 with flat slope; 90d divergence −21.1% |
| Volume vs 20d avg | 0.96× | 4,928,344 shares against a 5,138,119 average — an unremarkable session |
| 1×ATR / 2×ATR technical invalidation | $0.86 / $0.82 | Volatility-based structural reference levels below the close |
① Price & Moving Averages
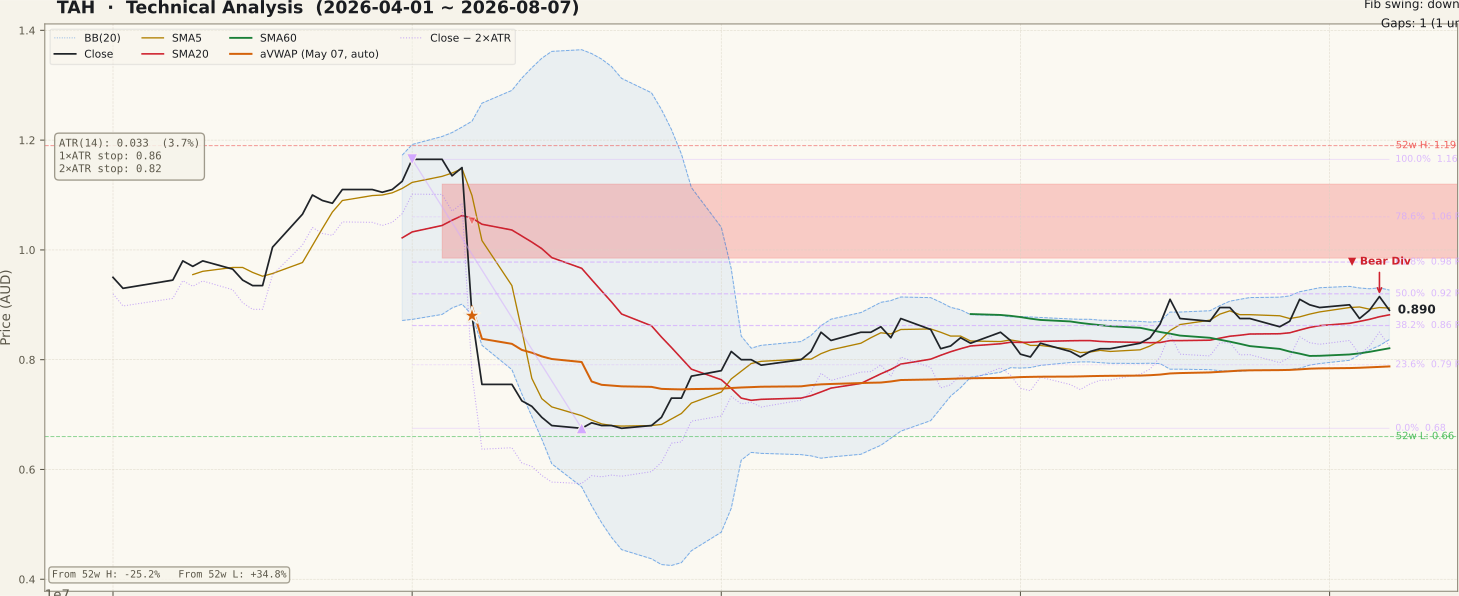
TAH_price-90d-2026-08-09.svgThe 90-day window is a study in two halves. The first is the May 7 gap and the slide that carried price from the $1.17 swing high down to $0.68 on May 18; the second is a patient staircase off that base which has lifted the close back to $0.89. The moving-average stack now reads constructively — SMA5 $0.89 above SMA20 $0.88 above SMA60 $0.82, all rising — although Friday's close finished fractionally under the SMA5 after the pullback from Thursday's $0.915. The SMA60 at $0.82 is the structural line under this repair: it has been reclaimed and has not been retested since.
Bollinger Bands frame the immediate range at $0.84–$0.93 around a $0.88 mid, with band width at 10.2% — a sharp contraction from the extreme readings of May, which is what a market does when it settles after a shock. The anchored VWAPs are the most telling split on this chart: price sits above the 90-day aVWAP of $0.79 (anchored at the May 7 gap session), so anyone positioned since the shock is on the right side of the average, but it sits below the two-year aVWAP of $0.92, so the average holder across the past year is not. That $0.92 line coincides almost exactly with the 50% retracement of the May down-swing ($0.92), making it the single most important price on the chart. Above it, the unfilled May 7 gap between $0.99 and $1.12 remains the dominant overhead supply zone, and the 61.8% retracement at $0.98 guards its lower edge.
② Volume

TAH_volume-90d-2026-08-09.svgFriday traded 4,928,344 shares against a 20-day average of 5,138,119 — a Vol/Avg ratio of 0.96×. That is the useful part of the reading: the down-day that produced the pullback came on slightly below-average turnover, so there is no evidence of a distribution surge in the pullback itself. Turnover at this level is comfortable for an ASX name of this size, so volume and OBV signals here carry more weight than they would in a thin small-cap.
The 90-day panel is still visually dominated by the May cluster, where the gap session and the days around it printed the largest bars on the entire two-year chart — many multiples of the running average. Bars of that scale are the fingerprint of a news event rather than ordinary two-way trade, and they distort every volume-derived average that passes through them. Since June the bars have settled into a mostly even green-and-red pattern with no repeated conviction spike on up-days, which is consistent with a range that is being repaired rather than one being resolved.
③ MACD

TAH_macd-90d-2026-08-09.svgMACD crossed below its signal line on August 7, 2026 — the same session as the pullback. The two lines are, however, almost on top of each other: 0.0152 against 0.0153, with a histogram of −0.00003. This is the shallowest kind of dead cross, a momentum stall rather than a decisive downturn, and it happens with both lines above the zero line, which keeps the medium-term configuration positive. The context that matters is where it occurred — right as price probed $0.915, just under the $0.92 confluence of the 50% retracement and the two-year aVWAP. A histogram that stays negative and widens from here would confirm that the ceiling did the work; a same-week reversal back above the signal line would mark it as noise.
④ RSI

TAH_rsi-90d-2026-08-09.svgThe RSI sits at 54.0 — neutral, above the 50 pivot, and nowhere near either extreme. The signal worth studying is the bearish divergence between two specific peaks: on July 16 price closed at $0.910 with the RSI at 67.2, and on August 6 price closed marginally higher at $0.915 while the RSI reached only 60.4. A higher price high on a lower momentum high is the classic regular bearish divergence, and it says the second push into the $0.91–$0.92 area was driven by less force than the first.
Two cautions belong with that observation. A divergence is a possibility of exhaustion, not a verdict — it can persist for weeks or be erased outright by a single strong session, and beginners routinely treat the pattern as a completed top before price has confirmed anything. Here the confirmation would be a close below the $0.88 shelf; without it, the divergence is a yellow flag on an otherwise neutral oscillator. Equally, the RSI never reached overbought territory on either peak, which limits how much exhaustion can reasonably be read into the pattern.
⑤ Mansfield Relative Strength

TAH_rs-90d-2026-08-09.svgMansfield RS versus the S&P/ASX 200 stands at −8.9%, firmly in underperform territory. The direction is more nuanced than the level. A month ago the reading was −10.9%, so on a monthly view the gap to the index has narrowed by 2.1 points — in negative territory that is improvement, movement back toward zero, not merely a slower decline. Week-over-week, though, the reading has gone from −5.2% to −8.9%, a 3.7-point deterioration: the stock gave back a fortnight of relative progress in the last five sessions.
The two-year panel puts both facts in context. RS was deeply negative through late 2024, spent most of 2025 and early 2026 above zero as an index outperformer, then collapsed through zero in May and has been grinding sideways in negative territory ever since. That is the honest frame for everything above: the price repair is real, but relative to the index the stock has not yet earned its way back. Negative RS is a standing caution even when the price structure looks constructive, because capital tends to concentrate in names already outperforming; a sustained move back above zero would be the piece of evidence this chart is currently missing.
⑥ ATR & ADX

TAH_atr_adx-90d-2026-08-09.svgATR(14) is $0.033, or 3.7% of price — elevated relative to the pre-May baseline but well down from the post-gap spike, which fits the picture of volatility normalising. This is the figure that sizes the structural reference levels: 1×ATR below the close sits at $0.86 and the 2×ATR technical invalidation level at $0.82. The second of those is notable because it lands almost exactly on the SMA60 ($0.82), so the volatility-derived line and the structural line agree — a rare and useful convergence.
ADX(14) at 17.7 (17.3 on the two-year frame) is below the 20 threshold, which classifies this as a ranging market with no established trend. It is worth remembering that ADX measures strength, not direction: a low reading does not mean weakness in the bullish sense, it means neither side is in control. In practice that supports treating the $0.84–$0.93 Bollinger channel as the operative structure and treating any single-session break of it sceptically until ADX starts rising through 20.
⑦ OBV

TAH_obv-90d-2026-08-09.svgUnusually, both timeframes agree here, and neither agrees with the price. On the 90-day window OBV is in early distribution: below its 20-day average, flat in slope, with a divergence reading of −21.1%. On the two-year window the state is the same — early distribution, below the MA20, flat — with a milder −0.83% divergence. In other words, price has recovered from $0.68 to $0.89 without volume flow rebuilding underneath it.
That is the clearest bearish non-confirmation on the page. Rising price on a flat-to-falling OBV line means the advance has been carried by relatively quiet sessions, while the heaviest turnover of the past year remains attached to the May decline. It does not invalidate the recovery — OBV is a cumulative measure and a shock of that size takes months to work off — but it does mean the repair has not yet been ratified by flow. The constructive change to look for is the 90-day OBV line crossing back above its MA20 and turning up while price holds the $0.88 shelf.
Bull Case
- Rising moving-average stack: SMA5 $0.89 > SMA20 $0.88 > SMA60 $0.82, with the close above the 20- and 60-day lines.
- Price above the 90-day anchored VWAP of $0.79 (anchored at the May 7 gap) — positioning since the shock is onside.
- Mansfield RS has improved 2.1 points from −10.9% a month ago, and the JSON slope tag reads rising.
- +34.8% off the $0.66 low, with the 23.6% ($0.79) and 38.2% ($0.86) retracements of the May down-swing both reclaimed.
- Bollinger width has compressed to 10.2% from the May extreme, with price holding the upper half of the $0.84–$0.93 channel.
- Friday's pullback came on 0.96× average volume — an orderly fade, not a distribution surge.
Bear Case
- Bearish RSI divergence: $0.910 on Jul 16 at RSI 67.2 versus $0.915 on Aug 6 at RSI 60.4.
- MACD dead cross on Aug 7 with the histogram turning negative (−0.00003), right at the $0.92 confluence.
- Mansfield RS −8.9% vs the S&P/ASX 200 — still below zero and 3.7 points worse week-over-week.
- OBV in early distribution on both timeframes — below MA20, flat, with a −21.1% 90-day divergence.
- Price below the two-year aVWAP of $0.92; the unfilled May 7 gap at $0.99–$1.12 caps the next leg.
- ADX 17.7 confirms no trend, and price remains 25.2% below the 52-week high of $1.19.
Scenarios
| Scenario | Probability | Path | Trigger / Invalidation |
|---|---|---|---|
| Range repair continues | ~40% | The $0.88–$0.86 band absorbs the pullback, the divergence expires without follow-through, and price works back up to the $0.92 confluence of the 50% retracement and the two-year aVWAP. | Trigger: a daily close above $0.93 (upper Bollinger Band) on above-average volume. Invalidated by a close below $0.86. |
| Divergence resolves lower | ~35% | The bearish RSI divergence and the MACD cross carry price through the SMA20 at $0.88 toward the lower Bollinger Band at $0.84 and the $0.82 SMA60 zone, where the repair structure is decided. | Trigger: a daily close below $0.88 with volume above the 20-day average. Invalidated by a reclaim of $0.92. |
| Repair fails | ~25% | The $0.82 area gives way, the moving-average stack unwinds, and price retraces toward the 23.6% level at $0.79 and the $0.68 May base. | Trigger: a daily close below the 2×ATR technical invalidation level at $0.82 — that ends the current swing structure. |
Key Levels & Volatility References
| Level | Role | Basis |
|---|---|---|
| $0.98 | Resistance | 61.8% retracement of the May down-swing; lower edge of the unfilled $0.99–$1.12 gap |
| $0.93 | Resistance | Upper Bollinger Band (20, 2σ) |
| $0.92 | Resistance | 50% retracement of the May down-swing, converging with the two-year aVWAP at $0.92 |
| $0.89 | Current close | Aug 7, 2026 close; fractionally below the SMA5 at $0.89 |
| $0.88 | Support | SMA20 and Bollinger mid — the first shelf under the pullback |
| $0.86 | Support | 38.2% retracement of the May down-swing, reclaimed in July; 1×ATR below the close |
| $0.82 | Invalidation | 2×ATR technical invalidation level below the Aug 7 close, converging with the SMA60 at $0.82 |
What to Watch
- Whether the $0.88 shelf (SMA20 and Bollinger mid) survives the pullback — a close beneath it is the confirmation the bearish RSI divergence currently lacks.
- The $0.92 confluence of the 50% retracement and the two-year anchored VWAP — reclaiming it puts the average holder of the past year back on side and opens the $0.98–$1.12 gap window.
- Mansfield RS versus the S&P/ASX 200: a return toward zero would validate the repair; further slippage from −8.9% would keep this a laggard regardless of price structure.
- The 90-day OBV crossing back above its MA20 with a rising slope — the flow ratification the recovery has not yet received.
- ADX rising through 20 while price holds the upper half of the $0.84–$0.93 channel — the first evidence that the range is resolving into a trend.