JB Hi-Fi Limited
This analysis is based on closing-price data as of August 7, 2026. Whether you're researching JB Hi-Fi Limited (JBH) on the ASX or learning how to read stock charts, here are objective support, resistance and technical invalidation levels built from the RSI, MACD and ATR indicators.
JBH is a repair story, not a leadership story. The stock peaked at $121.00 in September 2025, broke down hard through November, and bottomed at $67.38 — a 44% drawdown — before spending five months building a base. Friday's close of $84.36 is the highest of the 90-day window, with all four moving averages back in bullish alignment and relative strength versus the S&P/ASX 200 climbing off its lows, yet the stock still sits 30.3% below its 52-week high. The nuance worth slowing down for is that this new price high arrived with two quiet non-confirmations: RSI printed a lower high than it did in June, and 90-day OBV rolled over while price pushed up.
Snapshot as of August 7, 2026
| Item | Value | Read |
|---|---|---|
| Close | $84.36 | Highest close of the 90-day window; mid-range on the 2-year chart |
| 52-week range | $67.38 – $121.00 | −30.3% from the high · +25.2% off the low |
| SMA 5 / 20 / 60 | $83.29 / $79.87 / $77.15 | Bullish alignment, all rising; close 5.6% above SMA20 |
| Bollinger (20) | $85.12 / $79.87 / $74.62 · width 13.1% | Close just inside the upper band (0.9% below it); bands expanding from a narrow July |
| aVWAP | 2y $87.53 (Aug 11, 2025) · 90d $76.25 (May 6, 2026) | Above the 90-day anchor (+10.6%) but 3.6% below the 2-year anchor — long-term holders from 2025 are still under water |
| RSI(14) | 65.0 (90d) · 65.0 (2y) | Firm but not overbought; bearish divergence flagged on both frames |
| Mansfield RS (vs the S&P/ASX 200) | −11.1% | Still underperforming, but improving (prior week −11.6, prior month −15.8) |
| MACD (12,26,9) | 1.563 / signal 1.008 / hist +0.554 | Golden cross Jul 30, 2026 above the zero line; histogram widening |
| ADX(14) | 21.5 (90d) · 21.1 (2y) | Emerging trend — above 20, below the 25 strong-trend threshold |
| ATR(14) | $2.05 (2.4% of price) | Volatility mid-range and easing since the June expansion |
| OBV | 2y: above MA20, flat (+0.33% vs MA20), early accumulation · 90d: above MA20 but falling (+4.62%), weakening | Bearish OBV divergence flagged — price high not matched by volume flow |
| Volume (last vs 20-day avg) | 616,427 vs 393,799 · 1.6x | Above average into the new closing high |
| Technical invalidation (ATR-based) | 1×ATR $82.31 · 2×ATR $80.26 | 2×ATR level sits 4.9% below Friday's close |
① Price & Moving Averages
The two-year panel frames everything: a steady advance from the high $70s in mid-2024 to $121.00 in September 2025, a violent November breakdown that sliced through SMA60 on heavy volume, and a grinding decline to the $67.38 low. From there the chart shows five months of base-building between roughly $68 and $80 — the long, boring part of a repair — and only in the last two weeks has price cleared the upper edge of that range.
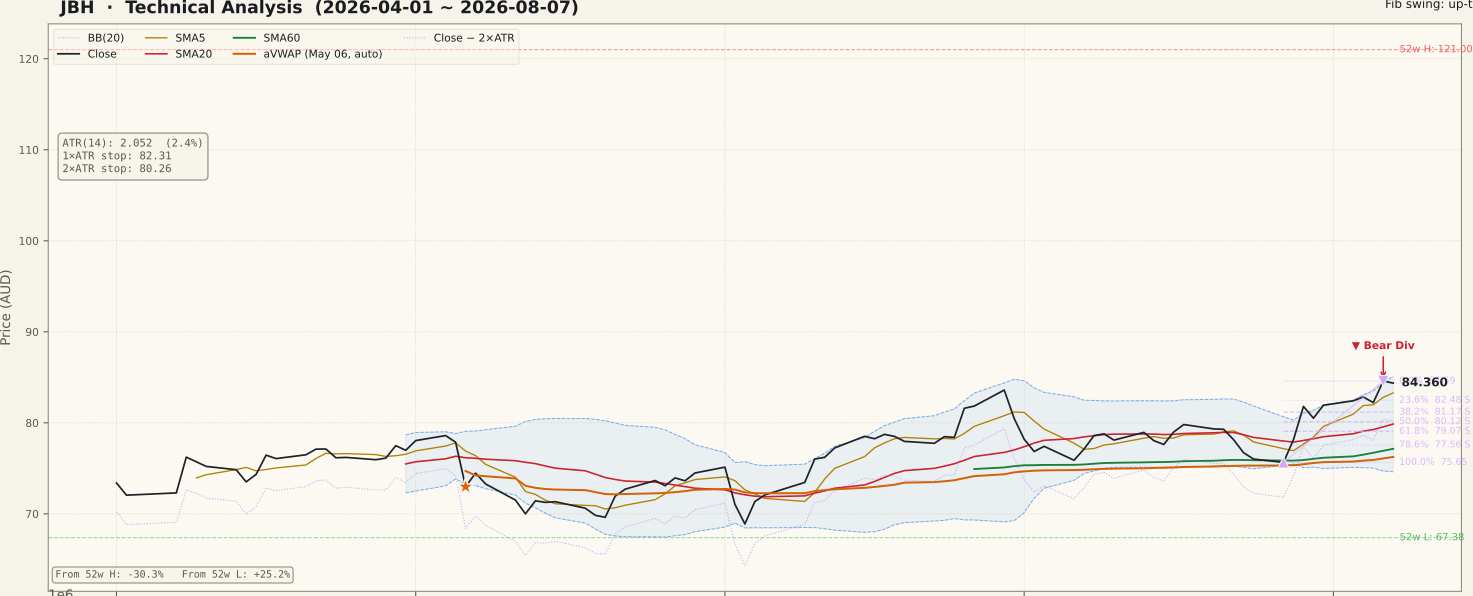
The 90-day panel is where the improvement is legible. After a June rally to $83.60 and a pullback to $75.65 on July 27, price ran back to $84.59 on August 6 and closed at $84.36 on August 7. The moving-average stack is now textbook bullish — close $84.36 above SMA5 $83.29, above SMA20 $79.87, above SMA60 $77.15, all sloping up — which is the structural condition our screen flagged. Retracement references from the July 27 → August 6 up-swing sit at $82.48 (23.6%), $81.17 (38.2%) and $80.12 (50%), with the swing origin $75.65 marking the 100% level. Overhead, the upper Bollinger Band is $85.12 and the 2-year aVWAP — anchored August 11, 2025, near the old top — is $87.53, the first genuinely heavy shelf of supply. No unfilled gaps remain on either timeframe (4 gaps on the 2-year chart, all closed).
② Volume

Friday turned over 616,427 shares against a 20-day average of 393,799 — 1.6x, a respectable confirmation for a fresh closing high without being a climax print. The 90-day panel shows the 20-day average drifting down through July as the pullback ran its course, so part of that 1.6x ratio reflects a low base rather than a surge of new participation. Only two spike bars (2x or more) appear across the whole 90-day window, one in early May and one in the last fortnight. JBH is a large, liquid ASX name, so the volume series itself is reliable — the question here is not data quality but whether turnover expands or fades as price approaches $85–$87.
③ MACD

MACD crossed above its signal line on July 30, 2026 and now reads 1.563 against a signal of 1.008, with the histogram at +0.554 and still widening. The 90-day panel shows this is the second momentum push of the quarter: the first ran into a dead cross in early July near a MACD of 2.1, after which the pair unwound to the zero line before turning back up. This cross happened above zero rather than below it, which reads as trend continuation rather than a first turn off a low. The reference point worth carrying forward is that July peak — momentum has not yet exceeded its own June-July high even though price has.
④ RSI

RSI(14) reads 65.0 — firm, trending, and short of the 70 overbought line, which leaves room before the reading itself becomes a constraint. The complication is the bearish divergence the data flags on both timeframes: on June 29 price closed at $83.60 with RSI at 74.15; on August 6 price made a higher high at $84.59 while RSI reached only 65.97. Price up, momentum down — a regular bearish divergence, and the reason a new closing high here is not the clean signal it looks like at a glance.
The honest caveat cuts the other way too. Divergence is a warning about the rate of the advance, not a reversal in itself; RSI can reset through sideways drift and re-accelerate, and this one has not been confirmed by any price breakdown. Treating a single divergence as a top call is one of the most common beginner errors on a chart like this — the confirmation would be a failure to hold the $82.48–$80.12 retracement band, which has not happened.
⑤ Mansfield Relative Strength

Mansfield RS versus the S&P/ASX 200 stands at −11.1% — below zero, so this stock is still lagging the index, and it has been on that side of the line since the November 2025 breakdown. What has changed is direction: the prior-week reading was −11.6% and the prior month −15.8%, giving a weekly change of +0.5 points and a monthly change of +4.7 points. In negative territory those positive changes mean improving, not accelerating — the gap to the index is closing, but the gap is still there.
The 2-year panel puts that in scale: RS was above +30 through late 2024, crossed below zero around November 2025, troughed near −30 in the first quarter of 2026, and has been climbing since April. Reading a rising RS line that is still negative as outperformance is a classic misread. This is a stock repairing its relative position, which historically precedes leadership — it is not leadership yet.
⑥ ATR & ADX

ADX(14) reads 21.5 on the 90-day frame and 21.1 on the 2-year — the "emerging" band: above the 20 line that separates chop from trend, but below the 25 threshold where a trend is usually called strong. The 90-day panel shows ADX declining through most of the quarter and only ticking up in the last week, consistent with a market that has been ranging and is just now attempting to trend. ADX measures strength, not direction, so this modest reading simply says the move is young.
ATR(14) is $2.05, or 2.4% of price, easing back from the June expansion. That volatility figure anchors the objective risk arithmetic on this chart: the 1×ATR reference sits at $82.31 and the 2×ATR technical invalidation level at $80.26 — 4.9% below Friday's close, and effectively on top of the 50% retracement at $80.12. A daily close beneath $80.26 would mean the August thrust has failed by this chart's own volatility yardstick, whatever the narrative around it.
⑦ OBV (On-Balance Volume)

The two timeframes disagree, and both readings matter. On the 2-year series OBV is tagged early accumulation — above its 20-day average, but by only 0.33%, with a flat slope, and still deep in negative territory after the November 2025 distribution phase. That is the faintest possible positive: a series that has stopped falling rather than one that is being bid.
On the 90-day series the state is weakening: OBV sits 4.62% above its MA20 but the slope is falling, and the panel shows it peaked around the start of July and has made lower highs while price made a higher high — the OBV bearish divergence the chart flags. Price at a 90-day high with volume flow lagging is the textbook non-confirmation, and alongside the RSI divergence it is the single most important reservation on this chart.
Bull Case
- Bullish MA alignment — close $84.36 > SMA5 $83.29 > SMA20 $79.87 > SMA60 $77.15, all rising.
- Highest close of the 90-day window, clearing the June swing high $83.60 and the five-month base ceiling.
- MACD golden cross on July 30 above the zero line, histogram widening to +0.554.
- Mansfield RS improving from −15.8% a month ago to −11.1%, off a −30 trough in Q1 2026.
- Volume 1.6x the 20-day average into the new closing high; no unfilled gaps overhead on either timeframe.
- RSI 65.0 is firm without being overbought, and price closed 10.6% above the 90-day aVWAP $76.25 — buyers from the May anchor are in profit.
Bear Case
- Bearish RSI divergence: $83.60 at RSI 74.15 (Jun 29) versus $84.59 at RSI 65.97 (Aug 6) — momentum lagging price.
- Bearish OBV divergence on the 90-day frame — flow falling while price made a higher high; the 2-year OBV is only 0.33% above its MA20 and flat.
- Mansfield RS is still −11.1%, below zero since November 2025 — improving, but the stock continues to lag the S&P/ASX 200.
- Price remains 30.3% below the 52-week high $121.00, with the 2-year aVWAP $87.53 marking unresolved supply 3.8% overhead.
- ADX 21.5 is only "emerging" — the trend is not yet strong by this measure, and the 90-day series was falling until last week.
- The last leg ran $75.65 → $84.59 in eight sessions, roughly 4.4 ATRs, leaving the nearest structural shelf several percent below.
Scenarios
| Scenario | Probability | Path | Trigger / Invalidation |
|---|---|---|---|
| Digest the thrust, then extend | 40% | Price pauses or eases into the $82.48–$80.12 retracement band (23.6–50% of the July 27 → August 6 swing), works off the RSI divergence through sideways time, then clears $84.59 and the upper band $85.12. | Trigger: closes holding above $80.12, then a volume-backed close above $85.12. Invalidated on a daily close below $80.26 (2×ATR). |
| Divergences resolve lower | 35% | The RSI and OBV non-confirmations play out: the August high $84.59 caps the move and price fades to SMA20 / Bollinger mid $79.87 and the 61.8% retracement $79.07, testing whether the base ceiling now acts as a support retest zone. | Trigger: rejection at $84.59–$85.12 with expanding down-volume days. A daily close below $80.26 confirms this path. |
| Direct run at the 2-year aVWAP | 25% | Momentum overrides the divergences: price clears $84.59 and $85.12 without resting and pushes toward $87.53, the 2-year aVWAP anchored near the August 2025 top — the measured shelf where 2025 supply sits. | Trigger: a close above $85.12 on 2x or higher average volume. Loses credibility if price reverses back beneath $82.48 within days. |
Key Levels & Volatility References
| Price | Role | Basis |
|---|---|---|
| $87.53 | Upside resistance level | 2-year aVWAP anchored Aug 11, 2025 — average cost of the 2025 top, 3.8% above Friday's close |
| $85.12 | Upside resistance level | Upper Bollinger Band (20) — 0.9% above Friday's close |
| $84.59 | Upside resistance level | Aug 6 swing high — the 0% anchor of the current up-swing, and the second divergence peak |
| $84.36 | Current close | Fri, Aug 7 close · 30.3% below the 52-week high, 25.2% above the 52-week low |
| $82.48 | Support | 23.6% retracement of the Jul 27 → Aug 6 swing; 1×ATR reference $82.31 and SMA5 $83.29 in the same pocket |
| $80.26 | Technical invalidation (2×ATR) | Close − 2×ATR(14) · 4.9% below Friday's close; the 50% retracement $80.12 sits immediately beneath |
| $79.87 | Support retest zone | SMA20 and the Bollinger mid-band, with the 61.8% retracement $79.07 just below — the ceiling of the five-month base |
What to Watch
- $84.59 and $85.12. A daily close above the August high and the upper Bollinger Band on expanding turnover would override the momentum divergences; a stall there on fading volume would confirm them.
- Whether RSI resets sideways or through price. Momentum cooling while price chops between $82 and $85 repairs the divergence; momentum cooling because price drops does not.
- OBV versus its early-July peak. A push in on-balance volume back above that level would remove the clearest non-confirmation on this chart.
- The $80.12–$79.87 shelf. The 50% retracement, SMA20 and Bollinger mid-band cluster there, one tick above the 2×ATR technical invalidation level $80.26 — the structural line between a healthy retest and a failed thrust.
- Any outsized single-day candle with a catalyst. Australian retailers report results in August, and a large gap on heavy volume would be news-driven; a move like that deserves a look at the announcement before the chart is read on its own.