Lovisa Holdings
This analysis is based on closing-price data as of October 16, 2026. Whether you're researching Lovisa Holdings (LOV) on the ASX or learning how to read stock charts, here are objective support, resistance and technical invalidation levels built from the RSI, MACD and ATR indicators.
Lovisa Holdings closed at $25.24 on October 16, a close above the prior 20-session closing high ($24.79, Sep 24) that came one week after an Oct 8 drop of −9.15% on the day the company announced the resignation of its Group CFO. The two-year chart is a large round trip — a rally to the low $40s in September 2025, a long decline that included a −12.8% day on Feb 19, 2026 and a $19.30 52-week low in March, and a broad $20–$27 range since. In the short term, every moving-average and MACD condition has re-formed within the last four sessions, and RSI and OBV both carry bullish divergences into the Oct 8 low. Against that, relative strength versus the S&P/ASX 200 is still negative, ADX is low at 12.5, and SMA20 and SMA60 are almost level with each other — the structure is a recovery inside a range, not yet an established trend.
Snapshot as of October 16, 2026
| Item | Value | Reading |
|---|---|---|
| Close | $25.24 | −35.8% from 52w high · +30.8% from 52w low |
| 52-week range | $19.30 – $39.33 | Close in the lower-middle of the range; the high dates from late October 2025 |
| SMA 5 / 20 / 60 | $24.42 / $24.24 / $24.22 | Close > SMA5 > SMA20 > SMA60, completed on Oct 16. SMA20 and SMA60 are only about $0.03 apart — a flat base rather than a spread-out uptrend |
| Bollinger (20) | $25.43 / $24.24 / $23.06 | Band width 9.8%; close 0.8% below the upper band |
| aVWAP (2y anchor Feb 19, 2026) | $23.10 | Price above the average anchored to the Feb 19 decline bar |
| aVWAP (90d anchor Aug 26, 2026) | $24.05 | Price back above the average anchored to the Aug 26 spike bar |
| RSI(14) | 58.1 | Above 50; bullish RSI divergence flagged (Sep 18 vs Oct 8) |
| Mansfield RS (vs the S&P/ASX 200) | −3.45% | Underperforming but rising; +6.33 points on the week and +12.54 on the month (negative, improving) |
| MACD (12,26,9) | 0.1592 / 0.0806 / +0.0787 | Golden cross on Oct 14, just above the zero line |
| ADX(14) | 12.5 | Ranging (12.2 on the two-year frame) — no established trend |
| ATR(14) | $0.984 (3.9%) | 2×ATR spans 7.8% of the share price |
| OBV (2y / 90d) | early accumulation / accumulation | Above MA20 on both frames (flat on 2y, rising on 90d); bullish OBV divergence on both |
| Volume vs 20d avg | 1.034× | 425,213 shares against a 411,315 average; about 1.16× after adjusting for the market (universe median 0.89× on Oct 16) |
| 1×ATR / 2×ATR technical invalidation | $24.26 / $23.27 | Volatility-based structural reference levels below the close |
① Price & Moving Averages
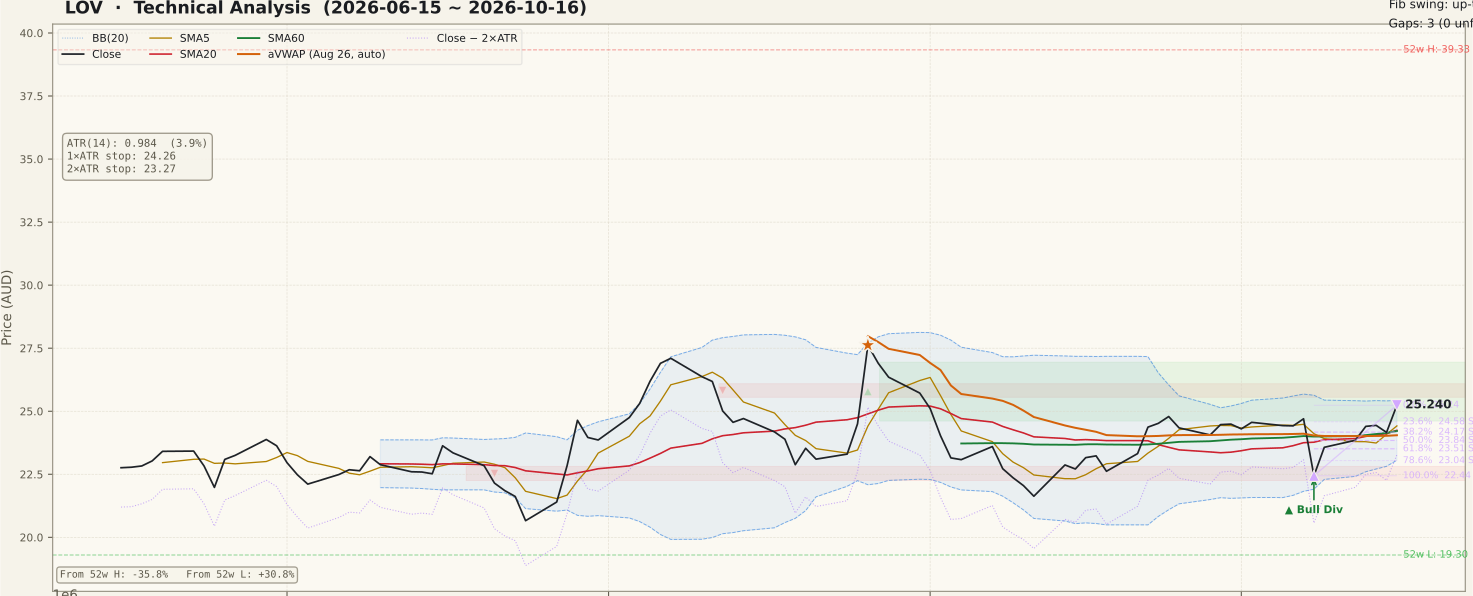
LOV_price-90d-2026-10-18.svgThe two-year frame shows a full cycle. The share price climbed from around $21 in April 2025 to a peak above $40 in September 2025, then declined through the rest of 2025. A rebound toward $31 in mid-February 2026 ended with a −12.8% day on Feb 19 (about 4.3× average volume) that left an unfilled gap at $28.38–$29.75, and a slide into March set the $19.30 52-week low. Since then price has moved within a broad $20–$27 range. That gap is the nearest unfilled gap on either frame and sits well above the current price.
On the 90-day frame, a run of 20-session closing highs in late July and early August took price to $27.10 (Aug 7), and an Aug 26 spike of +12.7% (about 2.95× volume) closed at $27.62 before an unwind to $21.63 on Sep 11. Late September and early October formed a tight $24.06–$24.79 closing range. On Oct 8 the price fell −9.15% to $22.44 on the day the company announced that its Group CFO had resigned (six months' notice, with a successor to be announced); that bar is seven sessions before the basis date. Price then recovered over the following week.
The timing of each condition in the current run: the close moved back above both SMA20 and SMA60 on Oct 13 (+2.31%); SMA5 crossed above SMA20, and SMA20 edged above SMA60, to complete the SMA5 > SMA20 > SMA60 ordering on Oct 16; and the bucket's defining condition — a close above the prior 20-session closing high ($24.79, Sep 24) — also first appeared on Oct 16 (+4.47%, 1.034× volume). No company announcement was found for Oct 16. The 90-day Fibonacci swing runs from the $22.44 Oct 8 low to the $25.24 close: the 23.6% retracement is $24.58, 38.2% is $24.17 and 50% is $23.84. On the longer swing from the $27.62 Aug 26 high to the $21.63 Sep 11 low, the close sits just under the 61.8% retracement at $25.33, with 78.6% at $26.34.
② Volume

LOV_volume-90d-2026-10-18.svgThe largest bars on the 90-day panel are Aug 26 (the +12.7% spike), Sep 14 and Sep 18 (Sep 18 was the S&P/ASX quarterly rebalance trading day, busy across the market) and Oct 8 — the CFO-resignation drop, 1,105,748 shares or about 2.1× the 20-day average. The recovery that followed came on lighter turnover: roughly 0.5–0.7× average on Oct 12–14, 1.30× on the small Oct 15 decline, and 1.034× on the Oct 16 breakout bar (425,213 shares against a 411,315 average).
Market context matters here. The median stock in the screened ASX universe traded 0.62–0.89× its own average across Oct 12–16 except Oct 15 (1.28×). Adjusted for that, the Oct 16 bar ran at about 1.16× — modestly above the market's typical participation but far from an exceptional volume event. A close above a 20-session high on roughly average volume is a quieter breakout than a high-volume one, and it leaves the volume confirmation still to come. These adjustments are approximate, because each 20-day average includes the current day.
③ MACD

LOV_macd-90d-2026-10-18.svgThe MACD line is 0.1592 against a signal of 0.0806, a histogram of +0.0787. The latest golden cross printed on Oct 14, after the Oct 8 drop had briefly pushed the MACD line below its signal. Both lines sit only slightly above zero, so this is a cross from a neutral position rather than from deep negative territory. The August and early-September MACD peaks were considerably higher than the current reading, so momentum on this measure is recovering but has not returned to its summer level.
④ RSI

LOV_rsi-90d-2026-10-18.svgRSI(14) is 58.1 on both frames, comfortably between the 50 midline and the 70 overbought line. A bullish RSI divergence is flagged: on the 90-day frame, price made a slightly lower low on Oct 8 ($22.44, RSI 39.02) than on Sep 18 ($22.62, RSI 36.96), while RSI made a higher low (the two-year frame shows 37.08 then 39.05). The price difference between the two lows is small — about 0.8% — so the divergence describes a double-bottom-like area more than a strong momentum signal. A divergence is the possibility of a turn, not a confirmed bottom; the subsequent recovery above $24.79 is the first follow-through.
⑤ Mansfield Relative Strength

LOV_rs-90d-2026-10-18.svgMansfield RS vs the S&P/ASX 200 is −3.45%, still below zero (underperforming) with a rising slope. A week earlier it was −9.78 and a month earlier −15.98, so it gained 6.33 points on the week and 12.54 points on the month — negative but improving on both horizons. The two-year panel shows RS well above zero through the 2025 rally, then a fall into the −30s after the February 2026 decline, and a gradual climb since mid-2026. A negative-but-improving reading means the stock is closing the gap with the index; it has not yet crossed into outperformance, and a cross above zero would be the next confirmation on this measure.
⑥ ATR & ADX

LOV_atr_adx-90d-2026-10-18.svgATR(14) is $0.984, or 3.9% of price, which places the 1×ATR reference at $24.26 and the 2×ATR technical invalidation level at $23.27, 7.8% below the close. ATR stepped up after the Aug 26 bar, eased through early October, then rose again with the Oct 8 drop. ADX is 12.5 (12.2 on the two-year frame), in the ranging zone below 20 and drifting lower. ADX measures trend strength, not direction: at this level the chart is describing a range, and the breakout has not yet produced a measurable trend. A rise through 20 would be the first sign of one forming.
⑦ OBV

LOV_obv-90d-2026-10-18.svgOBV is tagged accumulation on the 90-day frame (above its MA20 and rising) and early accumulation on the two-year frame (above its MA20 but flat). A bullish OBV divergence is flagged on both frames, at the same two lows as RSI: on the 90-day frame OBV was −2,649,085 at the Sep 18 low ($22.62) and −390,170 at the lower Oct 8 low ($22.44) — a higher OBV low despite the lower price (two-year frame: −10,474,621 then −8,215,706, a different cumulative baseline). Volume flow therefore did not deteriorate as much as price did on Oct 8.
The OBV-to-MA20 gap is +6.23% on the two-year frame; the 90-day figure of +156.06% overstates strength because the 90-day MA20 sits close to zero. These percentages measure distance from the moving average, not divergence. On the longer view, two-year OBV remains far below its 2025 levels after the heavy-volume declines of February–March 2026.
Bull Case vs Bear Case
Bull Case
- Close above the prior 20-session closing high ($24.79) on Oct 16, the first since Aug 26
- Full Close > SMA5 > SMA20 > SMA60 ordering on Oct 16; price above both anchored VWAPs ($23.10 and $24.05)
- MACD golden cross on Oct 14 from near the zero line
- Bullish RSI and OBV divergences into the Oct 8 low, with price recovering the whole Oct 8 drop within six sessions
- Mansfield RS +6.33 points on the week and +12.54 on the month
- OBV in accumulation on the 90-day frame, above MA20 on both frames
Bear Case
- Mansfield RS still negative (−3.45%) — the stock has not yet outperformed the S&P/ASX 200
- ADX 12.5 — ranging, no trend strength behind the breakout
- Breakout bar on roughly average volume (1.034×, about 1.16× market-adjusted)
- SMA20 and SMA60 almost level ($24.24 / $24.22) — the MA ordering is one session old and fragile
- Close sits just under the $25.33 61.8% retracement and the $25.43 upper Bollinger Band
- CFO departure announced Oct 8 (successor not yet named); the Oct 8 bar is the most recent heavy-volume decline
Scenarios
| Scenario | Probability | Path | Trigger / Invalidation |
|---|---|---|---|
| Breakout extends toward the August highs | 30% | Price clears the $25.33–$25.43 area (61.8% retracement and upper band) and works toward the $26.34 78.6% retracement and the $27.10–$27.62 August highs | Trigger: closes above $25.43 with volume above average and RS crossing zero. Invalidation: a close back below $24.58 (90-day 23.6% retracement) |
| Range continues around the breakout | 45% | Price stalls near $25.33 and drifts back toward the $24.17–$24.58 retracement zone and the clustered SMAs near $24.24, consistent with an ADX still in ranging territory | Trigger: closes back below SMA5 ($24.42). The structure holds while closes stay above the $23.27 2×ATR level |
| Breakout fails back toward the Oct 8 low | 25% | The quiet-volume breakout does not hold and price returns toward the $23.04–$23.51 lower retracements and the $22.44 Oct 8 low | Trigger: a daily close below $23.27 (2×ATR technical invalidation) |
Key Levels & Volatility References
| Level | Role | Distance | Basis |
|---|---|---|---|
| $26.34 | Resistance | +4.4% | 78.6% retracement of the Aug 26 – Sep 11 decline ($27.62 → $21.63) |
| $25.33 | Resistance | +0.4% | 61.8% retracement of the same decline; upper Bollinger Band $25.43 just above |
| $25.24 | Current | — | Oct 16, 2026 close; new 20-session closing high |
| $24.58 | Support | −2.6% | Fibonacci 23.6% retracement of the Oct 8 – Oct 16 swing; the $24.79 Sep 24 closing high (prior 20-session high) just above |
| $24.24 | Support | −3.9% | SMA20 / Bollinger mid line, with the 1×ATR reference ($24.26) and SMA60 ($24.22) clustered |
| $23.27 | Invalidation | −7.8% | 2×ATR technical invalidation level |
| $23.10 | Support | −8.5% | Two-year aVWAP (anchor Feb 19, 2026); 78.6% retracement of the Oct 8 – Oct 16 swing ($23.04) alongside |
What to Watch
- The $25.33–$25.43 area. The 61.8% retracement and the upper Bollinger Band sit directly overhead. Closes above them would carry the breakout past the first resistance.
- Volume on further gains. The breakout bar traded about average volume. Advances above average would show broader participation than the Oct 16 bar.
- Mansfield RS crossing zero. At −3.45% and improving, a move above zero would mark outright outperformance versus the S&P/ASX 200.
- ADX rising through 20. At 12.5 the chart is still in a range; a rising ADX would show the move gaining persistence.
- The $23.27 level. A daily close below the 2×ATR technical invalidation level would undo the recovery from the Oct 8 low.