Technology ONE
This analysis is based on closing-price data as of October 16, 2026. Whether you're researching Technology ONE (TNE) on the ASX or learning how to read stock charts, here are objective support, resistance and technical invalidation levels built from the RSI, MACD and ATR indicators.
Technology ONE closed at $31.91, 20.2% below its $39.99 52-week high and 58.4% above the $20.14 low. The two-year chart shows a steep decline from that high in late 2025 into an early-2026 trough, followed by a recovery that since May has moved in a sideways band of roughly $28 to $34 — the larger picture is a repair inside a range, not a re-established uptrend. Friday's session closed at a new 20-day closing high on 1.6× average volume, put the close back above the 60-day line for the first time since September, and lifted Mansfield RS to +8.6% against the S&P/ASX 200. The short-term moving averages are still not in bullish order (SMA20 sits below SMA60), ADX of 20.5 only registers an emerging trend, and OBV shows a bearish divergence on the 90-day frame; no company announcement was found for the October 16 move, so its catalyst is not identified.
Snapshot as of October 16, 2026
| Item | Value | Reading |
|---|---|---|
| Close | $31.91 | −20.2% from 52w high · +58.4% from 52w low |
| 52-week range | $20.14 – $39.99 | Close in the upper-middle of the range, a fifth below the high |
| SMA 5 / 20 / 60 | $31.10 / $30.12 / $30.87 | Close > SMA5 > SMA60 > SMA20 — above all three, but SMA20 is still below SMA60, so the SMA5 > SMA20 > SMA60 alignment is not in place |
| Bollinger (20) | $31.92 / $30.12 / $28.33 | Band width 11.92%; the close sits at the upper band ($31.917) |
| aVWAP (2y anchor Nov 18, 2025) | $28.24 | Price 13.0% above the long-horizon anchored average |
| aVWAP (90d anchor Jul 29, 2026) | $30.71 | Price 3.9% above the short-horizon anchored average |
| RSI(14) | 60.9 | Above 50, not overbought; bullish divergence flagged — $31.64 at RSI 42.08 on Aug 27 versus a lower $30.62 at a higher RSI 52.76 on Oct 15 |
| Mansfield RS (vs the S&P/ASX 200) | +8.6% | Outperforming, slope rising; +1.60 points on the week and +11.15 points on the month (accelerating, crossed above zero) |
| MACD (12,26,9) | 0.316 / 0.091 / 0.225 | Golden cross on Sep 23 from below zero; MACD line now above zero with a positive histogram |
| ADX(14) | 20.5 | Emerging trend — just over 20 (20.2 on the two-year frame) |
| ATR(14) | $0.930 (2.9%) | Moderate daily range; 2×ATR spans 5.8% of the share price |
| OBV (2y / 90d) | early accumulation / early accumulation | Above MA20 and flat on both frames; the 90-day frame flags a bearish OBV divergence |
| Volume vs 20d avg | 1.62× | 1,105,966 shares against a 684,858 average; the universe median that day was 0.89× |
| 1×ATR / 2×ATR technical invalidation | $30.98 / $30.05 | Volatility-based structural reference levels 2.9% and 5.8% below the close |
① Price & Moving Averages
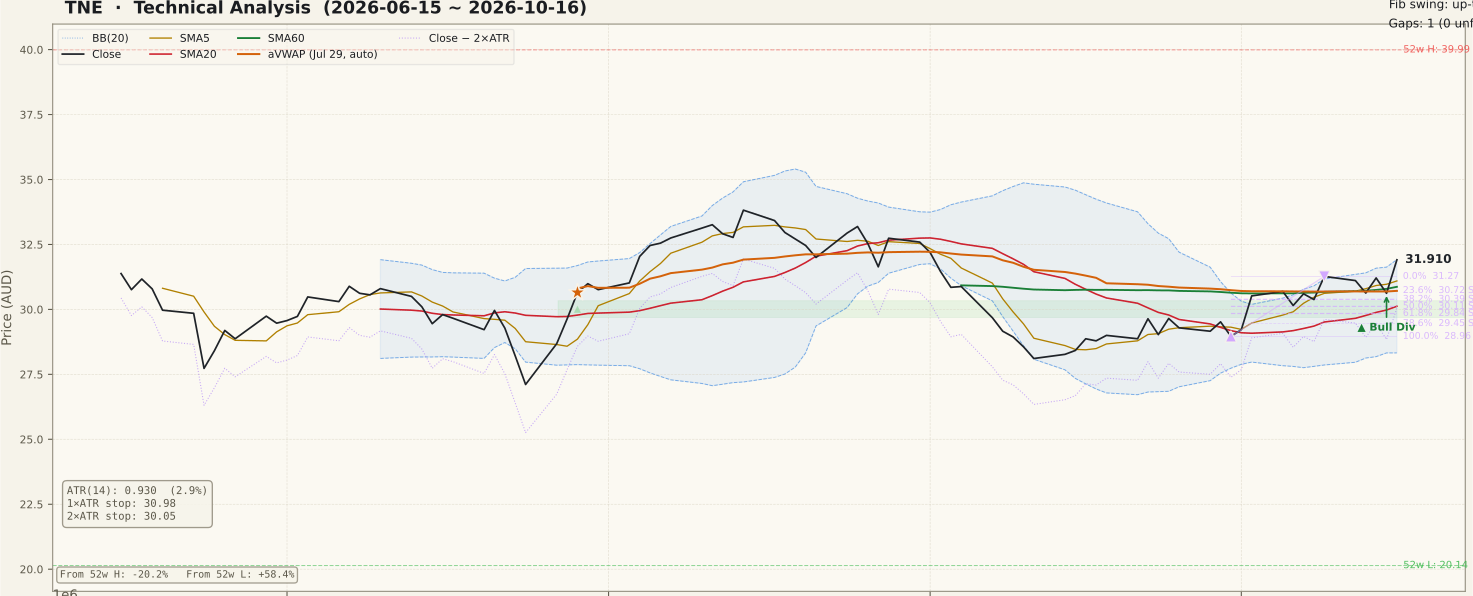
The close of $31.91 sits above SMA5 ($31.10), SMA60 ($30.87) and SMA20 ($30.12), but the averages themselves are out of order: SMA20 remains below a flat SMA60, a leftover of the September slide from the August swing high of $33.82. The close-above-SMA60 condition was re-established only on Friday — the same bar that set the new 20-day closing high — so it rests on one session. SMA5 crossed back above SMA20 on September 29 and the close has held above SMA20 since October 1.
Friday's close landed on the upper Bollinger Band ($31.92) with a band width of 11.92%; a close at the band shows momentum, but it also leaves little room before price is stretched relative to its 20-day average (5.9% above SMA20). The 90-day Fibonacci swing (Sep 30 low $28.96 to Oct 9 high $31.27) has been exceeded: the $31.27 0% anchor, listed as resistance in the data, is now below the close and becomes the first support retest zone, with the two-year 38.2% level ($31.26) at virtually the same price. Overhead, the two-year swing's 23.6% level at $32.24 and its $33.82 August high are the reference points; note that the data labels $32.24 as support, but it currently sits above the close. Both aVWAPs ($30.71 short-horizon, $28.24 long-horizon) are below price.
② Volume

Friday's 1,105,966 shares were 1.62× the 20-day average of 684,858, and on a day when the median ASX stock in the screened universe traded 0.89× its own average, so the participation was genuinely above market-typical — though well short of a surge. It is the best-supported of the three recent 20-day closing highs: the earlier ones on October 5 and October 9 came on thin volume.
The prior session (October 15) fell on above-average volume, so Friday partly recovered that. The tallest bar in the 90-day window, on September 18, coincided with the S&P/ASX September quarterly index-rebalance trading day and moved price by less than 1%; it is not part of the current setup. With volume confirmation still modest, a follow-through day on similar or higher participation would carry more weight than the breakout bar alone.
③ MACD

MACD made a golden cross on September 23 from well below the zero line, which is the early-stage type of crossover. Since then the MACD line (0.316) has climbed above zero and now leads the signal line (0.091), with a histogram of 0.225. The histogram has been positive for roughly three weeks and widened again on Friday's bar, so momentum is improving rather than fading. The two-year frame reads the same (0.317 / 0.093 / 0.225).
④ RSI

RSI(14) is 60.9 — above the 50 midline that separates bullish and bearish momentum regimes, and still below the 70 overbought band. The data flags a bullish RSI divergence: price was $31.64 with RSI 42.08 on August 27, then made a lower $30.62 on October 15 while RSI held a higher 52.76. Friday's rise away from that second point is the first follow-through. A divergence is a possibility of reversal, not a confirmation; it would be undone by a close back below $30.62 with RSI under 52.76.
⑤ Mansfield RS

Mansfield RS vs the S&P/ASX 200 is +8.6% with a rising slope — the highest reading in the 90-day window. A week ago it was +7.01 (+1.60 points) and a month ago −2.54 (+11.15 points), so relative strength has moved from underperformance to outperformance and is still accelerating. For context, the two-year panel shows RS spent late 2025 and the first half of 2026 below zero, at one point deeply negative, during the decline from the 52-week high; the current positive reading is recent and has not yet been tested by a market pullback.
⑥ ATR · ADX

ATR(14) is $0.930, or 2.9% of price, ticking up with Friday's wider range. That places the 1×ATR reference at $30.98 and the 2×ATR technical invalidation level at $30.05, 5.8% below the close. ADX of 20.5 (20.2 on the two-year frame) sits just inside the 20–25 "emerging" zone after drifting between the high teens and the high 20s since August — a trend is starting to register, but the strength reading remains weak. ADX measures strength, not direction.
⑦ OBV

OBV is in early accumulation on both frames — above its 20-day average with a flat slope (two-year spread 2.32%, 90-day spread 9.96%). The 90-day frame, however, flags a bearish OBV divergence: price rose from $29.65 on September 24 to $31.91 on October 16, while OBV slipped from −4,745,355 to −4,988,792. In other words, the move to a new short-term high has not yet been matched by net volume flow. The RSI divergence points the other way, so the two oscillators disagree — neither should be read as settled. The two-year OBV line has been drifting lower since its April 2026 peak.
Bull Case vs Bear Case
Bull Case
- New 20-day closing high on 1.62× volume, against a 0.89× market median that day.
- Close above SMA5, SMA20 and SMA60, and above both aVWAPs ($30.71 and $28.24).
- MACD golden cross from below zero on Sep 23; MACD now above zero, histogram 0.225.
- Bullish RSI divergence ($31.64 / 42.08 on Aug 27 → $30.62 / 52.76 on Oct 15); RSI 60.9.
- Mansfield RS +8.6% vs the S&P/ASX 200, +11.15 points on the month.
- Support retest zone close by: $31.26–$31.27, then the $30.71–$30.87 aVWAP/SMA60 band.
Bear Case
- SMA20 ($30.12) still below SMA60 ($30.87) — the average alignment is not in place.
- Close above SMA60 re-established on one bar only (Oct 16).
- Bearish OBV divergence on the 90-day frame ($29.65 → $31.91 price, OBV lower).
- Close at the upper Bollinger Band and 5.9% above SMA20 — stretched in the short term.
- ADX 20.5: trend strength only emerging; two-year chart is a range since May.
- 20.2% below the 52-week high after a steep late-2025 decline; catalyst for the Oct 16 move not identified.
Scenarios
| Scenario | Probability | Path | Trigger / Invalidation |
|---|---|---|---|
| Breakout follows through | 35% | Price holds above the $31.27 zone and works toward the $32.24 level and then the $33.82 August swing high, with SMA20 turning up through SMA60. | Trigger: daily closes above $32.24 on above-average volume. Invalidation: a close back below $31.27. |
| Retest within the range | 40% | Price slips back into the $30.71–$31.27 band (aVWAP, SMA60, prior swing high) and consolidates there while the averages realign. | Holding above $30.05 keeps the structure intact; a quiet pullback that preserves the OBV line would be the constructive version. |
| Breakout fails | 25% | The one-bar move above SMA60 reverses, price returns below the 60-day line and toward the $29.84–$28.96 lower end of the 90-day swing. | A daily close below the $30.05 2×ATR technical invalidation level. |
Key Levels & Volatility References
| Price | Role | Basis |
|---|---|---|
| $33.82 | Resistance | Two-year Fibonacci 0% anchor — Aug 14, 2026 swing high · 6.0% above |
| $32.24 | Resistance | Two-year Fibonacci 23.6% level (labelled support in the data, but above the close until reclaimed) · 1.0% above; upper Bollinger Band $31.92 just below it |
| $31.91 | Current | Oct 16, 2026 close |
| $31.27 | Support | 90-day Fibonacci 0% anchor (Oct 9 swing high), two-year 38.2% at $31.26 · 2.0% below |
| $30.87 | Support | SMA60 · 3.3% below; 1×ATR reference $30.98 just above |
| $30.71 | Support | 90-day aVWAP (Jul 29 anchor) · 3.8% below |
| $30.05 | Invalidation | 2×ATR technical invalidation level · 5.8% below; SMA20 $30.12 just above |
What to Watch
- The $31.27 zone. The prior swing high and the two-year 38.2% level coincide here. Closes that stay above it keep Friday's breakout intact; a return below it would make the move a one-day excursion.
- SMA20 versus SMA60. SMA20 ($30.12) is still under SMA60 ($30.87). A cross would complete the moving-average repair that the September slide undid.
- Volume on the next up day. Friday's 1.62× was above market-typical but modest. Follow-through above $32.24 on similar or higher volume would weigh more than the breakout bar.
- The OBV divergence. OBV moving above its September 24 reading (−4,745,355) would erase the bearish divergence; further lag while price rises would deepen it.
- ADX above 25. At 20.5 the trend is only emerging; a rise through 25 would show the move has directional strength.